Characterization of transport and magnetic properties in thin film La0.67(CaxSr1-x)0.33MnO3 mixtures
Abstract
We have grown thin films of (100) oriented La0.67(CaxSr1-x)0.33MnO3 on (100) NdGaO3 substrates by off-axis sputtering. We have looked at the changes in the resistivity and magnetoresistance of the samples as the Ca/Sr ratio was varied. We find that as the calcium fraction is decreased, the lattice match to the substrate decreases, and the films become more disordered, as observed in transport measurements and the variation in Curie and peak resistance temperatures. We find a correlation between the temperature independent and T2 terms to the low temperature resistivity. The room temperature magnetoresistance exhibits a maximum as the peak temperature is increased by the substitution of Sr for Ca, and a change in the field dependence to the resistivity at room temperature is observed.
pacs:
73.50.-h, 73.50.Jt, 75.70.-i, 81.05.JeI Introduction
The effect of dopants for the ABO3-type manganese oxides has been an area of intense research activity, primarily for attempting to understand the physics behind the colossal magnetoresistance (CMR) behavior seen in these materials. Typically, studies have been carried out either by replacing the trivalent ion[1, 2, 3] or the Mn ion.[4, 5, 6] Recently[7] a study of polycrystalline La0.75Ca0.25-xSrxMnO3 was carried out in order to look at changes in magnetic entropy, where the doping variation is on the divalent site. In the work by Hwang et al.[3] the system La0.7(CaxSr1-x)0.3MnO3 was looked at, and exhibited a change in the tolerance factor t, which is defined as , from 1.2 to 1.24. We have undertaken a study of the changes in electronic, structural, and magnetic properties of thin films of La0.67(CaxSr1-x)0.33MnO3 (LCSMO) as the Ca/Sr ratio is varied.
II Sample preparation and characterization
Our samples were grown by off-axis sputtering using composite targets of La0.67Ca0.33MnO3 (LCMO) and La0.67Sr0.33MnO3 (LSMO) material mounted in copper cups. The substrates were (100) oriented neodymium gallate (NdGaO3), silver-pasted onto a stainless steel substrate holder that was radiatively heated from behind by quartz lamps. Although there was no direct measurement of the holder temperature for the runs used in this study, previous runs (under nominally the same conditions) using a thermocouple clamped onto the front surface of the holder indicated a temperature of 670 C. The LCMO target was radio frequency (rf) sputtered and the LSMO target was direct current (dc) sputtered in a sputter gas composed of 80% Ar and 20% O2 (as measured by flow meters) and at a total pressure of 13.3 Pa. These conditions gave deposition rates of 17-50 nm/hr, with film thicknesses being typically 100 nm. After deposition, the samples were cooled in 13.3 kPa of oxygen. We find that our system can produce films of LCMO and LSMO that have low resistivities and high peak temperatures without the use of an ex-situ anneal in oxygen.
The samples were characterized by standard and high resolution x-ray diffraction scans, atomic force microscopy, electrical resistivity measurements (using the van der Pauw method[8]) in an applied field perpendicular to the film plane, and magnetization measurements at low fields parallel to the film plane using a Quantum Design SQUID Magnetometer. All magnetization data had the large paramagnetism of the NdGaO3 substrates subtracted out.
III Structure, Transport and Magnetic Properties
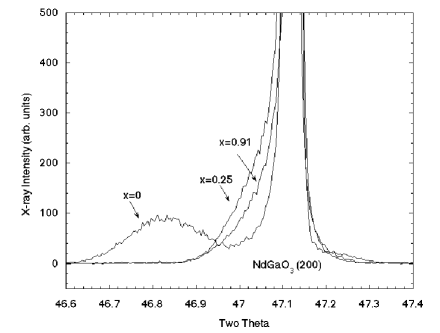
On (100) NdGaO3 we find surface roughness values of 1.5 nm for pure films of LSMO and LCMO, while for the mixtures the surface roughness increases to 2.8 nm, as measured by atomic force microscopy. The grain sizes for the pure LSMO and LCMO films is typically 100 nm, while for the mixtures it is reduced to 50 nm. High resolution X-ray diffraction along the growth direction shows only the presence of peaks from NdGaO3 for the LCMO samples. This would be expected, since the lattice match of pseudo-cubic (100) LCMO ( 0.387 nm) to pseudo-cubic (100) NdGaO3 ( 0.385 nm) should be excellent. From this we take the orientation of the LCSMO films to be (100). Films of LSMO on NdGaO3 however as shown in Fig. 1 do exhibit a peak corresponding to a pseudo-cubic length of 0.388 nm. The rocking curve width for this line is 337 arc-seconds, with an instrumental width of 12 arc-seconds, and phi scans show excellent in-plane registry of the film with the NdGaO3 substrate. From our work on LSMO and LCMO grown on both (100) and (110) MgO, we know that LSMO films typically grow with a slightly larger value of the pseudo-cubic cell length, , compared to LCMO. On (100) MgO, for example, we find that is 0.387 and 0.388 nm for LCMO and LSMO, respectively, while for (110) MgO we find 0.388 and 0.390 nm for the two materials. Obviously the lattice match is not as good for the case of LSMO, and this will introduce strain into the LSMO film. We also see from Fig. 1 that as the calcium fraction is increased, the well defined peak seen for the LSMO film moves to smaller d spacings, consistent with the trend towards LCMO, appearing as a shoulder on the low angle side of the NdGaO3 (200) peak. As the calcium fraction increases further, the shoulder diminishes, and for pure LCMO (not shown), it is indistinguishable from the substrate peak. From this we surmise that the films will be strained, with the strain decreasing as the calcium fraction increases.
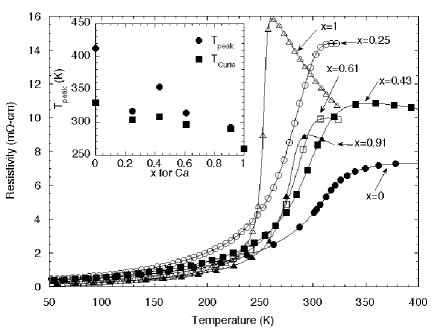
In Fig. 2 we present the resistivity data in zero applied magnetic field for the LCSMO films for the various Ca/Sr ratios, along with a plot of the peak temperatures (Tp) and Curie temperatures (TC) determined from magnetization data for the samples (taken at 400 Oe). For the case of pure LCMO, we see the usual (T) behavior, with a thermally activated resistivity (activation energy of 52 meV) and a peak temperature of 260 K, which is the same as the Curie temperature. For pure LSMO (x=0), we find that the resistivity has a peak temperature (410 K) much higher than the Curie temperature (330 K) This discrepancy between the peak and Curie temperatures is often seen for LSMO. The Curie temperature we see for our LSMO is lower than that seen in bulk LSMO with 1/3 doping,[9] which we feel is due to disorder in the sample. The difference in disorder or strain between the LSMO and LCMO samples was also seen in the measurements of the coercive field for the two samples. At 10 K, the coercive field for the LCMO film was 20 Oe, which is quite low. However for the LSMO film, the coercive field was 170 Oe. Now as the concentration of Ca is varied from either extreme, we see sudden changes in the sample properties. For the x=0.91 sample, we see a large decrease in the sample resistivity, with a concurrent rise in the Tp and TC. The increase in the Curie temperature is likely due to the change in the tolerance factor as the Ca atoms are replaced with Sr atoms. On the other end, at x=0.25, the increase in Ca fraction causes a large increase in the resistivity, along with a large drop in Tp and TC. The large increase in resistivity is likely the reason for the low value of TC observed. The values for Tp and TC are similar for the x=0.91 sample, but diverge for the samples with lower x. We see that as the Ca fraction decreases, Tp and TC tends to increase as one would expect for the change in tolerance factor being introduced. However, the variation we see in TC is not as gradual as was seen in either the previous bulk studies on divalent doping.[3, 7] In the work by Hwang et al. an apparent smooth variation in TC from 250 to 365 K is seen as the Ca/Sr ratio is varied. In the work by Guo et al. there was a jump in TC at a Ca fraction, x, of 0.45 when the system went from orthorhombic to rhombohedral. No such jump is seen in our data, but with the strong lattice match to the NdGaO3 substrate, we would not expect a structural change. We see instead that the value of TC changes very slowly as the value of x is changed, but with rather sudden changes near x=0 and x=1. We feel that part of the explanation for the non-monotonic behavior of TC, as well as Tp, is due to disorder in the samples, as we discuss below.
In previous studies of the low temperature (T 200 K) resistivity in the manganites, several different equations have been used to characterize the behavior. Schiffer et al.[10] used the equation for LCMO polycrystalline material and found good fits to the data. Similar results for LCMO films have also been seen.[11] Urashibara et al.[9] found for LSMO material a T2 dependence, which was interpreted as being due to electron-electron scattering. We found that we could also get reasonable fits using the approach in Schiffer et al. if we limited the data selection to T 150 K. However, if we look at the data for T 200 K, we find that we get better agreement if we use
| (1) |
as seen in Figure 3. A similar result was seen in well annealed LSMO and LCMO films by Snyder et al.,[12] but here they used a term instead of , in light of the prediction of spin-wave scattering by Kubo and Ohata.[14] However, from the work on Pb-doped LCMO single crystals,[15] the contribution from the term is expected to be much smaller ( 0.5 -cm at 100 K) than that seen in our results, which is 10 -cm. We also observe the reduction in the contribution of the term at low temperatures, which is interpreted by Jaime et al. as an indication that the term arises from single-magnon scattering, and not electron-electron scattering.
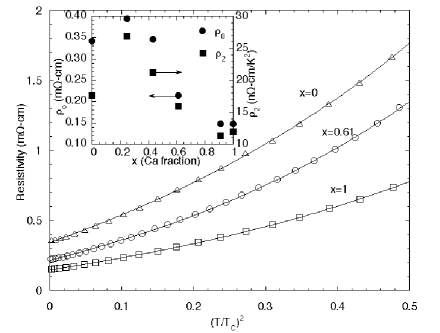
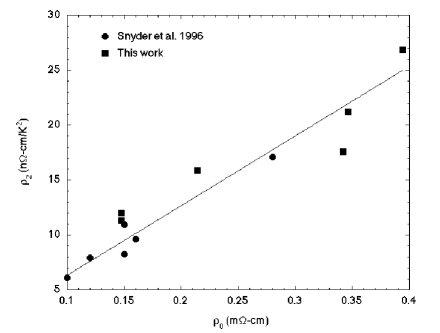
Our derived values for and determined from fitting Eq.1 are shown in the inset to Fig. 3. The values of are typically 1 f-cm . We see that the temperature independent term, is lowest for the pure LCMO films, with values similar to that seen in Snyder et al.[12] As the Ca fraction decreases, we see an increase in , which indicates an increase in the disorder in the films. This increase in disorder might be initially thought to be due to random location of Sr on Ca sites, but since the Ca sites are already located at random in LCMO, it is difficult to see how replacing Ca with Sr has increased the randomness in the system. The trend continues until pure LSMO is reached, when we see a drop in the static term. We notice however that the low temperature resistivity is higher for our pure LSMO films than for pure LCMO, which reflects the increased disorder for the LSMO film as seen in the coercive field measurements. A similar result was also seen in Ref.[12]. For the temperature dependent term, we see a similar non-monotonic trend, with a peak in the value of as the Ca fraction decreases, and a large drop when pure LSMO is reached. The values of that we observe for pure LSMO and LCMO are larger than that seen in Snyder et al.[12], however both our values and those for Snyder show a similar correlation, as seen in Fig. 4. Clearly there appears to be a connection between the values of and , with the ratio of the two being approximately 60-70 x 10-6 K-2. If the term is due to electron-electron scattering, it is very hard to see what correlation would exist between the static disorder in the sample and the terms in e-e scattering, such as the Fermi energy. The model of Jaime et al.[15] also would give no correlation between the two terms. If there was a coincidental correlation between the two terms, due say to changes in EF (which affects ) and changes in strain (which affects ) with x, we would not expect to see the same correlation for the films in the work by Snyder et al.[12] since the points with the lowest and highest values of are for pure LCMO films.
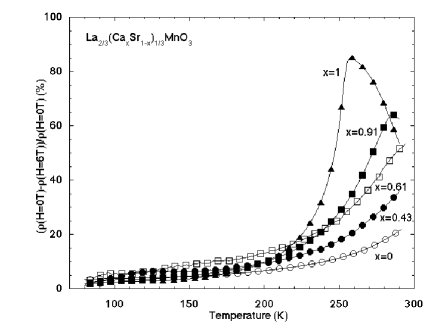
In Figure 5 we show the magnetoresistance at 6 Tesla applied field as a function of temperature for the films, defined as
| (2) |
For the range of temperatures studied, we see a maximum in the room temperature magnetoresistance for the x=0.91 sample, (since Tp is close to room temperature) however the largest magnetoresistance occurs for the pure LCMO sample. The magnetoresistance at 77 K for all the samples is linear in applied field, going from 0.5 % for the LCMO sample to 3 % for the LSMO sample at 6 Tesla of field. The field dependence of the magnetoresistance at room temperature for the samples undergoes a change as would be expected for Tp moving from above to below room temperature as seen in Fig. 6. Near zero field, the curves for the pure LCMO and the x=0.91 sample exhibit positive concavity, which is seen for samples with T , however for higher fields we see that the concavity for the x=0.91 sample switches to negative which is that seen for the other samples. As seen in Ref.[13], we can fit the change in resistance for the case of T TC to the equation
| (3) |
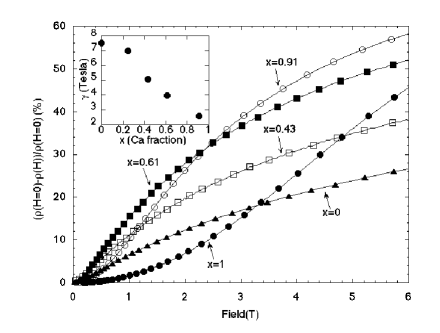
The values of for samples with x1 at room temperature are shown in the inset in Fig. 6. We see that the values of decrease as the Ca fraction increases. In Ref.[13] for pure LCMO a value of = 2.7 Tesla was found at 0.9 , which would fit in reasonably into our values, assuming of course that is not strongly temperature dependent. If is dependent on the relative difference between T and TC or Tp, we would not get the smooth variation seen in the inset of Figure 6, since TC and Tp are not a monotonic function of x, as seen in Figure 2.
For the pure LCMO sample, we could fit the data equally well to the equation proposed in Ref.[13] , or the form . However the use of the first equation resulted in values of , which is unphysical. The value of is 8.5 T, which is larger than that seen in Ref.[13], 5.7 T. The data for the x=0.91 cannot be fit over the entire range with any of the formulations, since it exhibits a concavity change with field. However, for high fields (above 2 Tesla), it can be fit by Eq. 3, giving a value of as seen in Fig. 6.
IV Conclusions
We have observed that LCSMO films grow with (100) pseudo-cubic orientation on NdGaO3 substrates with somewhat rougher surfaces and smaller grain size than either pure LCMO or LSMO films. As the Ca fraction decreases, the lattice constant for LCSMO increases towards the value for LSMO, resulting in an increase in strain in the system. This strain is manifested by a reduction in the Curie temperature, and increases in the coercive fields and low temperature resistivity. We have also observed the T2 dependence to the resistivity, and have observed a correlation between this term and the static term. The field dependence to the magnetoresistance for LCSMO films is predicted well by the equations in Ref. [13], with the value of increasing as the Ca fraction is reduced.
V Acknowledgments
We would like to gratefully acknowledge the assistance of Michael Miller for the AFM measurements and Andrew Patton in the production of the films.
REFERENCES
- [1] J.R. Sun, G.H. Rao and J.K. Liang, Appl. Phys. Lett. 70, 1900 (1997)
- [2] J. Fontcurberta, B. Martinez, A. Seffar, S. Pinol, J.L. Garcia-Munoz, and X. Obradors, Phys. Rev. Lett. 76, 1122 (1996).
- [3] H.Y. Hwang, S-W. Cheong, P.G. Radaelli, M. Marezio, and B. Batlogg, Phys. Rev. Lett. 75, 914 (1995).
- [4] J. Blasco, J. Garcia, J.M. de Teresa, M.R. Ibarra, J. Perez, P.A. Algarabel, C. Marquina and C. Ritter, Phys. Rev. B 55, 8905 (1997).
- [5] N. Gayathri, A.K. Raychaudhuri, S.K. Tiwary, R. Gundarkaram, A. Arulraj, and C.N.R. Rao, Phys. Rev. B 56, 1345 (1997).
- [6] A. Anane, C. Dupas, K. Le Dang, J.-P. Renard, P. Veillet, A.M. De Leon Guevara, F. Millot, L. Pinsard, A. Revcolevschi, and A.G.M. Jansen, J. Magn. Mag. Mat. 165, 377 (1997).
- [7] Z.B. Guo, W. Yang, Y.T. Shen and Y.W. Du, Sol. St. Comm. 105, 89 (1998).
- [8] L. J. van der Pauw, Phillips Res. Rep. 13, 1 (1958).
- [9] A. Urashibara, Y. Moritomo, T. Arima, A. Asamitsu, G. Kido, and Y. Tokura, Phys. Rev. B 51 14103 (1995).
- [10] P. Schiffer, A.P. Ramirez, W. Bao, and S.-W. Cheong, Phys. Rev. Lett. 75, 3336 (1995).
- [11] E.S. Vlakhov, R.A. Chakalov, R.I. Chakalova, K.A. Nenkov, K. Dörr, A. Handstein, and K.-H. Müller, J. Appl. Phys. 83, 2152 (1998).
- [12] G.J. Snyder, R. Hiskes, S. DiCarolis, M.R. Beasley, and T.H. Geballe, Phys. Rev. B. 53, 14434 (1996).
- [13] G.J. Snyder, M.R. Beasley, T.H. Geballe, R. Hiskes, and S. DiCarolis, Appl. Phys. Lett. 69, 4254 (1996).
- [14] K. Kubo and N. Ohata, J. Phys. Soc. Jpn. 33, 21 (1972).
- [15] M. Jaime, P. Lin, M.B. Salamon, and P.D. Han, Phys. Rev. B 58, R5901 (1998).