Laser induced freezing of charge stabilized colloidal system
Abstract
We present results from an extensive simulational study of the modulated liquid crystal transition in a 2-d charge-stabilized colloid subject to a 1-d laser field modulation commensurate with the crystalline phase. Contrary to some earlier simulational and experimental findings we do not find any reentrant liquid phase in our simulation. Furthermore the transition remains first-order (albeit weak, with a fairly large correlation length) even in the limit of infinite field, contrary to mean-field predictions. In the modulated liquid phase, while the translational order decays exponentially, the bond orientational order is actually long ranged.
pacs:
PACS numbers : 64.70.Dv, 82.70.Dd, 05.70.FhThe freezing of charge-stabilized colloidal particles in the presence of a stationary modulation (laser) field has been of considerable research interest in recent years. Using light scattering techniques Chowdhury, Ackerson and Clark [2] showed that a charge stabilized colloidal liquid system, confined between two glass plates to form a single layer, when subjected to a commensurate stationary laser modulation (i.e. with the wavevector of the modulating laser field tuned to be half the wavevector at which the direct correlation function of the liquid develops its first peak in the absence of an external potential), freezes to form a triangular lattice with full two dimensional symmetry. They [2] also analyzed the phenomenon in terms of a simple Landau - Alexander - McTague (LAM) [3] theory and concluded that the transition from the modulated liquid to the crystal becomes continuous (second-order) when the field strength is large. The continuous growth of intensities produced by all the density modes with increasing external field intensity was taken by Ackerson and Chowdhury [4] as an indication in favor of a second-order transition scenario. Later experimental studies involving direct microscopic observations [5] and simulational studies using Monte-Carlo (MC) technique [6] confirmed this phenomenon of laser induced freezing (LIF).
Several authors [7], [8], [9] have studied this problem using density functional theory [10]. The authors of [9] have shown from general symmetry grounds that for a suitably chosen modulation potential the free energy expansion for the crystalline phase about the modulated liquid contains the relevant order parameters only in even powers. Hence there arises a possibility of change over of the first-order freezing transition at low external field strengths to a continuous transition for large enough external field via a tricritical point. Their DFT results were in accordance with these symmetry arguments.
In a later work Chakrabarti et al. [11] studied a two dimensional colloidal system using MC simulation. The use of a standard procedure of looking at finite-size behavior of the fourth cumulant of the energy [12] seemed to confirm the existence of the tricritical point. Their study also found an intriguing reentrant modulated liquid phase - where increasing the external field strength actually melted the system instead of taking it towards the crystalline phase. Another unusual feature found in their simulation was that the order parameter jumped to zero at a lower value of the screening length compared to where the specific heat peak was seen.
Very recently Wei et al. [13] reported an experimental study of LIF and from the decay of pair correlation and the real space density plots concluded that their results were in accordance with the results of reference [11], showing a reentrant liquid phase.
In this letter we report the main results obtained from a vastly more extensive Monte-Carlo simulation than that in ref. [11] of charge stabilized colloidal particles (with diameter ). They are assumed to be confined in a 2-d cell of size with periodic boundary conditions and subjected to an external potential of the form , with , where is the mean inter-particle separation. The inter-particle interaction is modeled by the DLVO potential:
| (1) |
Here () is the effective surface charge, (=78) is the dielectric constant of the solvent and is the inverse of the Debye screening length due to the counterions in the solvent. Details of the simulation will be published elsewhere [14].
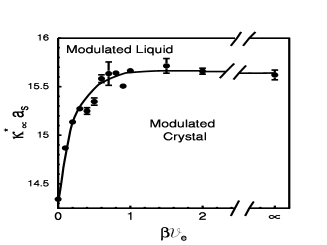
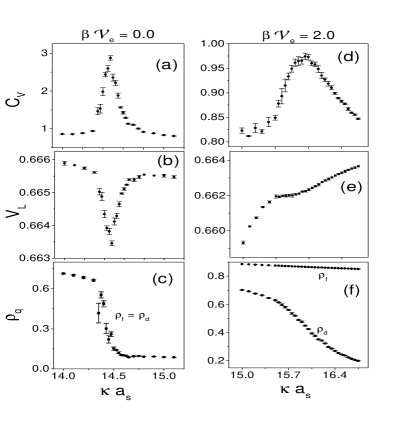
The phase diagram obtained by extrapolating the simulation results to infinite system size as detailed below is shown in figure 1. It does not have the reentrance reported in [11]. The transition is “strongly first-order” at zero field, signaled by a strong peak in the specific heat [figure 2(a)] and sharp rise of the order parameters [9] ,[11] [figure 2(c)], at . At larger field strengths, the peak in becomes less prominent [figure 2(d)] and the order parameter characterizing the modulated liquid crystal transition [9], [11] seems to go to zero continuously [figure 2(f)], in apparent accordance with the mean field theory predictions [2] , [9]. However, as we show below, in actuality the transition seems to remain first-order (albeit weak, with a fairly large correlation length) even in the limit of infinite field, contrary to the mean-field predictions.
For a finite system, one expects that the transition will actually be rounded always. Hence one must look at the scaling of various quantities with large system size to ascertain the order of the transition. In particular the limiting value of the fourth cumulant of energy and its scaling behavior have been widely used to judge the order of the transition [12], [11]. In case of a first-order transition, , the peak in should diverge as , while and should scale as . For small system sizes, there are corrections to this scaling behavior and we show below that at large field strengths these corrections become even more important.
For a first-order transition scenario, assuming that the probability distribution for energy (per particle) is the sum of two Gaussian distributions centered around and corresponding to the disordered (modulated liquid) and the ordered (crystalline) phases, one can derive the following results, [12], [14]:
| (2) | |||
| (3) |
where refers to the height of the specific heat peak for a system of linear size and . To leading order, the constants and are proportional to the inverse of , being the free energy difference between the liquid and the crystalline phases.
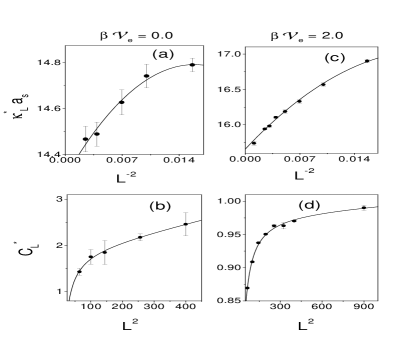
Figures 3(a) and (c) show the scaling behavior of (from the specific heat peak) for and respectively. By fitting equation 3 (the solid line), we get for . is plotted as function of in figure 3(b) and (d). By fitting equation 2 we find for .
While the above analysis indicates that a first-order scenario is a likely possibility even at large , the scaling analysis is done for results which span less than a decade in ( to ). Because the peak in is rather broad and small in height, one needs to average over several million MC steps to determine the peak position and peak height within acceptable errorbars. This limits the largest system we are able to simulate to .
One can further argue that even though the transition remains first order and does not show any reentrant melting till , there is always a possibility that the transition does become continuous at a larger field strength. To settle this we have carried out an even more extensive simulation at , so that the particles are confined to parallel lines. The resulting simplifications allow us to write a more efficient MC code, making simulations upto doable within our computing resources.

The plot of as a function of for , shown in Figure 4(a), has a maximum around . This non-monotonic behavior seem to suggest a large but finite length scale in the system. The existence of such a length scale is difficult to understand in the frame work of a second-order transition scenario, where, asymptotically close to the phase transition, one should have just two length scales, the system size (to which the “diverging” correlation length saturates) and the interaction scale (which is not much larger than for the present case). But if the transition is weakly first-order with a large but finite , one expects the finite-size scaling behavior of the first-order transition discussed above to be valid only for . Figures 4(b) and 4(c) show that and for large do follow a first-order like scaling [cf., eq.s (2) and (3)], with and ; so does which scales as as shown in figure 4(d).
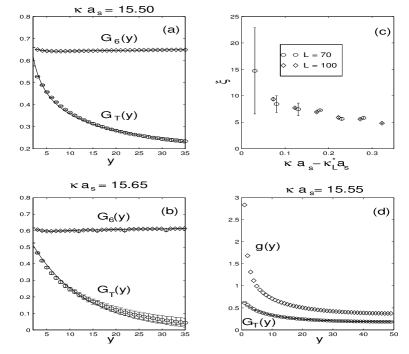
For we have computed the correlation functions for the coarse grained translational and bond-orientational order parameters, to be denoted by and respectively, for and . In the modulated liquid phase we obtain by fitting to a decaying exponential. Figure 5(c) shows that actually becomes large even in the liquid phase as one goes towards . But it saturates at around , indicating that the transition really is a weakly first-order transition.
Figures 5(a) and (b) show for the liquid and the solid phase near . As can be seen from the figures, remains long ranged even in the liquid phase. A 2-d liquid has a local hexagonal order. When one applies a commensurate field, a unique direction (modulo ) is picked up every where in the system. Thus the 1-d modulation potential induces not only translational ordering, but also a long-range orientational order even in the modulated liquid phase. This is also understandable from the general phenomenological mean-field free energy given in [15], where a term linear in the bond-orientational order parameter arises as soon the translational order parameter conjugate to is turned on in the modulated liquid phase. Thus in the modulated liquid, goes to a constant value at large distances. What distinguishes the modulated liquid from the crystalline phase is , which decays exponentially in the modulated liquid phase but as a power law in the 2-d crystalline phase. The energy difference between the two phases becomes smaller as is increased (though it never becomes strictly zero) and is responsible for the broad specific heat peak and the broad region over which the order parameter goes to zero. We believe that this probably led to the results reported in [11], where the true transition was missed, and a statistical fluctuation was mistakenly taken to be the peak and hence the signature of a transition. Since different moments of energy are not independent, a chance increase of will be associated with a dip of . Such artifacts arising from insufficient averaging are presumably absent in the present simulation due to the extensive averaging that has been carried out. This also explains why the earlier simulation [11] failed to see the order parameter fall to zero until much higher values of .
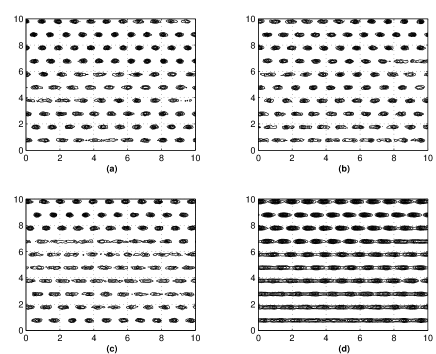
For moderate external fields, substantial diffusion precedes the actual transition. While maintaining the translational order over the full system, locally the system accommodates defects. In Figure 6 we show contour plots for the time averaged density as computed over different time spans from a Brownian dynamics simulation of 400 particles for . The short-time averaged density plots show near perfect crystalline order, with small regions where the particles have moved considerably from the lattice positions. If one averages for a long time ( minutes of real time), the average density shows that the chance of finding a particle is nonzero everywhere along the lines. But we still find that the peaks of the average density maintain the crystalline order. Scattering experiments, which measure the structure at short time scales compared to the diffusion time, can differentiate this from the liquid phase via the existence of Bragg peaks. And in our simulation we can directly compute the order parameter, which, for the above parameter values, is as large as !
The claim in [13] of the observation of reentrant melting into the modulated liquid phase at high was based on the observed stronger decay of the envelope of than that theoretically predicted for the crystalline state [15]. The problem with this analysis is that the correct power-law decay in the envelope of sets in at much larger distances than for the order parameter correlation (which unfortunately is difficult to measure from experiments). In fig. 5(d) we plot the envelope of and for , and , i.e., in the crystalline phase but close to the transition . The envelope of falls much more rapidly than even upto , and would yield a large exponent if fitted to a power law, in contrast to which quickly attains a power law decay with exponent . We expect that for the same parameter values where [13] suggested a modulated liquid phase, light scattering experiments or order parameters calculated from Fourier transforming individual configurations prior to averaging will reveal the existence of a crystalline order.
In conclusion we have presented new simulational evidence that the laser induced freezing in charge stabilized colloids remains first-order for an arbitrarily large laser field, in contrast to all theoretical predictions hitherto . The reentrant liquid phase suggested in [11] and [13] is absent in the resulting phase diagram. Also we have shown that the modulated liquid phase has long range bond orientational order. The difference in the nature of transition between that predicted by the DFT and that found in our simulation is likely to be due to fluctuations, which are neglected in the DFT calculations in [6-8]; the inclusion of such fluctuations is known to turn some transitions first-order, eventhough they are predicted to be continuous by mean-field theory [16] [17].
Acknowledgments
The authors thank T.V. Ramakrishnan, S. Sengupta, S.S. Ghosh, J. Chakrabarti, R. Pandit, C. DasGupta and S. Ramaswamy for many useful discussions. We thank SERC, IISc for computing resources. CD thanks CSIR, India for financial support.
REFERENCES
- [1] Also at Jawaharlal Nehru Centre for Advanced Scientific Research, Bangalore, India.
- [2] A. Chowdhury, B. Ackerson and N. A. Clark, Phys. Rev. Lett. 55,833,(1985).
- [3] S. Alexander and J. McTague, Phys. Rev. Lett. 41, 702, (1984).
- [4] B. J. Ackerson and A. Chowdhury, Faraday Discuss. Chem. Soc. 83,309, (1987).
- [5] K. Loudiyi and B. J. Ackerson, Physica A 184, 1, (1992).
- [6] K. Loudiyi and B. J. Ackerson, Physica A 184, 26, (1992).
- [7] H. Xu and M. Baus, Phys. Lett. A 117, 127, (1986).
- [8] J. L. Barrat and H. Xu, J. Phys. : Cond. Matt. 2, 9445, (1990).
- [9] J. Chakrabarti, H.R. Krishnamurthy and A.K. Sood, Phys. Rev. Lett., 73, 2923, (1994).
- [10] T. V. Ramakrishnan and M. Yussouf, Phys. Rev. B 19, 2775, (1979) ; A. D. J. Haymet and D. J. Oxtoby, J. Chem. Phys., 74, 2559, (1981).
- [11] J. Chakrabarti, H.R. Krishnamurthy, S. Sengupta, and A. K. Sood, Phys. Rev. Lett., 75, 2232, (1995).
- [12] Murthy S. S. Challa, D. P. Landau and K. Binder, Phys. Rev. B, 34, 1841, (1986).
- [13] Wei Q. H., Bechinger C., Rudhardt D. and Leiderer P., Phys. Rev. Lett., 81, 2606, 1998.
- [14] Chinmay Das, H. R. Krishnamurthy and A. K. Sood [in preparation].
- [15] D. R. Nelson in ”Phase Transitions and Critical Phenomena”, Vol 7 (C. Domb and M. S. Green, eds), Academic Press, London.
- [16] S. A. Brazovski, Sov. Phys, JETP 41, 85, (1975).
- [17] It is interesting to note that herringbone transition of physio-adsorbed nitrogen on graphite also was predicted to be second order from DFT and simple fluctuation calculations did not improve on the results. However, from simulation a weak first-order transition with very large correlation length was inferred. D. Marx, S. Sengupta, O. Opitz, P. Nielaba and K. Binder, Mol. Phys, 83, 31, (1994).