Microwave transport approach to the coherence of interchain hopping in (TMTSF)2PF6
Abstract
We report a microwave study of the longitudinal and transverse transport properties of the quasi-one-dimensional organic conductor (TMTSF)2PF6 in its normal phase. The contactless technique have provided a direct measurement of the temperature profile of the resistivity along the b’ direction and in magnetic fields up to 14 T. A characteristic energy scale () has been observed which delimits a transient regime from an insulating to a metallic behavior. This anomalous profile is discussed in terms of the onset of coherent transport properties along the b’ direction below 40 K. This is also supported by the observation of a finite longitudinal and transverse magnetoresitances only below 40 K, indicative of a two-dimensional regime. Below , however, strong deviations with respect to a Fermi liquid behavior are evidenced.
pacs:
67.55.HcTransport properties and 71.27-aStrongly correlated electron systems, heavy fermions and 71.10.PmFermions in reduced dimensions (anyons, composite fermions, Luttinger liquid, etc. and 74.70.KnOrganic superconductors.1 Introduction
Due to a
pronounced chain structure, the (TMTSF)2X, [X = PF6, AsF6, ClO4…] Bechgaard salts
have become the prototypical
examples of
quasi-one-dimensional (Q1D) conductors with the highest conductivity
direction parallel to the stacking axis (a) of the TMTSF
molecules. Their low temperature properties have attracted much attention
since various transitions such as incommensurate
spin-density-wave (SDW),
superconductivity, field-induced SDW, quantum Hall effect etc., have been
observed Ishiguro90 . Recently, the normal phase (i.e. above the
transition temperature
of the broken symmetry ground states) has attracted much interest. Since the tunneling integral along
the chain direction () is at least one order of
magnitude larger than the transfer integrals
and in the transverse directions (K and K), the organic metallic chains are usually
considered as weakly coupled. Although the coupling along c is likely irrelevant over a large temperature domain, the effective value
of has to be considered to precise the dimensionality of the electron gas in
the normal phase. At sufficiently high temperatures however, the physical properties
are expected to be essentially governed by 1D phenomena.
It is well known that, in a strictly 1D interacting electron gas, the Fermi liquid (FL)
picture breaks down and must be replaced by the so-called Luttinger liquid
(LL) description Schulz91 . Since non-negligible interchain
coupling along the b’ direction exist in the Bechgaard’s salts,
departure from the LL model Boies95 migth be induced. Indeed, when
the temperature is progressively lowered, transverse b’ interactions are expected
to become more effective so that a crossover from a Q1D to a two-
dimensional (2D) electron gas picture should occur: the FL behavior
might be recovered provided that the Coulomb
interactions are not too strong. However, the actual value of the crossover
temperature is highly debated. According to simple
band calculations, the dimensional crossover for the single
particle motion is then expected to occur at .This is
in agreement with the temperature dependence of the longitudinal DC
resistivity which is showing a transition regime from a roughly linear behavior
to a profile (indicative of a FL behavior dominated by
electron-electron scattering effects) over that temperature
range Jerome94 . However, photoemission spectra
Dardel93 ; Zwick97 are incompatible with a FL picture over that
temperature range and early optical experiments with the
light polarized along the transverse b’ direction
failed to evidence a coherent plasma edge above 50K Jacobsen83 .
Moreover, deviations from the FL picture have also been observed down to
50 K in NMR experiments, suggesting then an upper bound
value for the crossover temperature Bourbonnais93 ; Wzietek93 .
Furthermore, the frequency dependence of the conductivity is well known to
display unusual features Schwartz98 ; Vescoli98 : for frequencies above
the effective interchain transfer integral, the electrodynamics is consistent with the
prediction of the LL picture, while at low frequencies, pronounced deviations
with respect to the Drude picture are present Timusk96 .
Among all the experimental approachs used to study the
dimensionality of the electron gas, transverse transport measurements
are particularly relevent to directly probe the interchain
couplings. It was further realized that since the transverse transfer integrals
are small, an electric field applied along the b’ or c*
directions could also act as a probe of the physical properties in the
plane perpendicular to that direction. Early resistivity measurements
Jacobsen81b along the hard axis (c*) have shown a non
monotonic behavior of the temperature profile: a maximum of was
observed near 80 K. More recently, a strong pressure dependence of this unusual feature was
evidenced Moser98 and a typical 1D power law profile was found above the
characteristic maximum. This maximum was then
ascribed to a broad crossover regime indicative of a deconfinement of
the carriers from the chain axis; this results in a gradual onset of
coherent transport along b’ below 80 K, suggesting then a FL
behavior in the a-b’ plane. However, the anisotropy ratio was not found temperature independent as expected from FL
arguments and an incipient Fermi liquid was therefore invoked. These
observations contrast with the work of Gor’kov et
al. Gorkov98 ; Gorkov96 ; Gorkov95 who recently argued that the
longitudinal transport properties, below 60 K
and down to the SDW transition temperature, can be well accounted for in
terms of a weakly interacting Fermi liquid. However, such a
quasi-particle like signature (if ever) should also be detected in the
b’ transverse direction.
Reliable measurements of the transverse transport properties along
b’ are highly needed to clarify the present controversy.
Unfortunately, since the Bechgaard salts have a pronounced
needle shape whose axis is parallel to the chains, transverse transport
along b’ is particularly difficult to perform with usual DC
methods. Owing to non-uniform current distributions
between contacts, parasitic contributions from other directions are
likely introduced. These problems can be avoided by using a contactless microwave
technique which allows a better control on the orientation of the
current lines in these organic needles. In this paper, we report
microwave resistivity data obtained along the transverse directions in
(TMTSF)2PF6 crystals. These data clearly indicates the
temperature range over which the coherence of interchain hopping sets
in and they confirm strong deviations from a Fermi liquid description.
2 Experiment
High quality single crystals of (TMTSF)2PF6 have been synthesized by the standard electrochemical method with typical dimensions ( mm3) along the a, b’ and c* axes respectively. Such a needle geometry is not suitable for precise measurement of the transverse transport properties; this is particularly true for our microwave technique which yields very accurate data only when the electric field is oriented along the needle’s axis. Each needle was therefore cut into three pieces in order to perform the measurements along the a, b’ and c* axes (natural faces of the single crystals) on the same single crystal. Each piece was then cut in small blocks so that it could be reconstructed with the shape of a needle having one of the crystal directions as its axis. We used a conventional cavity perturbation technique at 16.5 GHz Fertey97 to obtain the electrical resistivity along each crystal axes as a function of the temperature (2-300 K) and a magnetic field (0-14 Tesla) applied along the c* direction. Unfortunately, due to the microwave resonator design, no data could be collected with both the magnetic field and the electric field along the c* axis. To prevent microcraks the samples were slowly cooled to the lowest temperature at 0.6K/min. The temperature was monitored either with a Si diode (zero field) or a capacitor sensor (field up to 14T).
3 Results and discussion
Along the high conductivity axis, the microwave resistivity has been determined by using the Hagen-Rubens limit (skin depth regime). Since the conductivity is much lower along the b’ and c* axes, the microwave data were rather analyzed in the framework of the metallic limit of the quasistatic approximation Musfeldt95 . We report in Figure 1, the temperature profile of the resistivity along the (a), (b’) and (c*) axes of (TMTSF)2PF6 in the normal phase for zero magnetic field value. The orders of magnitude are in good agreement with published DC results Jacobsen81b ; Moser98 and the SDW phase is evidenced for each crystal direction by an abrupt resistivity increase below 12 K.
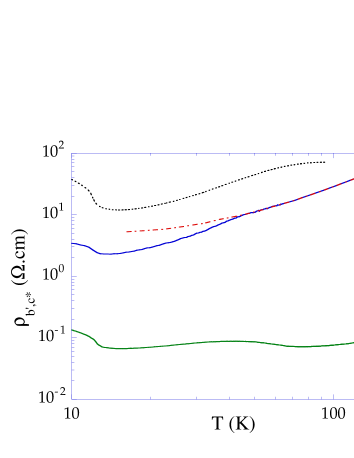
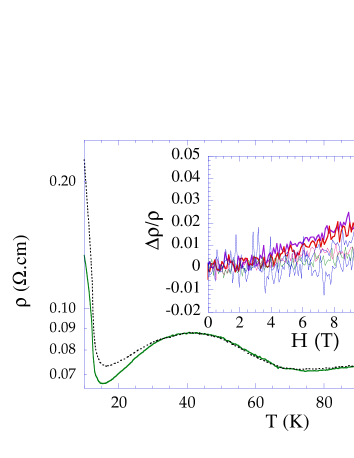
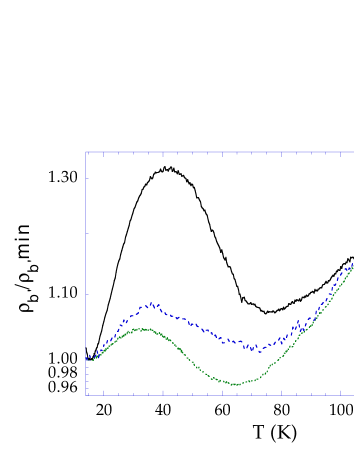
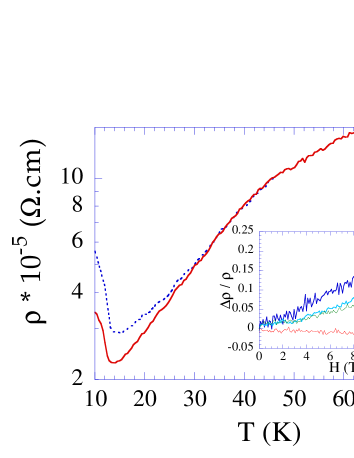
Along the chain axis (a), the usual metallic behavior is observed down to 13.6 K, where the resistivity reaches a minimum. Interestingly, the microwave resistivity profile displays clearly, near 45 K, a change of slope, when the DC one usually shows a single quadratic behavior below 100 K (dashed-dotted line in Figure 1). Along the least conducting direction (c*), the microwave resistivity profile is consistent with the DC curve Moser98 : it increases first when the temperature is decreased from 300 K (not shown on the figure), reaches a maximum near 90 K and recovers a metallic behavior on further cooling. The minimum value is obtained near 15.3 K. The b’ resistivity presents definitely a different profile, being almost flat (below 120 K) on the logarithmic scale compared to the other crystal directions. This profile is shown in more details in Figure 2. On lowering the temperature, the resistivity first decreases monotonically down to a local minimum around 75 K, increases slightly to reach a local maximum near 40 K and decreases again down to 15 K before entering the SDW phase below 12 K. This peculiar profile observed between 12 and 80 K is weakly sample dependent: this is illustrated in Figure 3 where we compare the normalized resistivity (relative to the value just above the SDW transition) obtained on three different samples (different batches). Such a dependency can be explained by two factors: i) a sligth misalignment relative to one another of the small crystals used in the needle’s construction; ii) a different impurity content in crystals of different batches. A correlation with the latter factor is difficult to evaluate for the moment. However, it seems clear from Figure 3 that the local maximum of around 40 K is intrincic to this crystal direction. Its absence on the DC resistivity profile Jacobsen81b could signify that the latter is significantly polluted by different components of the resistivity tensor as previously mentioned.
The emergence of an insulating behavior below 70 K ( in Figure 2) refutes the possible existence of quasi-particle states down to 40 K. A Fermi liquid description of interacting electrons above 40 K would, indeed, have required a quadratic temperature profile of both the and components. Between 50 K and 70 K, is better understood by assuming a Luttinger liquid behavior along the stacks: this yields a power-law increase , where is the exponent of the single-particle density of states of the LL Moser98 . However, due to the reduced temperature domain used to fit the power law and the slight sample dependency of in this temperature range, the exponent might be only approximative () and prevent in turn reliable determination value of the exponent characterizing the charge degrees of freedom of a LL.
The resistivity maximum observed around 40 K mimics the temperature profile of which also displays a resistivity maximum at higher temperature, near 80 K Jacobsen81b ; Moser98 . Therefore, it could be attributed to the onset of a deconfinement of the carriers and the restauration of a 2D conductivity regime in the a-b plane below 40 K. This is supported by the observation of an important increase of the resistivity when a magnetic field is applied perpendicularly to the 2D plane of motion (Figure 2), only for temperatures below 40 K. This is exemplified in the inset of Figure 2 which displays the variation of the resistivity relatively to its zero field value as a function of the magnetic field for temperatures between 16 and 80 K. It is well known that in the Bechgaard salts, a magnetic field applied along the hard axis c* confines the motion of the carriers to the chain axis. Therefore, a reduction of the metallic behavior parallel to b’ is expected if there is some coherent motion along that direction. Below 40 K, the progressively increasing magnetoresistivity can then be interpreted as the signature of the 2D motion. On the contrary, since no magnetoresistivity is observed above 40 K, transverse coherent hopping is apparently absent and coherent motion is confined to the organic stacks. This observation of a dimensional crossover around 40 K supports the predictions of the renormalization group theory: a Luttinger liquid picture may persist down to the low temperature region when many-body effects on interchain hopping are considered Bourbonnais85 . Indeed, one-dimensional many-body effects are expected to lower the efficiency of interchain tunneling, thereby decreasing its amplitude. However, transients effects are likely associated to such a crossover since the deconfinement region is not sharply defined but spreaded out in temperature: in the coherent regime (16-30 K), does not show a quadratic temperature profile (the power law exponent ranges from 0.37 to 0.075 for the three samples studied). This signifies that important deviations from a FL quasi-particle transport exist along the b’ axis, as exemplified by the temperature profile of the microwave resisitivity anisotropy ratio and presented in Figure 4.
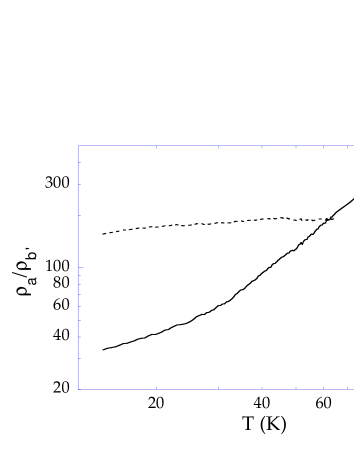
Below 70 K, is practically constant: it can be reasonably fitted by a law in clear contrast with the results of Moser et al. Moser98 , () over the same temperature range. On the contrary, continuously decreases from 300 K down to the SDW transition temperature. Only a change of curvature is observed around the dimensional crossover temperature near 40 K, seemingly in contradiction with a constant ratio expected for a true FL behavior.
The onset of coherence transport along the transverse direction is also supported by some features observed on the microwave resistivity along the chain axis. We show, in Figure 5, a significant increase of the resisticivty for a magnetic field of 14 Tesla applied along c*. As seen in the inset, a significant magnetoresistance is again observed only for temperatures below 40 K, consistently with a dimensional crossover over that range. The change of slope precedingly identified on around 45 K in zero field thus signals the onset of transverse coherent transport.
4 Conclusion
The microwave resistivity data reported in this paper for (TMTSF)2PF6 crystals clearly show the onset of coherent transport properties along the intermediate conductivity direction b’. This temperature scale is evidenced by a resistivity maximum around 40 K along the b’ axis and supported by a progressively increasing magnetoresistance below 40 K, when a magnetic field is applied along c*. Similar effects observed on the temperature profile of the longitudinal resistivity confirm the dimensional crossover. Furthermore, a temperature profile analysis of has failed to detect any clear-cut Fermi liquid component in the whole normal phase domain. Our results seems to be in good agreement with previous results such as NMR Bourbonnais93 ; Wzietek93 , photoemission Dardel93 or optical data Timusk96 , which claim the abscence of any quasi-particle features. These results, however, contrast with reflectance Schwartz98 ; Vescoli98 or very low temperature magnetotransport Danner94 data, which seem to be well described by bare band parameters. A detailed theoretical framework that would clarify why some experimental probes are apparently strongly sensisitve to many-body effect while others do not, is missing so far.
Acknowledgements.
The authors are grateful to J. Beerens for giving access to his 14 Tesla experimental set-up, to C. Bourbonnais for critical reading of the manuscript and useful suggestions during the course of this work, M. Castonguay and J. Corbin for technical assistance. This work was supported by grants from the Fonds pour la Formation de Chercheurs et l’Aide à la Recherche of the Government of Québec (FCAR) and from the Natural Science and Engineering Research Council of Canada (NSERC).References
- (1) T. Ishiguro, K. Yamaji, in Organic Superconductors, edited by P. Fulde (Springer-Verlag, Berlin, 1990).
- (2) H.J. Schulz, Int. Journ. Mod. Phys. B 5, 57 (1991).
- (3) see e.g. D. Boies, C. Bourbonnais, A.-M.S. tremblay, Phys. Rev. Lett. 74, 968 (1995) and references therein.
- (4) D. Jerome, in Organic Superconductors, edited by J.P. Farges (Marcel Dekker, New York, 1994), p 405.
- (5) B. Dardel, D. Malterre, M. Grioni, P. Weibel, Y. Baer, J. Voit, D. Jerome, Europhys. Lett. 24, 687 (1993).
- (6) F. Zwick, S. Brown, G. Margaritondo, C. Merlic, M. Onellion, J. Voit, M. Grioni, Phys. Rev. Lett. 79, 3982 (1997).
- (7) C.S. Jacobsen, D.B. Tanner, K. Bechgaard, Phys. Rev. B 28, 7019 (1983).
- (8) C. Bourbonnais, J. Phys. I (France) 3, 143 (1993).
- (9) P. Wzietek, F. Creuzet, C. Bourbonnais, D. Jerome, K. Bechgaard, P. Batail, J. Phys. I (France) 3, 171 (1993).
- (10) A. Schwartz, M. Dressel, G. Grüner, V. Vescoli, L. Degiorgi, T. Giamarchi, Phys. Rev. B 58, 1261 (1998)..
- (11) V. Vescoli, L. Degiorgi, W. Henderson, G. Grüner, K.P. Sarkey, L.K. Montgomery, Science 281, 1181 (1998).
- (12) N. Cao, T. Timusk, K. Bechgaard, J. Phys. I France 6, 1719 (1996).
- (13) C.S. Jacobsen, K. Mortensen, M. Weger, K. Bechgaard, Sol. State Comm. 38, 423 (1981).
- (14) J. Moser, M. Gabay, P. Auban-Senzier, D. Jerome, K. Bechgaard, J.M. Fabre, Euro. Phys. J. B 1, 39 (1998).
- (15) L.P. Gor’kov, M. Mochena, Phys. Rev. B 57, 6204 (1998).
- (16) L.P. Gor’kov, J. Phys. I France 6, 1697 (1996).
- (17) L.P. Gor’kov, Europhys. Lett. 31, 49 (1995).
- (18) P. Fertey, M. Poirier, H. Muller, Phys. Rev. B 57, 14357 (1998).
- (19) J.L. Musfeldt, M. Poirier, P. Batail, C. Lenoir, Phys. rev. B 51, 8347 (1995) and references therein.
- (20) C. Bourbonnais Mol. Cryst. Liq. Cryst. 119, 11 (1985).
- (21) G.M. Danner, W. Kang, P.M. Chaikin, Phys. Rev. Lett. 72, 3714 (1994).