Vortex motion in superconducting YBa2Cu3O7-δ inferred from the damping of the oscillations of a levitating magnetic microsphere.
Abstract
The damping of the oscillations of a small permanent magnet (spherical shape, radius 0.1 mm) levitating between two parallel YBCO surfaces is measured as a function of oscillation amplitude and temperature. The losses in the samples (epitaxial thin films, bulk granular and bulk melt-textured) are analyzed in terms of oscillating shielding currents flowing through trapped flux lines whose motion gives rise to electric fields. We find dissipation to originate from different mechanisms of flux dynamics. At small amplitudes there is a linear regime described by a surface resistance varying from for the bulk samples down to for the thin films at low temperatures. With increasing amplitude various nonlinear regimes are observed, firstly collective pinning with diverging energy barriers, secondly in bulk samples above 85 K hysteretic damping, and finally in thin films exponentially large losses which can be described by pinning energies vanishing linearly at large currents.
pacs:
PACS numbers: 74.60.Ge;74.76.Bz;74.80.Bj.I Introduction
A permanent magnet levitating above, or suspending below, a superconducting surface has an equilibrium position which is determined by magnetic forces due to screening currents and trapped flux.[1] Except for a small logarithmic long-term relaxation of the magnetization of the superconductor this position is stable. The system is in a metastable state with stationary flux lines and consequently without any decay of the dc supercurrents, i.e., without any energy dissipation. However, oscillations of the levitating magnet about its equilibrium position give rise to ac magnetic fields at the surface of the superconductor which modulate the shielding currents. Flux lines are now moved back and forth periodically as a result of the oscillating component of the Lorentz force. This leads to energy dissipation which we can determine from measurements of the oscillation amplitude of the magnet as a function of an external driving force. The measured losses can be attributed to various regimes of flux motion in the superconductor.
In our present work we have investigated the energy dissipation when the magnet is levitating between two horizontal YBa2Cu3O7-δ (YBCO) surfaces either of bulk material (both sintered and melt-textured) and of epitaxial thin films. In all samples and at all temperatures we find that at small amplitudes of the ac shielding currents () the dissipation can be described by a surface resistance which varies from for the bulk samples down to below for the thin films at 4 K. At larger amplitudes nonlinear behavior is observed which can be attributed to thermally activated flux flow with pinning energies whose diverging current dependence is typical for collective pinning. In addition, for a given current, the pinning energies have a linear temperature dependence which is an indication of flux creep. Upon further increase of the drive and at temperatures above 85 K we find that the dissipated power in the bulk samples varies with the cube of the amplitude. We discuss this regime in terms of hysteretic dissipation having a coefficient which diverges near . In the films, however, a quite different behavior is observed instead, namely, an exponential increase of the dissipation which ultimately exceeds even the bulk values. In this regime we can describe the data by a Kim-Anderson type model of flux motion with linearly vanishing pinning energies at large currents. In summary, by varying the drive of the oscillating magnet by five orders of magnitude we can study different regimes of vortex dynamics in YBCO at a given temperature. Some of our preliminary results on granular samples [2] and on thin films [3] have already been published in short form. In this article a more detailed analysis and a more complete account of our work is presented.
This article is organized as follows. In the next Chapter we describe our experimental method, and in Ch.III the model used for data analysis is outlined. In Ch.IV we present the results of our experiments for the thin films and for the bulk samples. Chapter V concludes our work.
II experimental method
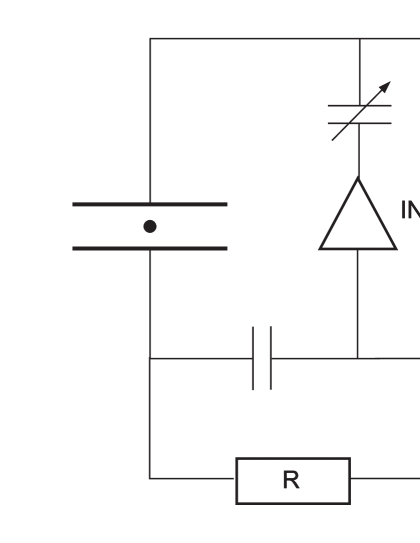
Our experimental method consists of placing a magnetic microsphere made of SmCo5 (radius 0.1 mm, mass ) between two horizontal surfaces (spacing 1 mm, diameter 4 mm) of a parallel-plate capacitor made of YBCO. This is an extension of earlier work, where the capacitor was made of niobium[4] and the levitating sphere was used for hydrodynamic studies in superfluid helium.[5] In Fig. 1 a schematic of our electronics is shown. Before the capacitor is cooled through we apply a dc voltage of about 800 V to the bottom electrode. Therefore, the magnet carries an electric charge of about 2 pC when levitating. The dc voltage is then switched off and oscillations of the magnet can be excited with an ac voltage ranging typically from 0.1 mV to 20 V and having a frequency at the resonance of the oscillations ( Hz). These vertical oscillations induce a current in the electrodes, where is the velocity of the magnet, which is measured by an electrometer connected to a lock-in amplifier. The capacitively coupled signal due to the driving voltage which is superimposed upon the signal from the oscillating magnet is electronically nulled off resonance by adding the inverted pickup of appropriate amplitude. For a given amplitude of the driving force we measure the maximum signal when slowly sweeping the frequency towards resonance. Because at large oscillation amplitudes the restoring forces become nonlinear, the resonance curves are usually hysteretic and care has to be taken to achieve resonance. We therefore also monitor the phase of the signal with respect to that of the drive. In the Appendix a short discussion of some of the elastic properties of this oscillator is presented. Further data are taken either by varying the driving force at constant temperature or by sweeping the temperature at a fixed driving force while keeping the oscillator at resonance by adjusting the frequency of the drive.
In order to infer the velocity amplitude from the measured current amplitude and the driving force from the ac voltage we determine the charge by recording a resonance curve at very small drive (which is not hysteretic) and by analyzing its width (which is given by the damping coefficient ) and its height which then determines the charge. Alternatively, in particular at low damping, we measure the time constant of the freely decaying oscillations from which we obtain . Comparing this result with the driven response at the same temperature gives the charge. The driving forces range from 10-13 N to 10-7 N, the velocity amplitudes from 0.1 mm/s to 50 mm/s, and the oscillation amplitudes from 50 nm to 30 m. The dissipated power varies from 10-9 W down to below 10-17 W.
The YBCO we used for the superconducting capacitor was either home-made sintered material[2] (thickness 2 mm) or melt-textured samples[6] of the same geometry, and epitaxial thin films[3] having a thickness of either 450 nm or 190 nm laser deposited on insulating substrates of SrTiO3 (lower electrode) and Y2O3-stabilized ZrO2 (upper electrode) both cut with an inclination of 2 degrees off the (001) orientation. The inclination improves both flux pinning and, due to initiating a terrace growth, crystallinity of the films. The lower electrode is protected by a 20 nm thick PrBa2Cu3O7 epitaxial layer. The YBCO films have an extremely sharp superconducting transition at K measured by an ac susceptibility method, the complete transition width being 0.1 K. Further details of the thin film production can be found in Ref. [7].
III Dipole Model
The oscillations of the magnet give rise to ac surface currents which exert an oscillating Lorentz force on the flux lines. This causes energy dissipation which can be determined from the damping of the oscillations either by measuring the amplitude as a function of the driving force or by recording a free decay. In this section a brief discussion of a model used for a quantitative analysis of our data is given.
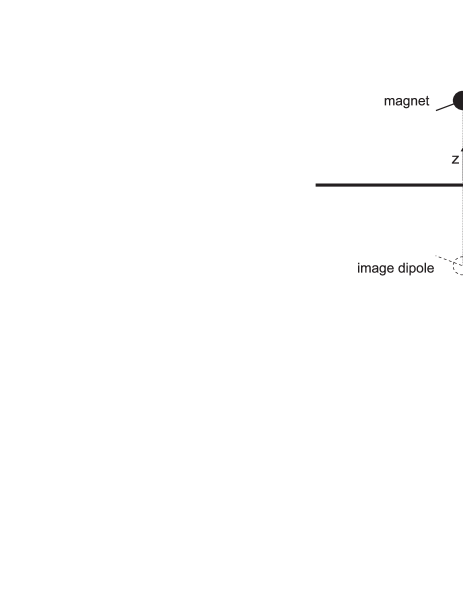
In our experiment the superconductors are cooled in the field of the magnet and therefore flux is trapped in the superconducting electrodes. We estimate the density of the trapped flux to be mT corresponding to a flux line density . After cooling we find that the magnet always levitates near the middle between the superconductors, i.e., at a levitation height mm.[9] In this position the field of the magnet at the surface of the superconductors is below and for a quantitative analysis we approximate the surface shielding currents induced by the magnet by an image dipole model. In this model the magnetic field on either surface is given by the dipolar fields of the magnet and the first image dipole (Fig. 2), neglecting images further away and also modifications of the field due to trapped flux lines. The magnetic moment of the magnet calculated from the magnetic remanence of the material and the radius is Am2. It is simple to calculate the dc sheet current on the surface for a particular orientation of the dipole with respect to the surface.[10]
The dc current distribution ( and are coordinates on the surface) is given by and with
| (1) | |||||
| (2) |
where . The parallel orientation of the dipole () has the lowest energy but because of trapped flux we cannot rule out that some other orientation applies. Although the variation of the surface current is quite complex and changes drastically with the orientation of the dipole[10], the maximum value is fairly insensitive to the orientation: A/m when the dipole is perpendicular and A/m for the parallel orientation at . In either case the magnetic field is below , but some flux remains trapped because of the field-cooled situation.
The ac sheet current due to the oscillations of the magnet about its position at is
| (3) |
where is the oscillation amplitude. Again the current distribution (shown in Fig. 3) is complicated but the maximum amplitude of is insensitive to the orientation of the dipole. For an oscillation amplitude corresponding to a velocity amplitude of mm/s (at 300 Hz oscillation frequency) a maximum current amplitude of A/m is found for the perpendicular orientation and A/m for the parallel one. The current is localized in a small area of the superconducting surfaces below and above the sphere, i.e., dissipation occurs only here.
This ac sheet current is actually an oscillating current density in the samples. Flux lines will be set into motion thereby creating an electric field , where is the flux line velocity. Because and are parallel the dissipation per unit volume is given by . In bulk samples the shielding current is flowing within the London penetration depth where it decays exponentially, whereas in thin films the penetration depth can exceed the sample thickness. (Note that the Campbell penetration depth is an order of magnitude smaller because of the low trapped flux density and therefore can be neglected.) For simplicity, we use an average current density inside the samples, where is either the penetration depth in case of bulk samples or the film thickness. We may then describe the dissipation per unit area by , where depends on .
a)
![[Uncaptioned image]](/html/cond-mat/9901085/assets/x3.png)
b)
![[Uncaptioned image]](/html/cond-mat/9901085/assets/x4.png)
FIG. 3.: Vector plots of the ac surface currents
calculated from Eq. 3: a)
for parallel and b) for perpendicular orientation of the dipole. In our case
and therefore the displayed surface area is
each.
We calculate the stationary velocity amplitude of the magnet by employing the energy balance between the gain from the driving force (which at resonance is in phase with the velocity) and the loss per cycle (period ) on both surfaces:
| (4) |
Because it is evident from Eq. 4 that a linear dependence of corresponds to a linear response while a nonlinear response implies a nonlinear current-voltage relation. Secondly, it is obvious that the driving force is a measure of the electric field, i.e., of the vortex velocity. In the following chapter we present our experimental results and analyze them on the basis of Eq. 4.
IV Results and Discussion
We first describe and discuss the data obtained with the thin film samples which are very similar for both the 190 nm and the 450 nm thick films. Then, the measurements on the bulk samples are presented which are very similar for both granular and melt-textured YBCO.
A Thin films
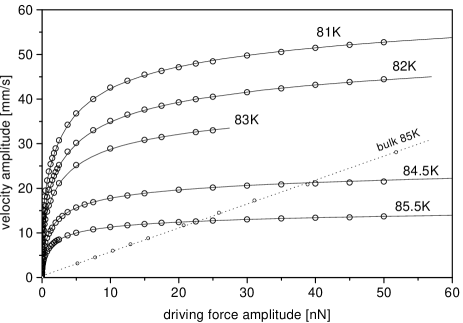
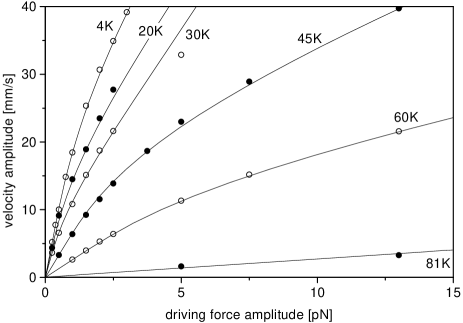
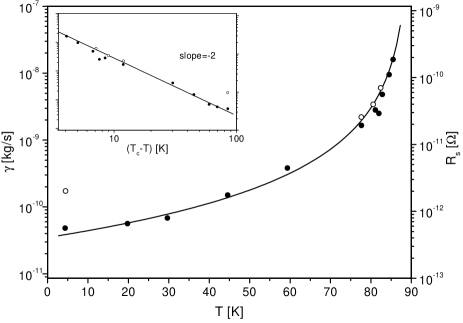
A summary of our data obtained with the 450 nm films above 77 K is shown in Fig. 4. At small driving forces we find a steep initial increase of the velocity amplitude of the magnet, whereas at driving forces above ca. 10 nN there is only a logarithmic dependence. This implies an exponential increase of the dissipation. At lower temperatures the velocity amplitudes increase very rapidly with drive as shown in Fig. 5 with a largely expanded abscissa. Further increase of the driving force amplitude gave unstable oscillations. Only at very small amplitudes we do find a linear regime between the driving force amplitude and the velocity amplitude , i.e., with a strongly temperature dependent coefficient , see Fig. 6. While decreases considerably below the critical temperature , it obviously levels off at 4 K. Here the Q-factor which we attribute exclusively to losses in the superconductor[8] exceeds . The steep drop below follows approximately a law as can be seen in the insert of Fig. 6.
In the linear regime the induced electric field in the superconductors is proportional to the surface current amplitude, , and the loss (r.h.s. of Eq. 4) can be described by a surface resistance , namely
| (5) |
where
| (6) |
Here we assume that is a constant on the surface of both superconductors. The surface integral is evaluated numerically. In Fig. 6 the values are plotted on the right scale for the parallel orientation of the dipole.[11]
From the surface resistance we can infer the imaginary part of the penetration depth of the ac field being given by . In our case () we find to drop from 84 nm at 85 K down to only 0.2 nm at 4 K. A steep decrease of the surface resistance with temperature has been observed at radio and microwave frequencies [12] and is discussed in terms of various models of flux dynamics. In the limit of very low frequencies it has been calculated[13] that the complex resistivity due to vortex motion is greatly altered when flux creep is included. Instead of a purely imaginary resistivity the result has a real part given by where is the usual resistivity for free vortex flow ( is the vortex viscosity) and , where is a modified Bessel function and depends on the pinning energy . There is ample evidence[14] that below 70 K is a temperature independent quantity ranging from 3 to 9. In fact, for our results would agree very well with ( is the film thickness) if a trapped flux density of 1 mT and typical values for are assumed, see Ref. [14] for a compilation of viscosity data. This value for appears quite reasonable because, as will be shown below, in the nonlinear regime, where begins to drop with increasing current, we find at a current amplitude of 50 A/m. It should be mentioned that recent work on the surface impedance of conventional superconductors[15] has shown that a more complicated electrodynamical description is required. If this theory were directly applied to our experiment (thin films, low frequency, low vortex density) one would obtain the simple relation which would agree both in temperature dependence (including the region near ) and in order of magnitude with our data. However, this remains to be justified and therefore at present is only a speculation.
In Fig. 7 the data of Fig. 4 are plotted on a logarithmic scale for the driving force . Above 10 nN we find a logarithmic dependence which implies an exponential increase of the losses. For driving forces between 0.1 nN and 10 nN the amplitudes appear to be reduced indicating an additional loss mechanism in this regime. Furthermore, it is noteworthy that obviously the driving force and hence the electric field, or vortex velocity, determines which mechanism dominates and not the oscillation amplitude, or shielding current.
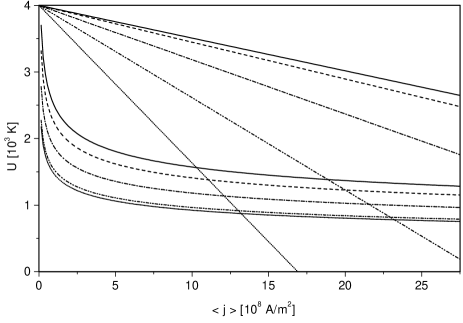
In the nonlinear regime of the electric field in Eq. 4 must have a nonlinear current dependence. This is usually described by thermally activated flux motion with current dependent pinning energies , for a review see Ref. [16]. Essentially two different dependences are being considered, firstly barriers diverging for :
| (7) |
where . Vortex glass and collective creep models yield this behavior which implies zero dissipation in the limit . Secondly, for large currents, one considers barriers vanishing at a critical current density as
| (8) |
which leads to an exponential dissipation for large currents (Kim-Anderson model), with .
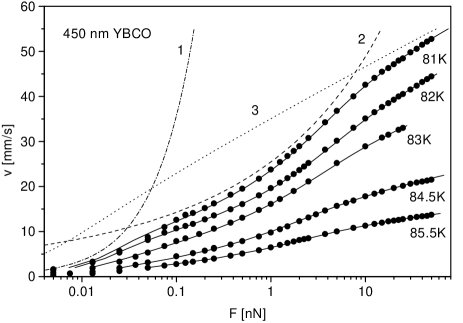
We fit the complete curves by including both nonlinear mechanisms (Eqs. 7 and 8) and a linear term additively in the energy balance, see Eq. 4. An example is shown in Fig. 7, where the separate contributions and their sum are compared with an experimental curve. The linear term (surface resistance) contributes only at very low amplitudes. In the intermediate range the glass (or creep) term (Eq. 7 with ) is dominant. Only at the largest drives the Kim-Anderson term (Eq. 8) becomes relevant. It is this mechanism which leads to the observed slow logarithmic increase of the oscillation amplitudes. From these fits we can determine the barriers at various temperatures, see Fig. 8. It is a peculiarity of Eq. 8 that only the constant slope can be obtained reliably from a fit to the data because the quantity determines only the prefactor which we do not evaluate for it contains other unknown quantities, e.g. the density of the trapped flux or the prefactor of the vortex velocity . From Fig. 8 it is evident that at large currents and high temperatures the barriers of Eq. 8 ultimately drop below those of Eq. 7. For the exponent determining the barriers we find which is close to the theoretical value 1/7 for single vortex pinning which is resonable for the small vortex densities in our experiment.[17] We should mention that the exponential fitting parameters are not affected by the particular current distribution used (parallel or perpendicular orientation of the dipole), only prefactors are different because the parallel dipole leads to a lower total dissipation than the perpendicular one.
It is interesting to note that all three mechanisms of dissipation are found to coexist at the same temperature but dominate in different regimes of the driving force. Furthermore, we find that the current which sets the scale for the exponential dissipation extrapolates to zero at 86.5 K (well below K) which might indicate an onset of free flux flow where the magnet loses its lateral stability.
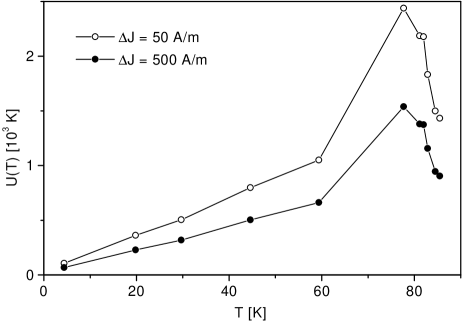
Towards lower temperatures only the linear term and the glass term contribute as no data could be obtained at larger drives because the oscillations became unstable. For temperatures below 60 K we find that the evaluated barriers decrease nearly linearly with temperature, see Fig. 9. We find and (i.e., and 5) for current amplitudes of 50 A/m and 500 A/m, respectively. The ratio 1.6 is given by the factor , see Eq. 7. The linearity of is again a signature of flux creep, but now with a current dependent creep factor. The values for are determined by the logarithm of various properties of the pinning centers and of the inverse frequency. For this reason our values obtained at 300 Hz are larger than those obtained at microwave frequencies[12] but lower than those obtained from magnetic relaxation measurements. Approaching the effective barrier finally decreases (see Fig. 8) because the quantity in Eq. 7 which is related to the critical current density[16] goes to zero.
B Bulk samples
We will now give an overview of the measurements with YBCO bulk samples and compare these results with the thin films. We have found that the dissipative behavior of melt-textured and sintered bulk samples is quite similar. Measurements on the sintered samples have already been published[2] and therefore we will focus on our melt-textured results. We emphasize, however, that our present interpretation of the data is more complete and to some extent makes our earlier analysis obsolete.
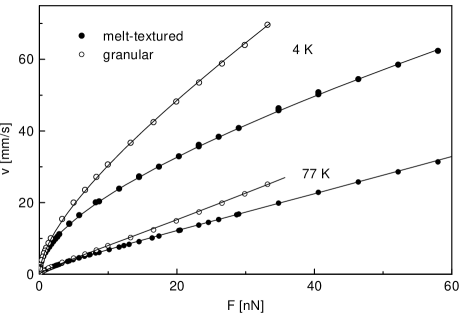
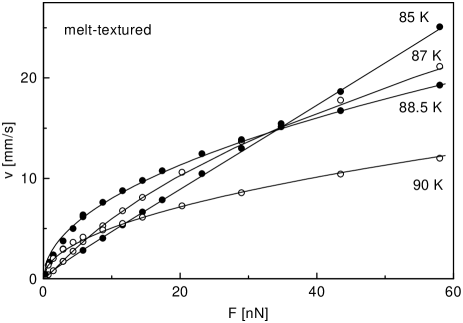
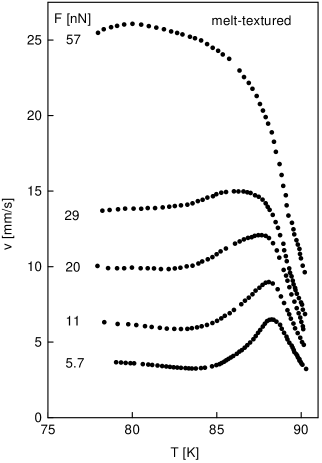
Figures 10 and 11 show the velocity amplitude of the magnet as a function of driving force at different temperatures for melt-textured and sintered samples. At 4 K we find a nonlinear increase of the amplitude even at small amplitudes followed by a nearly linear dependence for large drives. This initial nonlinear increase is less pronounced at higher temperatures where we find approximately linear curves up to 85 K. For higher temperatures additional dissipation arises and above 88 K the dependence is simply indicating a quadratic damping, i.e., losses proportional to the cube of the amplitude. Because of the various mechanisms of dissipation (to be discussed below) dominating at diffent temperatures and amplitudes, there exists a temperature range below where the oscillation amplitudes surprisingly increase with temperature at constant drive, corresponding to a minimum of dissipation. This can be seen more clearly in Fig. 12 where the velocity amplitudes are shown as a function of temperature for various constant drives. We note that for sintered YBCO the maximum is much more pronounced, see Ref. [2].
Considering the initial nonlinear increase of the amplitude at 4 K followed by a nearly linear rise for larger drives we find that this behavior can be well fitted by adding a linear dissipation and the collective flux creep (Eq. 7), using an exponent . Because Eq. 7 describes the data over almost the entire range the exponent can be determined with much better accuracy than with the thin-film samples: increasing to 0.2, e.g., leads to a clearly poorer fit. From the linear term (dominating only at the smallest amplitudes) we infer a surface resistance which is of the order of at 4 K rising to at 85 K. Comparing these results with our data on YBCO thin films we note that at 78 K has increased by three orders of magnitude.
At 4 K the barrier in the nonlinear regime is much smaller than at high temperatures (there are no experimental data between 4 K and 77 K). Above 77 K the barriers decrease with increasing temperature. These results are similar to those obtained with the films except for the fact that the barriers in the bulk are a factor of 2 smaller than in the films.
For temperatures above 85 K quadratic damping rapidly increases and eventually becomes to be the only relevant dissipation above 88 K. We attribute this to a mechanism proposed by Melville[18] for conventional superconductors in which single vortices are considered being trapped perpendicular to the surface of the superconductor. When an external field smaller than is applied shielding currents are induced at the surface producing a Lorentz force on the trapped vortices. If this force is strong enough to depin the vortices they will bend in the direction of the applied force, while they stay pinned in the interior of the bulk where no current is flowing. The amount of bending is given by the equilibrium between the Lorentz force and the elastic force of the vortex. When the applied field is reduced and finally reversed the vortex moves back in an irreversible way, so that the flux component parallel to the surface passes through a hysteresis. This leads to dissipation where the loss per cycle and surface area is given by , where is the amplitude of the external field and the depinning current density. In our experiment, and therefore, with Eq.4, this mechanism leads to quadratic damping having a coefficient which diverges at as was found experimentally already for sintered samples.[2]
It should be noted that the well known Bean critical state also leads to quadratic damping and is used successfully in the interpretation of most other levitation experiments involving larger magnets. However, in our experiment the magnetic field is low and a critical state is not reached. Also, in the model of Melville the dissipation is proportional to the density of trapped flux which makes it plausible that the losses in the melt-textured samples are larger than those in the sintered samples.
Besides the much larger damping found in bulk samples, there are two main features distinguishing the bulk results from the thin film ones: Firstly, for bulk samples the damping becomes quadratic approaching so that the amplitudes exceed those for thin films (Fig. 4) where the dissipation grows exponentially with amplitude. We believe that the reason for this is the sample thickness. In bulk samples the vortices stay pinned in the interior and move just within the penetration depth. In thin films the vortices are exposed to the driving current over their entire length. This leads to high flow rates of the vortices in the films whereas in bulk samples the flow rates are limited due to pinning deeper inside the samples.
Secondly, for bulk samples there is a minimum in dissipation below while for thin films the damping grows monotonically with temperature. This minimum might be due to a softening of the flux line lattice leading to improved pinning because the vortices can adjust more effectively to a state of lower total energy. At still higher temperatures pinning becomes less effective, hysteretic damping occurs and dissipation diverges approaching . In thin films the exponential growth of dissipation dominates and no minimum in damping occurs.
V conclusion
In summary, the damping of the oscillations of the levitating magnet is due to energy losses caused by flux motion of various dynamic regimes. At sufficiently small amplitudes linear friction is observed which can be described by a surface impedance having particularly low values for thin films at low temperatures. The temperature dependence of the surface impedance is discussed in terms of a vortex resistivity caused by flux creep. Towards larger amplitudes we find losses to originate from the motion of collectively pinned vortices. From our analysis pinning barriers are obtained having the typical inverse current dependence. The effective barriers increase linearly with temperature up to 60 K as expected from creep effects. Finally, at even larger amplitudes, the losses in the films grow exponentially and eventually exceed those in the bulk samples. This seems plausible because in the films the flux lines are exposed to large current densities along their entire length, whereas in the bulk the Lorentz forces decay with increasing distance from the surface.
When comparing our experimental method (which was motivated by an interest in the physics of superconducting levitation) with more standard techniques for investigating vortex dynamics in superconductors, like measurements of the ac susceptibility, of the current voltage characteristics ,of the magnetic relaxation, or mechanical oscillators containing superconducting samples, we note several obvious differences some of which are disadvantageous while others are of advantage. Firstly, our method is not affected by demagnetization factors or edge effects, the geometry is just a magnetic dipole in the middle between essentially infinite and flat superconducting surfaces. Secondly, it is a resonance method with high sensitivity and wide dynamic range: The dissipated power varies from W down to W and the electric fields caused by vortex motion range from V/m down to V/m. Because of the resonance method, though, the frequency cannot be varied. The magnetic field is inhomogeneous and rather small, and the distribution of trapped flux lines is unknown. Nevertheless, the damping of the oscillating magnet can be described quantitatively by various mechanisms of flux dynamics with flux creep being an important issue.
acknowledgments
We are grateful to K.F. Renk for support of our work, to E.V. Pechen for providing the films and to H.J. Bornemann for the melt-textured material. We had helpful discussions with N. Lütke-Entrup and B. Plaçais on the interpretation of surface impedance measurements. Financial support by the Deutsche Forschungsgemeinschaft is gratefully acknowledged by R.G. and M.N. (Graduiertenkolleg “Komplexität in Festkörpern”).
APPENDIX: elastic forces on the oscillating microsphere
The elastic forces on the levitating microsphere were investigated by measuring the amplitude dependence of the resonance frequency and also of the second and third harmonic amplitude. In addition, the effect of a large dc voltage (up to ) across the capacitor on the above quantities was determined. By and large, the oscillator displays typical nonlinear properties.[19] The “backbone curve” , e.g., is the usual parabola for the thin-film samples below 81 K. However, at higher temperatures and for all bulk samples in particular, stronger dependences are found which indicate that a third order Taylor expansion of the return forces at the equilibrium position is no longer adequate. On the other hand, the coefficients of the second and third harmonic are found to be independent of temperature. Application of the dc voltage changes the equilibrium position by few tens of micrometers as can be estimated from the stiffness. Furthermore, the resonance frequency changes because of the changing tension, in analogy with a vibrating string: is proportional to the static force as observed earlier with a niobium capacitor.[4] The coefficient of the second harmonic is strongly affected and can be reduced to zero at a particular voltage, which implies a symmetric return force at the new equilibrium position.
These elastic properties may be discussed in terms of the image-dipole model presented in Ch. III. Neglecting higher order images the resonance frequency is easily calculated to be if the equilibrium position is in the middle between the two surfaces. Gravitation and especially trapped flux lead to unsymmetric forces and therefore to an unsymmetric position and hence to a second harmonic amplitude. The force between a single vortex and a magnetic dipole perpendicular above a superconducting thin film has been considered in Ref. [20]. Because we have no quantitative information on the distribution and the orientation of the trapped vortex lines in the samples we cannot calculate their contribution to the elastic forces on the levitating magnet. Therefore, the image-dipole model remains a rather crude description of the elastic forces. For lateral stability of the magnet, which is a prerequisite of our method, trapped flux is clearly necessary.
REFERENCES
- [1] F. C. Moon, Superconducting Levitation (John Wiley & Sons, New York, 1994).
- [2] R. Grosser, J. Jäger, J. Betz, and W. Schoepe, Appl. Phys. Lett. 67, 2400 (1995).
- [3] R. Grosser, A. Martin, M. Niemetz, E.V. Pechen, and W. Schoepe, cond-mat/9712199.
- [4] H. Barowski, K. M. Sattler, and W. Schoepe, J. Low Temp. Phys. 93, 85 (1993).
- [5] J. Jäger, B. Schuderer, and W. Schoepe, Phys. Rev. Lett.74, 566 (1995) and Physica B 210, 201 (1995).
- [6] H. J. Bornemann, C. Urban, P. Boegler, H. K pfer, H. Rietschel, Advances in Superconductivity VI, edited by T. Fujita and Y. Shiohara (Springer-Verlag, Tokyo, 1994), Vol 2, p. 1311.
- [7] E. V. Pechen, A. V. Varlashkin, S. I. Krasnosvobodtsev, B. Brunner, and K. F. Renk, Appl. Phys. Lett. 66, 2292 (1995).
- [8] The Q-factor is still low enough to neglect dissipation by the input impedance of the electrometer or by residual gas (the cell was evacuated and contained charcoal for cryopumping). Eddy current losses in normal conducting metal parts of the measuring cell are difficult to estimate but appear to be too small to limit the Q value at 4 K.
- [9] At the end of the experiment the capacitor was heated above and the magnet fell to the lower electrode. The change of the induced charge was measured. From this we determine the levitation height to be mm.
- [10] S. B. Haley and H. J. Fink, Phys. Rev. B53, 3506 (1996).
- [11] For the perpendicular orientation would be smaller by a factor of 2. Because the surface current scales proportional to the magnetic moment of the sphere, the absolute values of are uncertain to within a factor 2 to 4.
- [12] N. Belk, D. E. Oates, D. A. Feld, G. Dresselhaus, M. S. Dresselhaus, Phys. Rev. B53, 3459 (1996); J. R. Powell, A. Porch, R. G. Humphreys, F. Wellhöfer, M. J. Lancaster, and C. E. Gough, Phys. Rev. B57, 5474 (1998).
- [13] M. W. Coffey and J. R. Clem, Phys. Rev. B45, 10527 (1992).
- [14] M. Golosovsky, M. Tsindlekht and D. Davidov, Supercond. Sci. Technol. 9, 1 (1996).
- [15] N. Lütke-Entrup, B. Plaçais, P. Mathieu, Y. Simon, Phys. Rev. Lett. 79, 2538 (1997); Physica B, to be published.
- [16] G. Blatter, M. V. Feigelman, V. B. Geshkenbein, A. I. Larkin, and V. M. Vinokur, Revs. Mod. Phys. 66, 1125 (1994); E. H. Brandt, Rep. Prog. Phys. 58, 1465 (1995).
- [17] Satisfactory fits could also be obtained using Eq. 7 with values of up to 0.6. This, however, leads to barriers comparable to for our measuring currents, which appears unreasonable.
- [18] P. H. Melville, J. Phys. C: Solid St. Phys. 4, 2833 (1971).
- [19] A. H. Nayfeh and D. T. Mook, Nonlinear Oscillations (John Wiley & Sons, New York, 1979), Chap. 4.
- [20] J. C. Wei, J. L. Chen, L. Horng, and T. J. Yang, Phys. Rev. B54, 15429 (1996).