Broadband dielectric response of glycerol and propylene carbonate: a comparison
Abstract
Dielectric data on glycerol and propylene carbonate covering 18 decades of frequency are presented and compared to each other. Both materials exhibit qualitatively similar behavior except for marked differences in the high-frequency region just below the boson peak. The results on both materials are consistent with the mode coupling theory of the glass transition.
I Introduction
In recent years, a variety of new theoretical and phenomenological approaches of the glass transition (e.g., mctrev ; NgaiKiv ; Nagscal ) stimulated new experimental investigations especially of the high-frequency dynamics of glass-forming liquids Men ; nsrev ; Cum ; Wutt ; Du ; Le ; Lunkigly ; Lunkiorl ; Lunkikyockn ; Lunkibos ; Schn ; Schnpc . Maybe the most controversially discussed theoretical approach of the glass transition is the mode coupling theory (MCT) mctrev , which explains the glass transition in terms of a dynamic phase transition at a critical temperature significantly above the glass temperature . For frequencies in the GHz-THz region, MCT predicts an additional contribution, now commonly termed fast -relaxation. This frequency region was mainly investigated by neutron and light scattering experiments nsrev ; Cum ; Wutt ; Du . But recently, by combining various techniques, our group was able to obtain continuous dielectric spectra on glass-forming liquids extending well into the relevant region Lunkigly ; Lunkiorl ; Lunkikyockn ; Lunkibos ; Schn ; Schnpc . For glass-forming glycerol and propylene carbonate, spectra covering 18 decades of frequency and extending well into the THz range were obtained Schn ; Schnpc . Glycerol is a rather strong strong hydrogen-bonded glass-former with a fragility parameter of rol . In contrast, propylene carbonate (PC) can be characterized as a fragile (, rol ) van der Waals liquid. In the present paper we present a comparison of the results on both materials. For the experimental details the reader is referred to our earlier publications Lunkiorl ; Schn ; Schnpc .
II
Results and discussion
Figure 1

shows the -spectra for glycerol and PC in the whole accessible frequency range. exhibits the typical asymmetrically shaped -relaxation peaks shifting through the frequency window with temperature. The data agree with the results of earlier dielectric investigations Men ; Le ; dielPC ; AngPC ; CD which were restricted to smaller frequency and temperature ranges. The dashed lines in Fig. 1 are fits of the -relaxation region with the empirical Cole-Davidson function CD . A good fit of the peak region was achieved. The temperature dependence of the parameters of the CD function, , , and CD is shown in Fig. 2.
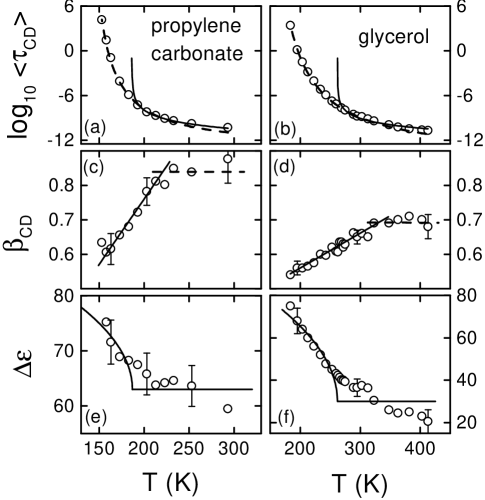
In most respects, the results are in accord with previously published data Men ; dielPC ; AngPC ; CD ; Stick2 extending them to lower or higher temperatures. can be parameterized using the Vogel-Fulcher-Tamman (VFT) equation, with K, for PC and K, for glycerol [dashed lines in Figs. 2(a) and (b)]. The values of the strength parameter characterize PC as fragile and glycerol as intermediate in Angell’s classification scheme strong . At high temperatures small deviations from VFT behavior show up, similar to those seen in earlier work Men ; AngPC ; Stick2 . The simplest version of MCT, the idealized MCT mctrev , predicts a critical behavior of the -relaxation timescale, with . Here and are the power law exponents of the -minimum (see below). The solid lines in Figs. 2(a) and (b) are fits with the MCT prediction with K for PC and K for glycerol, fixed to the values obtained from the analysis of the -minimum (see below). Only the data above 200 K for PC and above 280 K for glycerol have been used for the fits which led to a good agreement in this temperature region. For lower temperatures deviations show up. This can be understood within the extended MCT mctrev where the structural arrest found in idealized MCT for is overcome by the introduction of thermally activated hopping processes.
For both materials, the width parameter [Figs. 2(c) and (d)] increases linearly below about 200 K for PC and 300 K for glycerol. For , MCT predicts a temperature independent spectral form of the -process. Indeed, a tendency to saturate is seen for in Figs. 2(c) and (d), however at temperatures somewhat above , only. But a reasonable description of the -peaks for is also possible with a constant for glycerol Lunkibos and for PC. The of PC and glycerol [Figs. 2(e) and (f)] both decrease with temperature. According to MCT, should be temperature independent for . In addition, for , follows from extended MCT. In Figs. 2(e) and (f) the lines were calculated using the MCT prediction. The agreement of fits and data is rather poor, but due to the large experimental uncertainties no definite conclusion can be drawn. At least it seems that assumes a weaker temperature dependence above .
At frequencies about 2-3 decades above the peak frequency, for both materials an excess wing shows up as power law, with (Fig. 1). The exponent decreases with decreasing temperature as found previously for various glass-forming materials Le . For PC, at 203 K and for glycerol at 272 K, the excess wing has merged with the -peak. The excess wing seems to be a universal feature of glass-forming liquids Nagscal but, up to now, no consensus concerning its microscopic origin was achieved. For a more detailed treatment of the excess wing in glycerol and PC, see Schnpc .
At frequencies in the GHz-THz range, exhibits a minimum for both materials Lunkigly ; Lunkiorl . A magnified view is given in Fig. 3.

Clearly this minimum is too shallow to be described by a simple superposition of -peak (or excess wing) and boson peak Lunkigly ; Lunkiorl . Near 1 THz, for both materials the FIR measurements reveal a peak or shoulder, that can be ascribed to the boson peak, well known from light and neutron scattering experiments Wutt ; Du . Both materials exhibit a significantly different behavior in the region between minimum and boson peak: For PC only one power law, , is seen at frequencies forming simultaneously the high frequency wing of the -minimum and the low frequency wing of the boson peak. For , a linear behavior is approached as indicated by the dash-dotted lines in Figs. 1(a) and 3(a). In marked contrast, for glycerol two regimes can be distinguished: Just above , there is a rather shallow increase of but at higher frequencies a very steep increase appears, approaching for [dash-dotted lines in Figs. 1(b) and 3(b)].
For both materials, the -spectra between - and boson peak can be described by the phenomenological ansatz (solid lines in Fig. 1). The first term takes account of the high-frequency wing of the -peak with the parameters chosen to achieve a smooth transition to the CD-fits. The second term describes the excess wing. In order to explain the shallow minimum, a constant loss term, , as proposed by Wong and Angel Wong and a increase were assumed. Both contributions seem to be universal features in the high-frequency response of glassy ionic conductors colo03 . Finally, the power law, with takes account of the low frequency wing of the boson peak. In this way, quite impressive fits over 17 decades of frequency are possible. Of course this could be expected considering the large amount of parameters, but nevertheless it cannot be fully excluded that such a simple superposition ansatz is correct.
MCT predicts for the minimum region significant contributions from the fast -process. Within idealized MCT, above , the minimum region can be approximated by the interpolation formula mctrev . Here and denote frequency and amplitude of the minimum, respectively. The exponents and are temperature independent and constrained by where denotes the Gamma function. This implies , i.e. a significantly sublinear increase of at is predicted. For PC, a consistent description of the -minima at K is possible with (, Lunkiorl ; Schnpc [solid lines in Fig. 3(a)]. The obtained is consistent with the results from other measurement techniques Du ; Ohl ; Berg . The fits provide a good description of the data up to the boson-peak frequency. Quite a different behavior is seen in glycerol [solid lines in Fig. 3(b)]: Here the MCT fits (, , Lunkigly ; Lunkiorl are limited at high frequencies by the additional steeper increase, mentioned above. It was argued Lunkigly ; Lunkiorl , that this deviation in glycerol is due to the vibrational boson peak contribution which is not taken into account by the MCT interpolation formula. In PC this contribution seems to be of less importance. This is in accord with the finding of Sokolov et al. Sok that the amplitude ratio of boson peak and fast process is largest for strong glass formers, glycerol being much stronger than PC. However, it has to be noted, that in the present results, at least near this ratio is quite similar for both materials.
For , idealized MCT predicts the following critical temperature dependences: , , and . In Figure 4
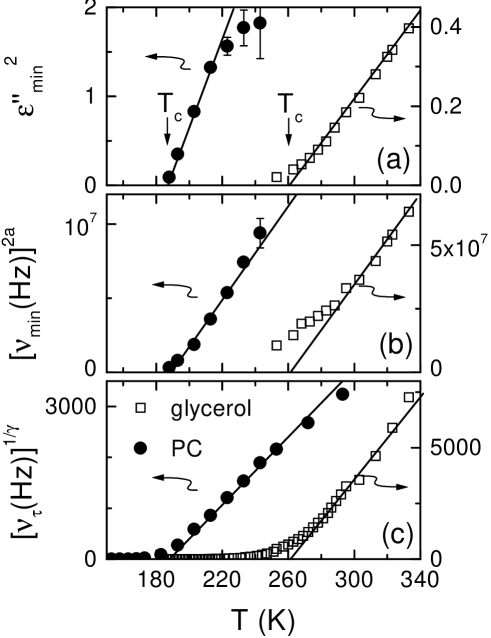
representations have been chosen that should lead to straight lines that extrapolate to . Indeed, all three data sets can be described consistently with a K for PC Lunkiorl ; Schnpc and K for glycerol Lunkigly as indicated by the solid lines. These values lie in the same range as the -value obtained from other techniques Wutt ; Du ; Ohl ; Berg ; Borj . For temperatures near the data partly deviate from the predicted behavior. Within MCT this can be ascribed to a smearing out of the critical behavior near due to hopping processes which are considered in extended versions of MCT only mctrev . In addition, the above critical temperature dependences of , , and should be valid only for temperatures not too far above . Therefore the proper choice of the temperature range to be used for the determination of is difficult which may lead to some uncertainties concerning the value of .
For , MCT predicts the occurrence of a so-called ”knee” at showing up as a change of power law from at to at mctrev . In Fig. 3(a) the dashed lines suggest a behavior for frequencies just below the boson peak. For lower frequencies the experimental data exhibit a downward deviation from the -lines. This may be indicative of the ”knee” predicted by MCT, but, clearly, the data are not of sufficient quality to demonstrate conclusively the existence of the ”knee”.
III Conclusions
Dielectric data on glass-forming PC and glycerol in an exceptionally broad frequency range have been presented and compared to each other and with the predictions of MCT. Concerning the -relaxation and the excess wing, both materials behave qualitatively similar. The parameters describing the spectral form and dynamics of the -relaxation are in rough agreement with the MCT predictions but clearly, Fig. 2 is not very convincing in this respect. The high-frequency response of both materials provides clear evidence for the presence of fast processes in the GHz-THz region. For glycerol an additional very steep increase towards the boson peak seems to be superimposed to the shallow -minimum. For the more fragile PC a smooth sublinear increase of is seen up to the boson peak frequency. For both materials the frequency and temperature dependence in the minimum region can be consistently described by MCT. Admittedly, also alternative explanations may be possible. But even in its idealized form, MCT provides a consistent picture for a large variety of experimental facts. Obviously, more sophisticated approaches within MCT, e.g. including hopping processes mctrev , the boson peak Fra , or orientational degrees of freedom Schkug are necessary to eliminate deviations still seen in the present work.
Acknowledgements.
We gratefully acknowledge stimulating discussion with C.A. Angell, R. Böhmer, H.Z. Cummins, W. Götze, K.L. Ngai, R. Schilling, W. Schirmacher, and J. Wuttke. This work was supported by the Deutsche Forschungsgemeinschaft, Grant-No. LO264/8-1 and the BMBF, contract-No. 13N6917.References
- (1) for a review of MCT, see: Götze, W. and Sjögren, L., Rep. Progr. Phys 55, 241 (1992).
- (2) Ngai, K.L., Comments Solid State Phys. 9, 121 (1979); Kivelson, D. et al., Physica A 219, 27 (1995).
- (3) Dixon, P.K. et al., Phys. Rev. Lett. 65, 1108 (1990).
- (4) Menon, N. et al, J. Non-Cryst. Solids 141, 61 (1992); Schönhals, A. et al., Phys. Rev. Lett. 70, 3459 (1993); Hofmann, A. et al., in: Disorder Effects on Relaxational Processes, eds. R. Richert and A. Blumen, Berlin: Springer, 1994, p. 309.
- (5) for a review of neutron scattering results, see: Petry, W. and Wuttke, J., Transp. Theory Statist. Phys. 24, 1075 (1995).
- (6) Cummins, H.Z. et al., Z. Phys. B 103, 501 (1997).
- (7) Wuttke, J. et al., Phys. Rev. Lett. 72, 3052 (1994).
- (8) Du, W.M. et al., Phys. Rev. E 49, 14967 (1994).
- (9) Leheny, R.L. and Nagel, S.R., Europhys. Lett. 39, 447 (1997).
- (10) Lunkenheimer, P. et al., Phys. Rev. Lett. 77, 318 (1996).
- (11) Lunkenheimer, P. et al., in: Supercooled Liquids: Advances and Novel Applications, eds. J.T. Fourkas, D. Kivelson, U. Mohanty, and K.A. Nelson, Washington, DC: ACS Publications, 1997, p. 168.
- (12) Lunkenheimer, P. et al., Progr. Theor. Phys. Suppl. 126, 123 (1997); Lunkenheimer, P. et al., Phys. Rev. Lett. 78, 2995 (1997).
- (13) Lunkenheimer, P. et al., Mat. Res. Soc. Symp. Proc. 455, 47 (1997).
- (14) Schneider, U. et al., J. Non-Cryst. Solids 235-237, 173 (1998).
- (15) Schneider, U. et al., to be published.
- (16) C.A. Angell, in Relaxations in Complex Systems, eds. K.L Ngai and G.B. Wright, Washington, D.C.: NRL, 1985, p.3; Böhmer, R. and Angell, C.A., Phys. Rev. B 45, 10091 (1992).
- (17) Böhmer, R. et al., D.J., J. Chem. Phys. 99, 4201 (1993).
- (18) Johari, G.P. and Goldstein, M., J. Chem. Phys. 53, 2372 (1970); Böhmer, R. et al., Z. Phys. B 99, 91 (1995).
- (19) Angell, C.A. et al., D.L., J. Molecular Liquids 56, 275 (1993).
- (20) Davidson, D.W. and Cole, R.H., J. Chem. Phys. 18, 1417 (1950); Davidson, D.W. and Cole, R.H., J. Chem. Phys. 19, 1484 (1951).
- (21) Stickel, F. et al., J. Chem. Phys. 104, 2043 (1996).
- (22) Wong, J. and Angell, C.A. in Glass: Structure by Spectroscopy, New York, Basel: M. Dekker Inc., 1974, p. 750.
- (23) see, e.g., Lee, W.K. et al., Phys. Rev. Lett. 67, 1559 (1991); Cramer, C. et al., Philos. Mag. B 71, 701 (1995); Ngai, K.L. et al., J. Non-Cryst. Solids 222, 383 (1997).
- (24) Wuttke, J., Ohl, M. et al., to be published.
- (25) Ma, J. et al., Phys. Rev. E 54, 2786 (1996).
- (26) Sokolov, A.P. et al., Phys. Rev. Lett. 71, 2062 (1993).
- (27) Börjesson, L. et al., Chem. Phys. 149, 209 (1990).
- (28) Franosch, T. et al., Phys. Rev. E 55, 3183 (1997).
- (29) Schilling, R. and Scheidsteger, T., Phys. Rev. E 56, 2932 (1997).