[
Temperature Evolution of the Pseudogap State in the Infra-Red Response of Underdoped La2-xSrxCuO4
Abstract
The ab-plane optical spectra of two single crystals of underdoped La2-xSrxCuO4 were investigated. The reflectivity of La1.87Sr0.13CuO4 has been measured in the frequency range 30 – 9,000 cm-1 (0.004 – 1 eV) both parallel and perpendicular to the CuO2 planes, whereas La1.86Sr0.14CuO4 was studied only in the -plane. The extended Drude model shows that the frequency-dependent effective scattering rate is strongly suppressed below the high-frequency straight-line extrapolation, a signature of the pseudogap state. This suppression can be seen from temperatures below the superconducting transition up to 400 K. In the case of underdoped LSCO the straight-line extrapolation is temperature independent below 200 K, whereas above 200 K there is a strong temperature dependence of the high-frequency . The out-of-plane direction is also examined for evidence of the pseudogap state.
pacs:
PACS numbers: 74.25.Gz, 74.7.2.Dn, 74.72.Jt, 74.72.-h, 78.20.Ci]
The presence of a pseudogap in the normal state of underdoped high temperature superconductors is by now widely accepted.[1] The strongest evidence for the pseudogap state comes from recent measurements of angle resolved photoemission spectra[2] as well as vacuum tunneling[3]. However, these techniques both demand extremely high surface quality and have therefore mainly been restricted to Bi2Sr2CaCu2O8+δ(Bi221) and YBa2Cu3O7-δ(Y123) materials, both with two CuO2 layers per unit cell. Techniques that probe deeper into the sample such as dc transport[4, 5, 6], optical conductivity [7, 8, 9] and NMR[10] were not only the earliest to show evidence of the pseudogap but have been extended to a much larger variety of materials, including several materials with one CuO2.[6] In all cases evidence for a pseudogap has been reported.
The pseudogap in LSCO as seen by NMR and neutron scattering[11] is rather weak and has led to the suggestion that the existence of the pseudogap in the spin excitation spectrum is only possible in bilayer compounds such as Y123 and YBa2Cu4O4(Y124). In particular, Millis and Monien attribute the pseudogap (or the spin gap) to strong antiferromagnetic correlations between the planes in the bilayer, which are responsible for a quantum order-disorder transition.[10]
Apart from having only one CuO2 layer La2-xSrxCuO4 (LSCO) is also a good model system for the study of doping dependences since it can be doped by the addition of strontium over a wide range: from the underdoped, where increases with Sr content, to the optimally doped where reaches its maximum value of K at , and to the overdoped region where at .[6]
The characteristic signatures of the pseudogap state in the dc resistivity[4] are seen clearly in LSCO[6, 12]. These are the striking deviations below a temperature from the high temperature linear resistivity, resulting in a clear break in slope at . It was found by B. Batlogg et al. [6] that in LSCO decreases from 800 K to approximately 300 K as the doping level is increased from the strongly underdoped to just over the optimal doping level. Similar behavior at has been observed in the Hall effect coefficient and the magnetic susceptibility.[13, 14]
The pseudogap can also be observed if the conductivity is measured in the frequency domain, , where it shows up as a striking depression of the frequency dependent scattering rate at low frequency. It is found that below a frequency cm-1, the scattering rate drops below its high temperature, high frequency, linear behavior. This effect has been clearly identified in the bilayer materials.[7, 8, 9] One of the aims of this paper is to see if this behavior can also be observed in LSCO. A pseudogap state can be defined in terms of this suppression of scattering: the material is in the pseudogap state when the scattering rate falls below the high frequency straight-line extrapolation. In the low frequency limit the scattering rate is proportional to the dc resistivity. Due to this, the 1/(,T) suppression should be compared to the suppression of (T) [6] at temperatures below the linear T dependence region. The IR measurement gives us the possibility to see both the frequency and the temperature dependence of this feature.
A pseudogap feature can also be observed in the c-axis IR conductivity in the form of a gap-like region of depressed conductivity at low frequency. It has been reported in YBa2Cu3O7-x (Y123) and YBa2Cu4O8 (Y124) materials[7, 15] as well as in LSCO[16, 17]. In slightly underdoped LSCO the pseudogap state in the -axis direction is not as well defined as it is in the two plane materials.[7] However, as the doping is reduced further, the -axis pseudogap state features below 0.1 eV become clearer.[17]
Previous work on the in-plane of the single layer lanthanum strontium cuprate includes work on the oxygen doped La2CuO4-δ[18], thin films of LSCO[19] as well as work done on LSCO single crystal at room temperature[12]. To our knowledge, a study of the temperature and doping dependence has not been done. We fill this gap here by performing optical measurements on high-quality LSCO single crystals at temperatures ranging from 10 K to 300 K at two different doping levels, both slightly underdoped. Also the optical properties of both the ab-plane and c-axis of La1.87Sr0.13CuO4 were measured on the same crystal.
To better display the effect of increased coherence on resulting from the formation of the pseudogap state we use the memory function, or extended Drude analysis. In this treatment the complex optical conductivity is modeled by a Drude spectrum with a frequency-dependent scattering rate and an effective electron mass.[20, 21] While the optical conductivity tends to emphasize free particle behavior, a study of the frequency dependence of the effective scattering rate puts more weight on displaying the interactions of the free particles with the elementary excitations of the system.[22] The temperature evolution of the frequency dependent scattering rate and effective mass spectra are of particular interest and are defined as follows:
| (1) |
| (2) |
Here, is the complex optical conductivity and is the plasma frequency of the charge carriers.
The single crystals of La2-xSrxCuO4 with approximate dimensions 5x3x3 mm3 were grown by the traveling-solvent floating zone technique at Oak Ridge [23] in the case of and in Tokyo [24] in the case of . The critical temperature was determined by both SQUID magnetization and resistivity measurements and was found to be 36 K for the nominal concentration of Sr and 32 K for . Since the highest in the LSCO system has been found to be 40 K for , we conclude that both crystals are underdoped.
The crystal with was aligned using Laue diffraction and polished parallel to the CuO2 planes. The crystal with was polished in Tokyo to yield both ab-plane and ac-plane faces. Both surfaces were measured. Polarizers were used for the ac-face data to separate the contribution of CuO2 planes from the c-axis optical response.
To get an uncontaminated ab-plane measurement, it is important to have the sample surface accurately parallel to the ab-plane to avoid any c- axis contribution to the optical conductivity.[25] The miscut angle between the polished surface normal and the c-axis was checked by a high precision triple axis x-ray diffractometer and was determined to be less than 0.8%.
All reflectivity measurements were performed with a Michelson interferometer using three different detectors which cover frequencies ranging from 10 to 10000 cm-1 (1.25 eV – 1.25 eV). The experimental uncertainty in the reflectance data does not exceed 1. The dc resistivity measurements were carried out using a standard 4-probe technique.
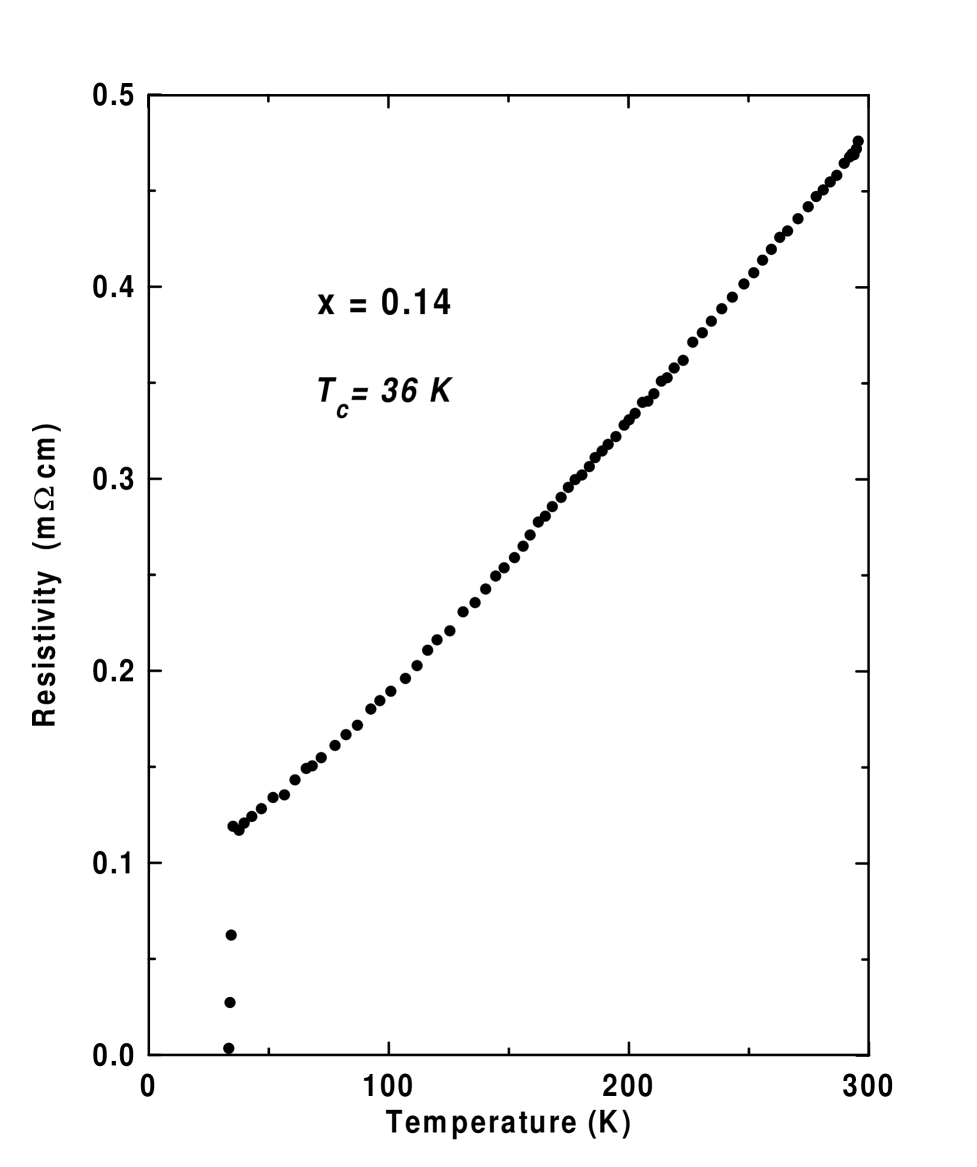
The result of the resistivity measurement on the same La1.86Sr0.14CuO4 single crystal used in the optical measurements is shown in Fig. 1. It is commonly accepted that the DC-resistivity is linear at high temperatures for LSCO and that the pseudogap begins to form near the temperature where the resistivity drops below this linear trend.[6] At lower temperatures there is a region of superlinear temperature dependent resistivity. The value for our samples with and extracted from the phase diagram of Batlogg et al.,[6] are 650 K and 450 K, respectively. In agreement with this, the resistivity shows a superlinear temperature dependence below room temperature as expected in the pseudogap region.
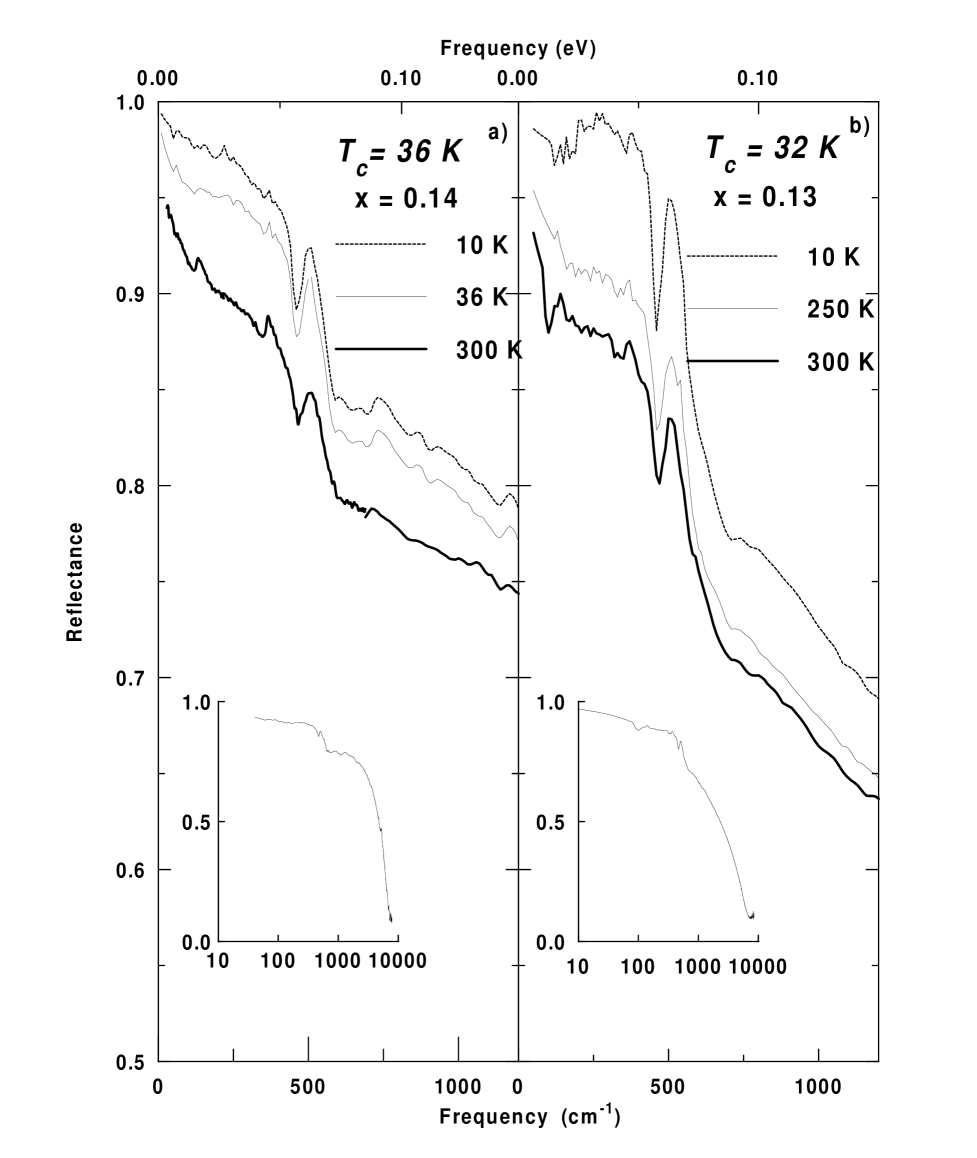
In Fig. 2 we present the reflectivity data at temperatures above and below for the two samples. For clarity, only three temperatures are shown: K, an intermediate temperature above the superconducting transition and a low temperature K in the superconducting state. In the frequency region shown the reflectance is strongly temperature dependent for both materials, dropping by approximately as temperature is increased from the lowest temperature to K. The plasma edge is observed at 7800 cm-1 (see insert of Fig. 2). The distinct peaks at approximately 135 and 365 cm-1 in the LSCO reflectivity spectra correspond to the excitation of ab-plane phonons and the peak at 500 cm-1 corresponds to a phonon.[26] As in all other HTSC materials, the ab plane has a coherent response with very high reflectance.
The complex optical conductivity was obtained by Kramers-Kronig analysis of the reflectivity data. Since, in principle, this analysis requires knowledge of the reflectance at all frequencies, reflectivity extensions must be used at high and low frequencies. The Hagen-Rubens formula was used for the low frequency reflectivity extrapolation, with parameters taken from the dc resistivity measurements on the same sample with shown in Fig. 1 and the results of H. Takagi et al.[27] for the sample with . For the high-frequency extension for cm-1 we used the reflectivity results of Uchida et al.[12] At frequencies higher than 40 eV the reflectivity was assumed to fall as .
We calculate the plasma frequency of the superconducting charge carriers and the London penetration depth using the following formula:[28]
| (3) |
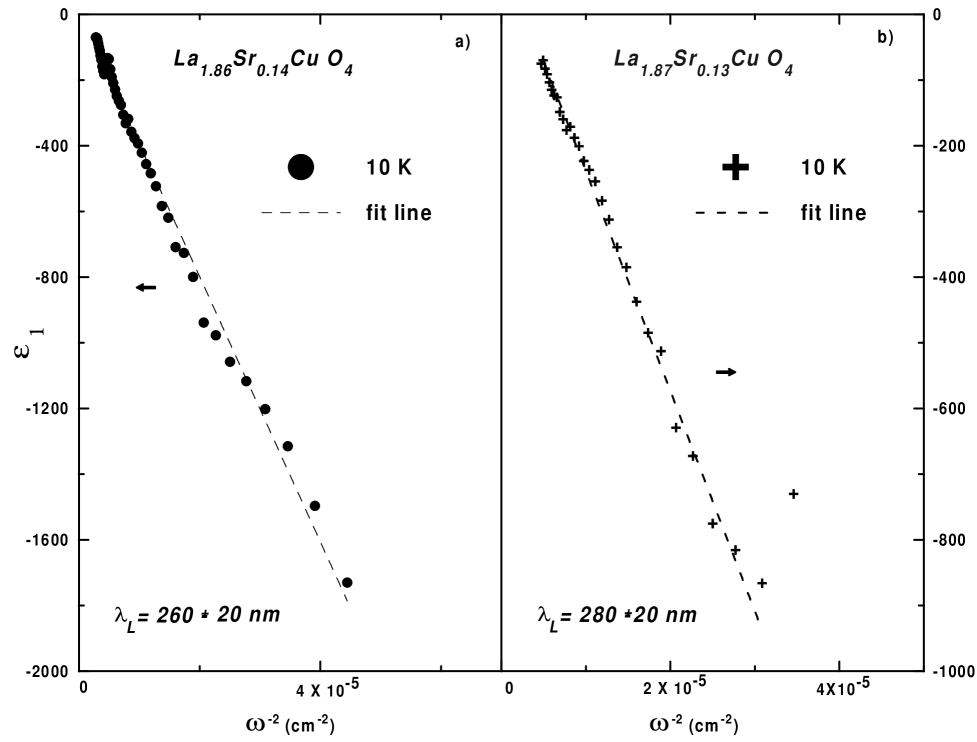
The slope of the low-frequency dielectric function, , plotted as a function of in Fig. 3a,b gives plasma frequencies of 6100 cm-1 and 5700 cm-1 in the superconducting state. The corresponding London penetration depths are nm and 280 nm for La1.86Sr0.14CuO4 and La1.87Sr0.13CuO4, respectively. These values are in good agreement with those obtained previously by Gao et al. in films[19] () and by muon-spin-relaxation[29] ().
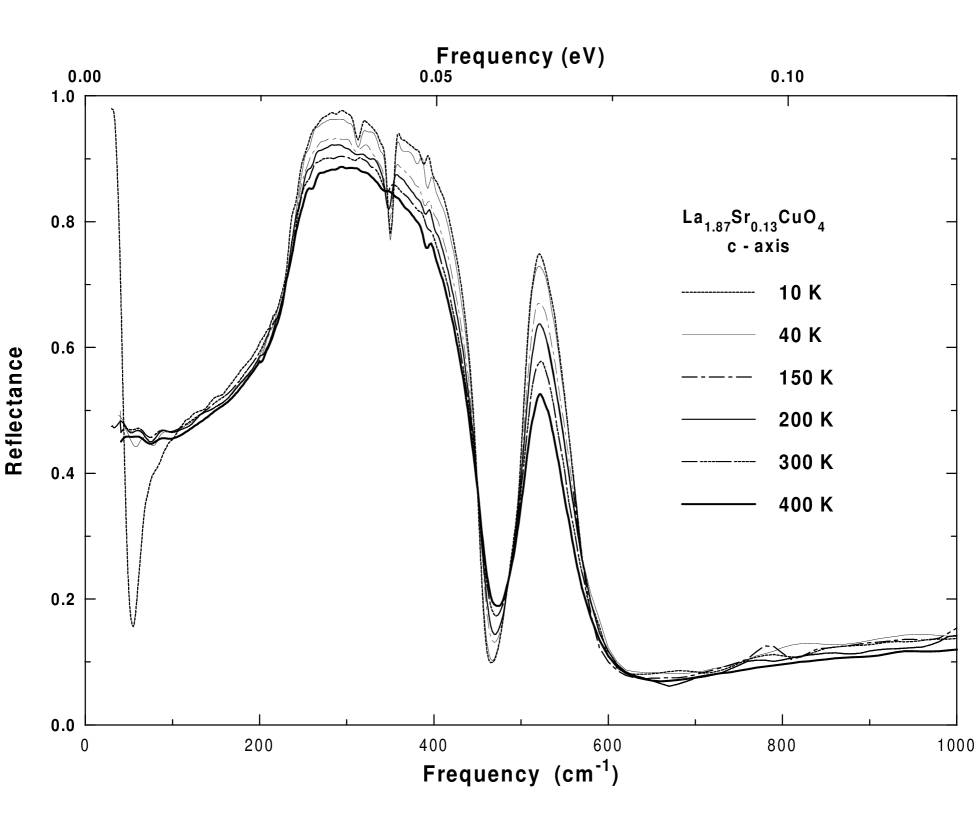
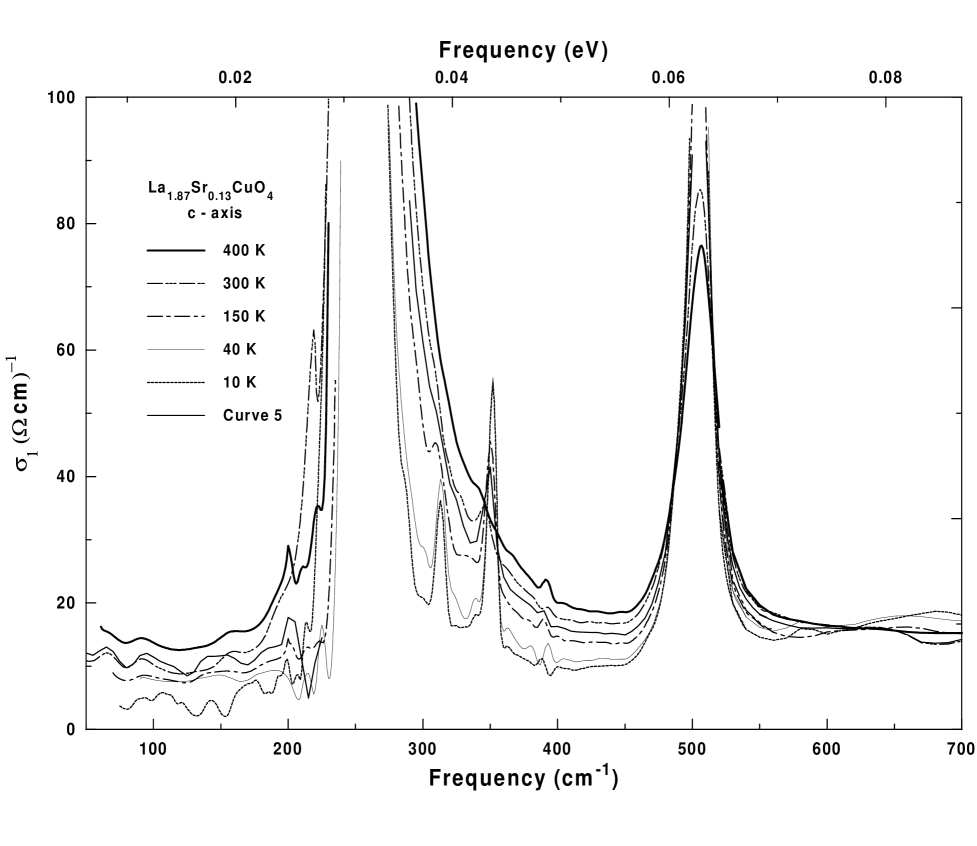
The c-axis reflectance of the sample is shown in Fig. 4. The corresponding conductivity is low and is dominated by optical phonons (Fig. 5).
In YBCO 123 and 124 the pseudogap in c-axis conductivity manifests itself as a depression in conductivity at low frequency.[15, 7, 30] There is no coherent Drude peak and the conductivity is flat and frequency independent. In the temperature and doping range where a pseudogap is expected a low frequency depression of conductivity is seen with an edge in the 300-400 cm-1 region where the conductivity rises to the high frequency plateau.
In order to isolate the electronic features of our LSCO c-axis spectrum we magnify the low value region of (Fig. 5). There is no sharp pseudogap edge in the low-frequency infrared data for underdoped LSCO as there is in the case of Y123. It is possible that such a feature could be hidden under the large phonon structure. Efforts to subtract the phonons in order to extract the background conductivity were found to be extremely sensitive to the choice of their shape in fitting procedures. Nonetheless, the raw data clearly show that there is low frequency depression of the c-axis conductivity. Conductivity at 450 cm-1 is uniformly suppressed below T300 K (Fig. 5insert), whereas the conductivity at 600 cm-1 is nearly constant at all temperatures. Based on this analysis one can conclude that the pseudogap state in the c-axis opens up below 300 K and its size is approximately equal to 500 cm-1.
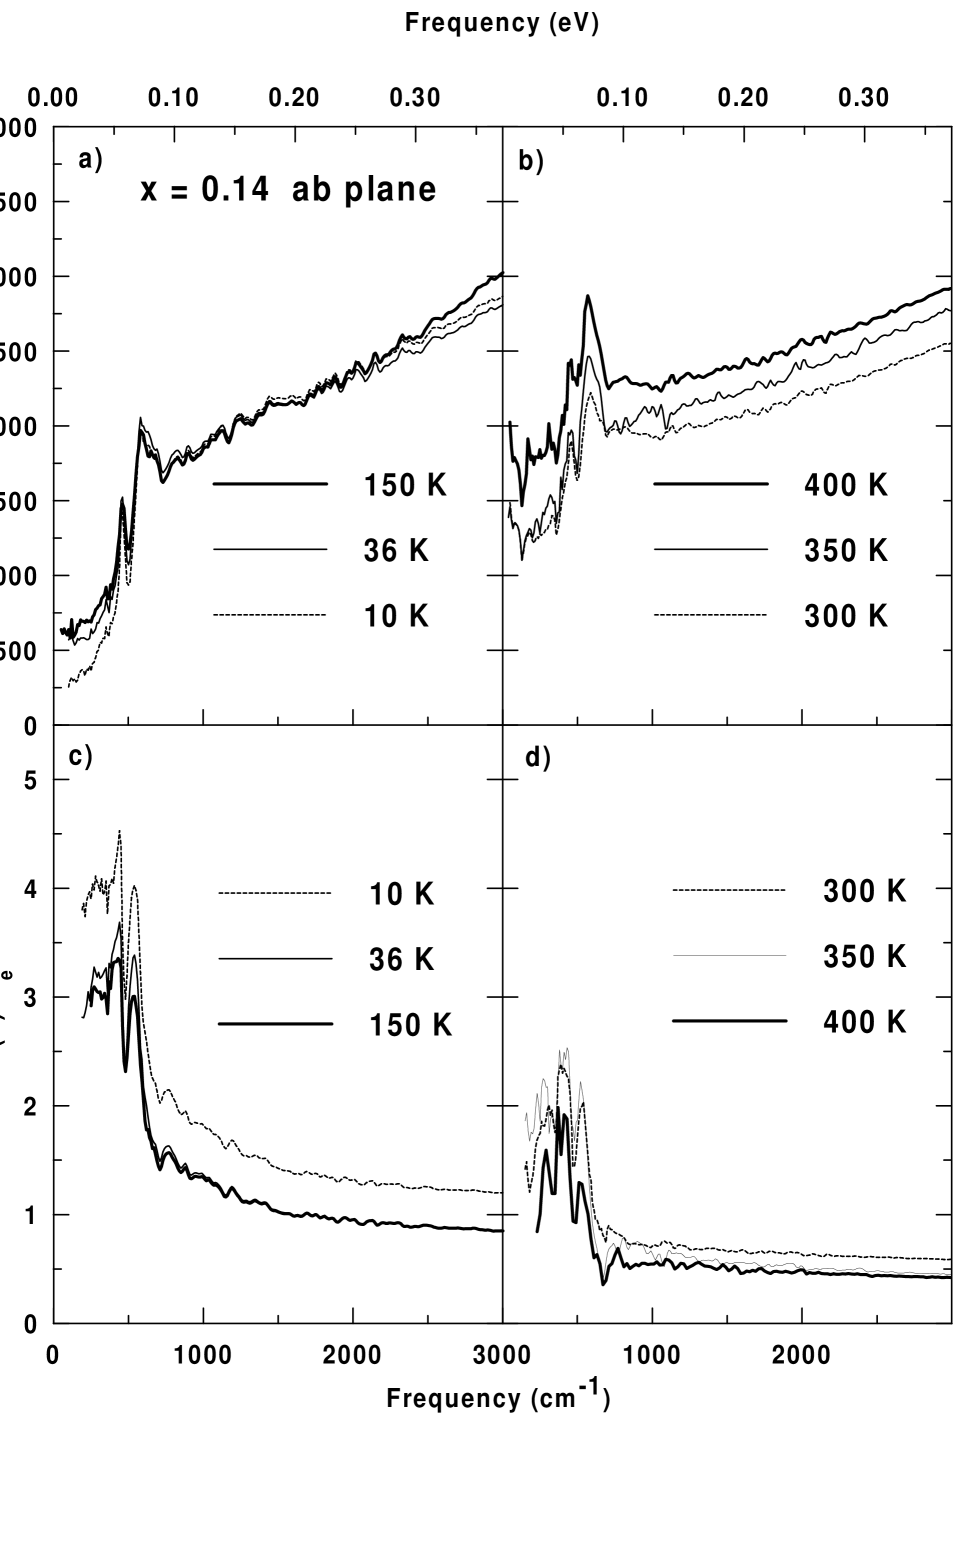
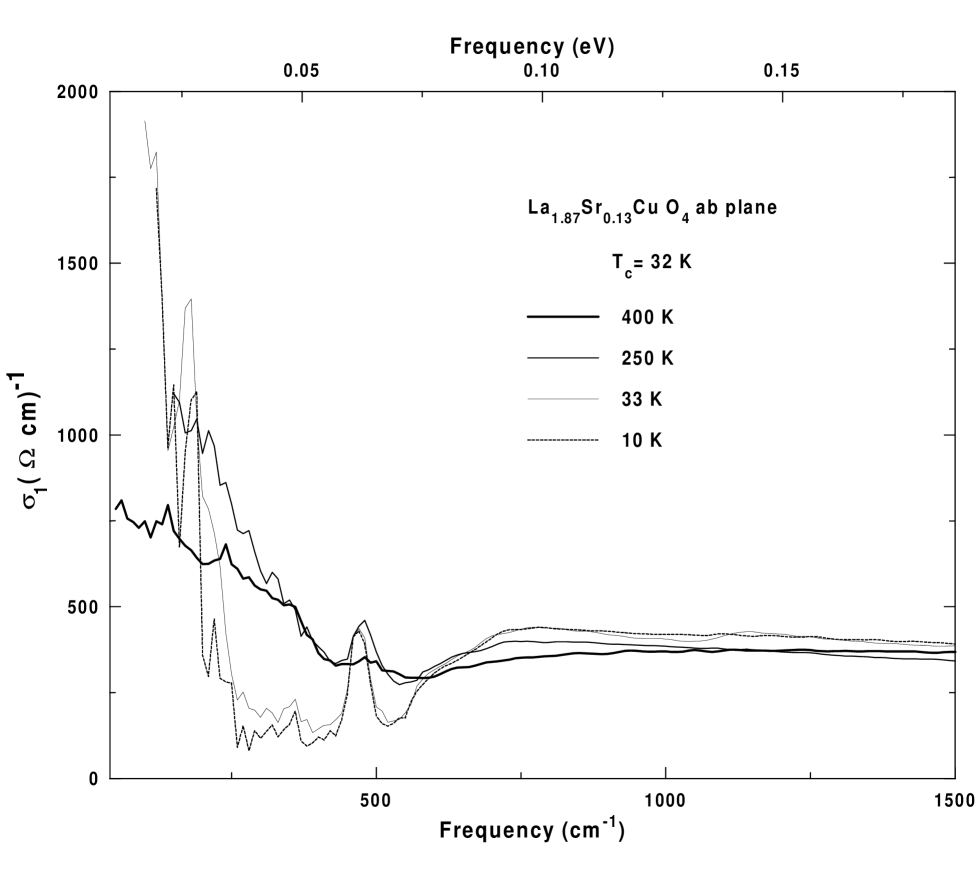
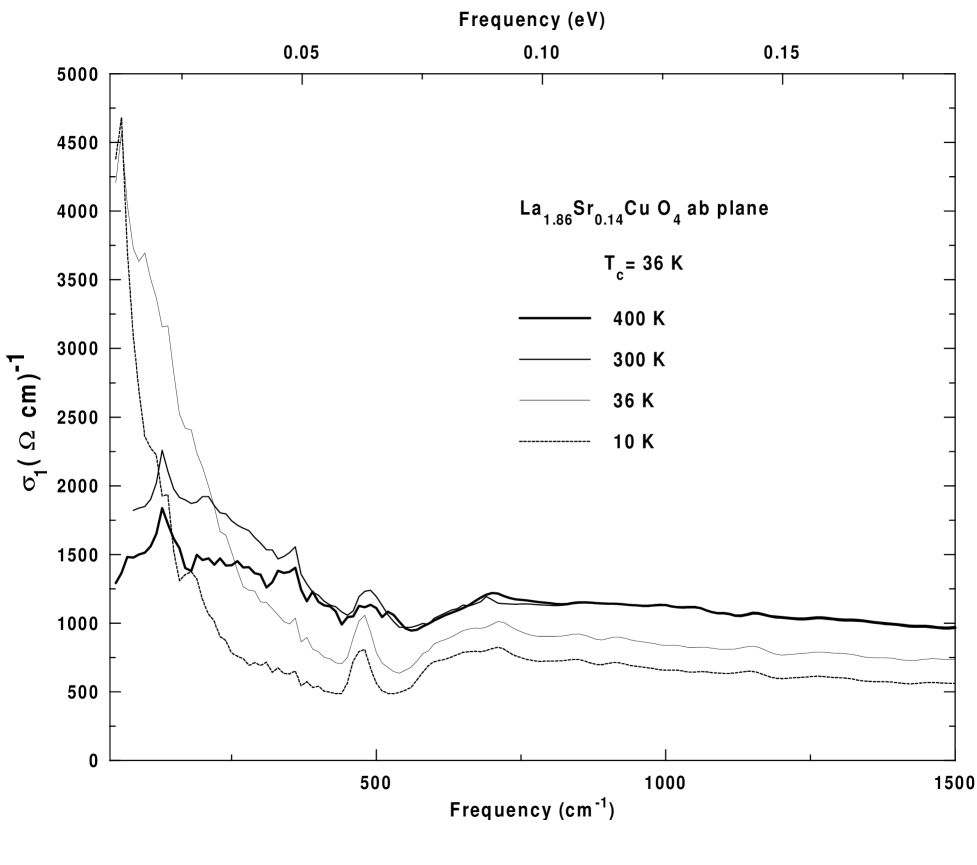
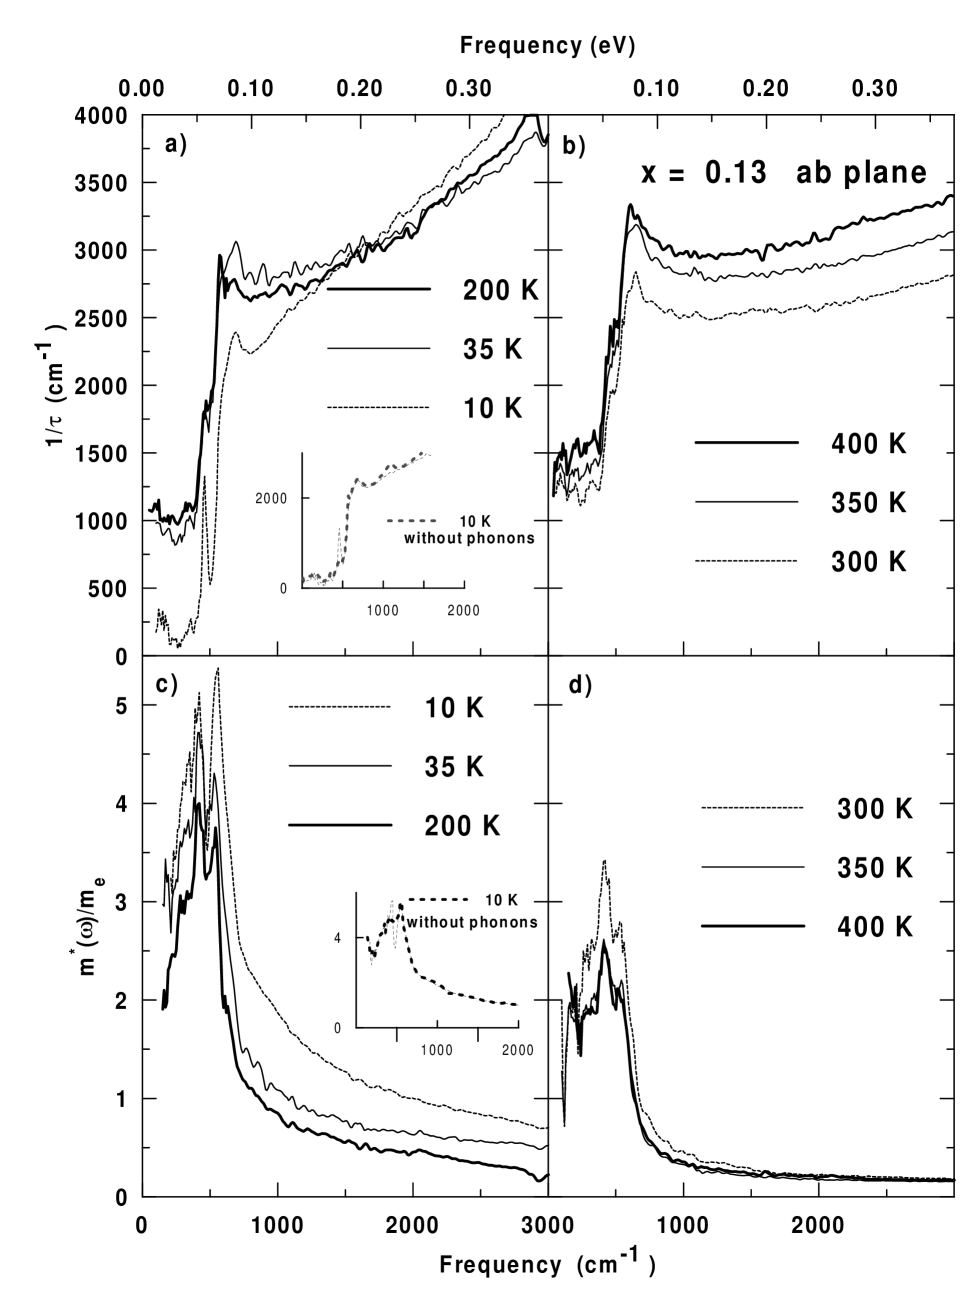
Manifestations of the pseudogap in the -plane conductivity exist as a loss of spectral weight between 700 and 200 cm-1 balanced by increases both below and above this frequency. In both Fig. 6 and Fig. 7 one can see the temperature evolution of the sharp depression in ab-conductivity below 700 cm-1 at temperatures above Tc. A much clearer picture of the pseudogap state can be seen from the effective scattering rate, 1/(,T), calculated from the conductivity using equation (1) which is shown along with the effective mass in Fig. 8 and Fig. 9. The 1/(,T) spectra can conveniently be divided into two regions. In the high frequency region, starting at about 700 cm-1, the scattering rate varies linearly with frequency while in the low frequency region there is a clear suppression of 1/(,T) below this linear trend.[31] The temperature where this suppression first appears serves as a definition of , the onset temperature of the pseudogap state. As the temperature is lowered below this suppression becomes deeper. We find that for underdoped La2-xSrxCuO4 400 K, an order of magnitude higher than the superconducting transition temperature (32 K). This is significantly different from previous results on cuprates where T∗ more or less coincides with Tc near optimal doping.
The temperature dependence above 700 cm-1 is strongly influenced by the level of Sr doping. In the underdoped sample the high frequency scattering rate is nearly temperature independent up to a certain temperature (Fig. 8a and Fig. 9a), which we will call above which a pronounced temperature dependence of 1/(,T) is seen (Fig. 8b and Fig. 9b). In the sample K while in the sample K. In the overdoped samples the scattering rate above 700 cm-1 increases uniformly with temperature[32] at all temperatures suggesting in that limit. This behavior is also seen in other overdoped HTSC.[31]
If one extrapolates the 300 K scattering rates to zero frequency one finds that for the sample the scattering rate cm-1 and for the sample this rate is cm-1. These scattering rates are much higher than what is seen for the higher materials reviewed by Puchkov et al.[31] where at 300 K cm-1 for several families and many doping levels. This high residual scattering differentiates the LSCO material from the other cuprates.
If we call the frequency below which the scattering rate is suppressed the -plane pseudogap cm-1 we find it is clearly bigger than the c-axis pseudogap frequency cm-1
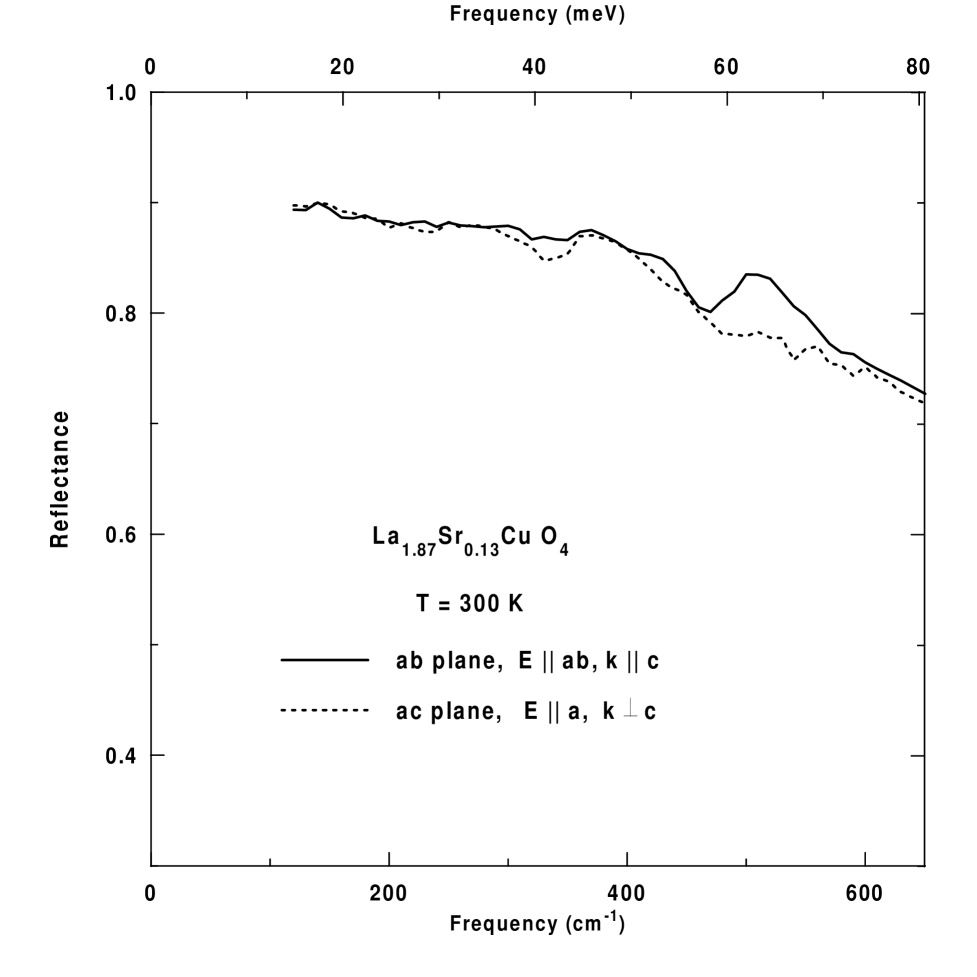
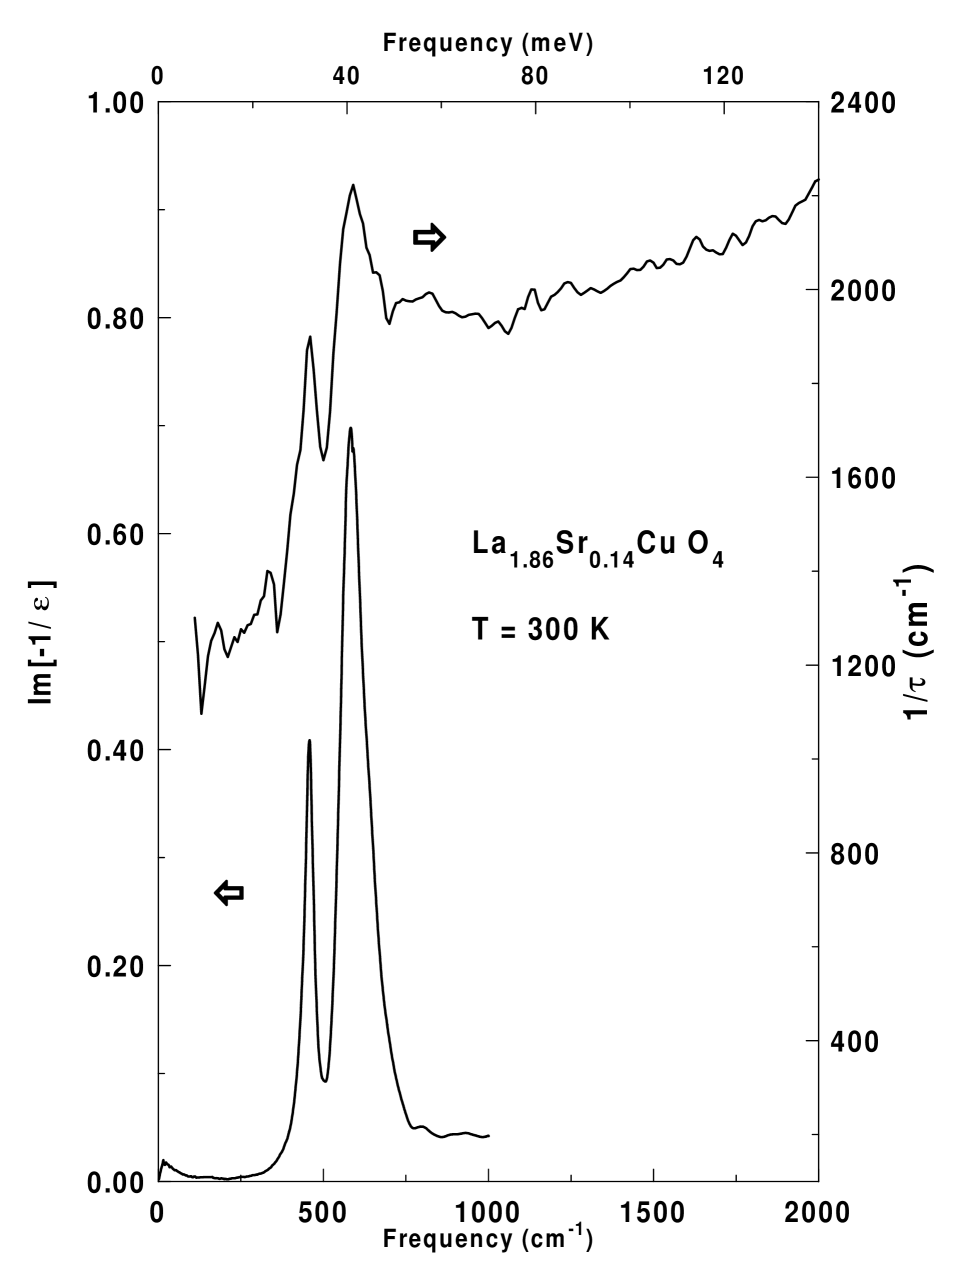
In addition to the pseudogap depth and temperature dependence, several other features of Figures 8 and 9 should be mentioned. The position of the pseudogap remains at 700 cm-1 for all temperatures. There are also several peaks positioned at 500 cm-1 in the scattering rate which complicate the analysis, particularly in the case of the sample with . These peaks have been observed by other groups and have been attributed to polaronic effects.[33, 34] Another possible explanation is the correlation of the ab-plane conductivity with c-axis LO phonons. We did observe the difference in contribution of LO phonons to the ab plane reflectance with different propagation directions, an effect first observed by Reedyk et al.,[35] and also seen in the vs. spectra obtained by Tanner’s group.[18] In Fig. 10 the reflectance with and , is compared with the reflectance with and , with the La1.87Sr0.13CuO4 sample at room temperature. There is an extra feature observed at 500 cm-1 in the spectra with . Further evidence that the c-axis LO phonons couples to ab plane features can be seen in Fig. 11. The comparison between peaks in the effective scattering rate at 450 cm-1 and 580 cm-1 to the peaks in Im(- 1/) shows the same strong correlation seen in many other cuprates.[35]
For completeness we also plot the effective mass of underdoped samples at low temperatures(Fig. 8c) and high temperatures(Fig. 9c,d). As expected, rises to a maximum forming a peak at cm-1. The enhancement of the effective mass in the pseudogap state as well as the upper limit of are similar to what has been previously reported for Y123, Y124 and Bi2212.[31]
Before closing we compare our results with data of Gao et al.[19] on La2-xSrxCuO4+δ films and Quijada et al.[18] on oxygen doped La2CuO4+δ. Our results in the underdoped case are comparable with those of the oxygen doped material, although Quijada et al. did not carry out a frequency dependent scattering rate analysis for their underdoped sample. The film results of Gao et al. are quite different from our findings. The films used in that study had a strontium level that would correspond to optimal doping in crystals. However, the curves deviate markedly from what we observe for slightly under and overdoped samples. The authors performed an extended Drude analysis and found a strongly temperature dependent scattering rate even at low temperatures. This is in sharp contrast to our results which would suggest a very weak temperature dependence in this temperature region. Based on our work, their samples should be in the pseudogap state since they have an value near optimal doping. Comparing these results with other systems, in particular with Tl2202, two factors suggest the possibility that the films may be overdoped. First, their was near 30 K, lower than that expected for optimal doping. Secondly, it is known that the oxygen level in films can vary substantially and in LSCO oxygen can have a major influence on the doping level[36]. On the other hand, we cannot completely rule out the possibility that all the crystal results are affected by the polishing process, and that the films better represent the bulk material. It is clearly important to measure films where the oxygen content is controlled by selective annealing.
In conclusion, the optical data in the far-infrared region, taken on two underdoped single-layered high- superconductors, shows clear evidence of a pseudogap state in both the scattering rate and conductivity along CuO2 planes. This pseudogap state extends to higher temperatures than that observed in the multi-layered underdoped cuprates such as YBCO and BSCO.
The scattering rate is similar for both systems in the pseudogap state. At low frequencies, 700 cm-1, the scattering rates are temperature dependent and change with frequency in a non-linear fashion. Above 700 cm-1 this behavior becomes linear. Within experimental uncertainty the observed high frequency scattering rate of the underdoped sample is not affected by temperature up to certain temperature T∗∗. This temperature is equal to 200 K in case of La1.87Sr0.13CuO4 and 150 K in case of La1.86Sr0.14CuO4 . Above T∗∗ the high frequency scattering rate is temperature dependent. This behavior is identical to the high-frequency effective scattering rate of an overdoped HTSC.[31]
Our findings in the direction perpendicular to the CuO2 planes showed that the depression of the c-axis conductivity is not as prominent as the one found in the two layer HTSC. Nevertheless, the signature of the pseudogap can be seen at the frequencies below 500 cm-1 up to room temperature.
We would like to thank J.D. Garrett for help in aligning the sample and also P.C. Mason, M. Lumsden and B.D. Gaulin for determining the miscut angle of the underdoped LSCO crystal. We also take this opportunity to thank K.C. Irwin and J.G. Naeini for their useful collaboration. This work was supported by the Natural Sciences and Engineering Research Council of Canada and The Canadian Institute for Advanced Research.
REFERENCES
- [1] T. Timusk and B. Statt, Rep. Prog. Phys. (to be published).
- [2] D.S. Marshall, A.G. Loeser, Z.-X. Chen, and D.S. Dessau, Physica C, 263, 208 (1999).
- [3] H.J. Tao, F. Lu, and E.L. Wolf, Physica C 282-287, (1987); Ch. Renner, B. Revaz, J.-Y. Genoud, K. Kadowaki, and O. Fischer, Phys. Rev. Lett. 80, 149, (1998).
- [4] B. Bucher, P. Steiner, J. Karpinski, E. Kaldis, and P. Wachter, Phys. Rev. Lett. 70, 2012, (1993).
- [5] T. Ito, K. Takenaka, and S. Uchida, Phys. Rev. Lett. 70, 3995, (1993).
- [6] B. Batlogg, H.Y. Hwang, H. Takagi, R.J. Cava, H.L. Kao, and J. Kuo, Physica C, 235-240, 130 (1994).
- [7] D.N. Basov, R. Liang, B. Dabrowski, D.A. Bonn, W.N. Hardy, and T. Timusk, Phys. Rev. Lett., 77, 4090 (1996).
- [8] A.V. Puchkov, P. Fournier, D.N. Basov, T. Timusk, A. Kapitulnik, and N.N. Kolesnikov, Phys. Rev. Lett., 77, 3212 (1996).
- [9] A.V. Puchkov, P. Fournier, T. Timusk, and N.N. Kolesnikov, Phys. Rev. Lett., 77, 1853 (1996).
- [10] A.J. Millis and H. Monien, Phys. Rev. Lett., 70, 2810 (1993).
- [11] T.E. Mason, G. Aeppli, and H.A. Mook, Phys. Rev. Lett., 68, 1414 (1992).
- [12] S. Uchida, I. Ido, H. Takagi, T. Arima, Y. Tokura, and S. Tajima, Phys. Rev. B 43, 7942 (1991).
- [13] H.Y. Hwang, B. Batlogg, H. Tagaki, H.L. Kao, J. Kwo, R.J. Cava, and J.J. Krajewski, Phys. Rev. Lett.,72, 2636 (1994).
- [14] S.K. Tolpygo, J.-Y. Lin, M. Girvich, S.Y. Hou, and Julia M. Phillips, Phys. Rev. B, 53, 12454 (1996).
- [15] C.C. Homes, T. Timusk, R. Liang, D.A. Bonn, and W.N. Hardy, Phys. Rev. Lett., 71, 1645 (1993).
- [16] D.N. Basov, R. Liang, B. Dabrowski, D.A. Bonn and W.N. Hardy, T. Timusk, Phys. Rev.B, 52, R13141 (1995).
- [17] S. Uchida, K. Tamasaky, and S. Tajima, Phys. Rev.B, 53, 14558 (1996).
- [18] M.A. Quijada, D.B. Tanner, F.C. Chou, D.C. Johnston and S.-W. Cheong, Phys. Rev. B, 52, 15485 (1995).
- [19] F. Gao, D.B. Romero, B.D. Tanner, J. Talvacchio, and M.G. Forrester, Phys. Rev.B, 47, 1036 (1993).
- [20] W. Gtze and P. Wolfle, Phys. Rev.B, 6, 1226 (1972).
- [21] P.B. Allen, Phys. Rev.B, 3,305 (1971).
- [22] A. Gold, S.J. Allen, B.A. Wilson and D.C. Tsui, Phys. Rev.B, 25, 3519 (1982).
- [23] S.-W. Cheng, G. Aeppli, T.E. Mason, H. Mook, S.M. Hayden, P.C. Canfield, Z. Fisk, K.N. Clausen, and J.L. Martinez, Phys. Rev. Lett., 67, 1791 (1991).
- [24] T. Kimura, K. Kishio, T. Kobayashi, Y. Nakayama, N. Motohira, K. Kitazawa, and K. Yamafuji, Physica C(Amsterdam), 192, 247 (1992).
- [25] J. Orenstein and D.H. Rapkine, Phys. Rev. Lett., 60, 968 (1988).
- [26] S. Tajima, S. Uchida, S. Ishibashi, T. Ido and H. Takagi, T. Arima and Y. Tokura, Physica C, 168, 117 (1990).
- [27] H. Takagi, B. Batlogg, H.L. Kao, J. Kwo, R.J. Cava, J.J. Krajewski, and W.F. Peck, Jr., Phys. Rev. Lett., 69, 2975 (1992).
- [28] D.B. Tanner and T. Timusk, in Physical Properties of High Temperature Superconductors I, edited by D.M. Ginsberg (word Scientific, Singapure, 1992), p.363.
- [29] G. Aeppli, R.J. Cava, E.J. Ansaldo, J.H. Brewer, S.R. Kreitzman, G.M. Luke, D.R. Noakes, and R.F. Kiefl, Phys. Rev. B, 35, 7129 (1987).
- [30] C.C. Homes, T.Timusk, R. Liang, D.A. Bonn, and W.H. Hardy, Physica C, 254, 265-280, (1995).
- [31] A.V. Puchkov, D.N. Basov, and T. Timusk, J. Phys.: Condens. Matter,8, 10049 (1996).
- [32] T. Startseva, T. Timusk, M. Okuya, T. Kimura, and K. Kishio, to be published.
- [33] Y. Yagil and E.K.H Salje, Physica C, 235-140, 1143 (1994).
- [34] G.A. Thomas, D.H. Rapkine, S.L. Cooper, S.-W. Cheong, A.S. Cooper, L.S. Schneemeyer, and J.V. Waszczak, Phys. Rev. B, 45, 2474 (1992).
- [35] M. Reedyk, T. Timusk, Phys. Rev. Lett., 69, 2705 (1992)
- [36] H. Zhang, H. Sato, and G.L. Liedl, Physica C 234, 185, (1994).
- [37] T. Timusk, D.N. Basov, C.C Homes, A.V. Puchkov, and M. Reedyk, Journ. of Superconductivity, 8, 437 (1995).
- [38] K. Tamasaku, T. Itoh, H. Takagi, and S. Uchida, Phys. Rev. Lett., 72, 3088 (1994)
- [39] P.A. Lee and N. Nagaosa, Phys. Rev. B, 46, 5621 (1992).
- [40] V.J. Emery and S.A. Kivelson, Phys. Rev. Lett., 74, 3253 (1995).
- [41] J.W. Loram, K.A. Mirza, J.R. Cooper, and W.Y. Liang, Phys. Rev. Lett., 71, 1740 (1993).