Magnetic field independence of the spin gap in
A dominant feature of optimally and underdoped cuprates is the appearance of a pseudo gap in the normal state excitation spectrum. The microscopic mechanism which is responsible remains a mystery. A number of scenarios for explaining the pseudo-gap have been proposed (see Ref. [2] for a recent review). However no calculations of the consequences of a large applied field for the pseudo-gap have been published. The high magnetic field behavior of the pseudo-gap provides additional experimental characterization of the pseudo-gap which is crucial for differentiating between various pictures.
We report very high accuracy measurements of the magnetic field dependence of the 63Cu spin lattice relaxation rate in near optimally doped . Our measurements demonstrate, in sharp contrast with previous work,[3, 4, 5, 6, 7] that there is no magnetic field dependence to in . This result has three important ramifications. Although the magnetic fields we apply shift down by as much as 8 K, the onset of pseudo gap effects does not shift down in temperature. Hence the pseudo gap is unrelated to superconducting fluctuations, even in near-optimally doped where the gap behavior appears just above . The onset of the pseudo-gap is very rapid, clearly demonstrating that its magnitude is temperature dependent, opening very rapidly near 110 K. Finally, the absence of any field effect indicates a relatively large energy scale for the gap mechanism. If dynamical pairing correlations or pre-formed pairs are involved, the length scales must be very short.
The 63Cu NMR spin lattice relaxation rate reveals the spin part of pseudo-gap behavior, the “spin gap.” In underdoped YBa2Cu3O6.6, famously exhibits a broad maximum in the vicinity of room temperature and then decreases as T approaches from above. In optimally doped (data shown in Figure 1) the maximum occurs at , and commences a quite steep descent as T is lowered towards , though the magnitude and onset temperature of the effect seem to have a significant dependence on doping level even for samples with the same .[8] The steepness of the downturn of in enables a sensitive measurement.
The core experimental finding of this work is presented in Figure 1, which shows, for magnetic fields of 0, 8.8, and 14.8 Tesla, the 63Cu spin lattice relaxation rate vs. temperature. All data shown in Figure 1 are normal state measurements, with temperatures greater than .
The results of Figure 1 contrast sharply with previous measurements. For example, Carretta et al.[4, 5] have found that increasing magnetic field from 0 to 6 Tesla results in a decrease in by some 20, for temperatures just above . They ascribe the decrease to the field suppression of phase sensitive Maki-Thompson effects and conclude that their findings support s-wave pairing. Borsa et al.[3] observe similar behavior but suspect a field effect upon antiferromagnetic fluctuations as the mechanism. In contrast, Mitrovic et al.[6, 7] have probed indirectly through effects upon the T2
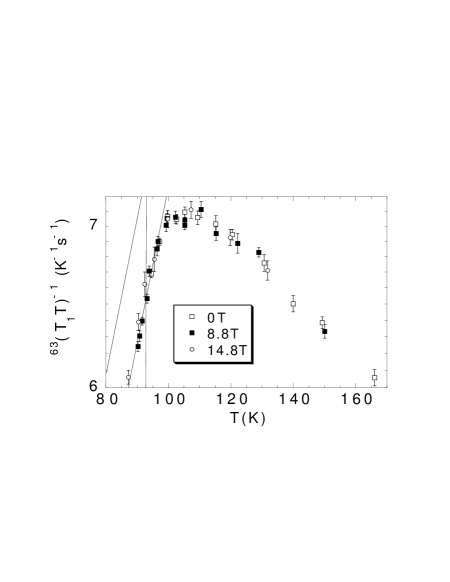
of 17O[9], and find that as the field is increased from 2 to 24 Tesla the rate increases by some 18. Note that the field dependencies of 10-20 observed in all of these previous measurements are approximately the same as the entire vertical scale of Figure 1.
Now, we shall describe experimental procedures, focusing on possibly significant differences with previous work. Then we shall discuss inferences which can be drawn from the results.
Our measurements were carried out on powder samples aligned in epoxy with the crystallite c axes parallel. These samples were extensively characterized in earlier studies[10]. For all measurements the magnetic field is applied along the sample c axis. The sample was prepared using the procedure described in Ref. [11]. Figure 2 shows the high frequency 65Cu (3/2,1/2) satellite transition lineshape, with a full width at half maximum of kHz. One important feature of Figure 2 is that the lineshape is not symmetric– there is essentially no intensity at frequencies much greater than the line position of 136.7 MHz, but at lower frequencies there is a significant “background” intensity. This kind of behavior for Cu NMR in aligned powder samples is well understood: in a perfectly aligned powder sample there would be background intensity neither above nor below the satellite transition. The source of this background intensity, then, is the crystallites which for whatever reason are not perfectly aligned. Considering both the plane and chain 63,65Cu, and the full interaction between the nucleus and the local electric field gradient tensor, a misaligned crystallite in an 8.8T field can contribute NMR intensity anywhere in the range from 69.1 to 136.7 MHz. However, there can be intensity outside this range.

Furthermore, intensity appearing at the upper (lower) frequency limit derives exclusively from the 65Cu (63Cu) upper (lower) satellite transition with the field parallel to the c axis.
Conventionally Cu spin lattice relaxation has been measured on the central (1/2,-1/2) transition, where one expects that background intensity from misaligned crystallites will be present. Martindale et al.[12], however, have documented that in these circumstances the background intensity can significantly contaminate the signal and reduce the accuracy of the relaxation measurement. For this reason, the measurements reported here have been performed on satellite transitions having the highest (or lowest) frequency which can be present. For the 14.8T measurements we used the low frequency 63Cu satellite. For the 8.8T measurements we used the high frequency 65Cu satellite of Figure 2, and we plotted in Figure 1 the measured rate multiplied by . Finally, for zero field we used the 63Cu nuclear quadrupole resonance (NQR) transition at 31.5 MHz.
Figure 3 gives measured spin-lattice relaxation recovery curves at T=100K, demonstrating the importance, when making precise measurements, of probing at frequencies not subject to “background” effects. Experimental data are given for 0 T (63Cu NQR), and for both the high frequency 65Cu satellite (3/21/2) and the central (1/2-1/2) 63Cu transition at 8.8 Tesla.
Relaxation measurements were made by first inverting the nuclear spin magnetization at time . The recovery of to its thermal equilibrium value was then monitored, using the CYCLOPS phase cycling sequence to remove the effects of coil ringdown, gain
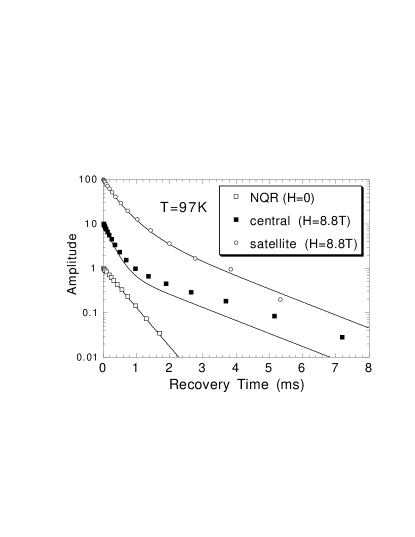
imbalance, and stimulated echoes[13]. 63,65Cu is a four-level, spin 3/2 system, and thus the relaxation curve is expected to be multi-exponential with known coefficients[14] but with only a single adjustable time constant which is to be measured. The expected functional forms for the relaxation of the magnetization in the three situations is given in Table 1. In Figure 3 we use for all three relaxation curves a time constant equal to 1.484 ms, chosen to best fit the NQR data. We see clearly from the figure that while the satellite and NQR measurements follow the expected functional form beautifully, the central transition has a significant deviation. We interpret this effect as arising from “background” intensity, having a different , at the frequency of the central transition. Such an effect may be the source of the apparent field dependence observed in previous measurements, with the exception of those of Refs. [6, 7], which would not be susceptible to this problem. We note that the excellent, single exponential recoveries observed in the NQR experiment rule out any effects due to spectral diffusion.
Now, what can be said about the field dependence of spin gap behavior from Figure 1? For illustration we have included in Figure 1 a straight line which coincides approximately with the fall-off in between and (H). Then for comparison we include the same line, but shifted to lower temperature by an amount equal to 7.8K, which is the expected difference in for fields of 0 and 14.8 Tesla, assuming dHc2/dT=-1.9T/K.[15] One suspects that if the spin gap phenomenon were a superconducting fluctuation effect, then the 14.8T data would be shifted relative to the 0T data by a comparable amount, but that plainly is not the case. In fact, within experimental error the 14.8T data display the same onset temperature as the 0T data, and from a close analysis of the data and error bars we find that any decline in the temperature for onset of spin gap effects over this range of fields must be less than 2K. Thus, we find that application of a field (14.8T) representing a Zeeman energy K, which is of , results in no decrease in onset temperature within an uncertainty of 2%.
Of course, a comparison of this result with quantitative predictions of various theoretical models is necessary, but nevertheless we suspect that this null result will pose a serious challenge to some theories. Possible exceptions include models[16] based around the t-J model, which call for local singlet pairing with an energy scale governed
| Transition | Recovery curve: |
|---|---|
| NQR | |
| central | |
| satellite |
by the exchange coupling J (of order 1000K). We expect there would be a coupling of the applied magnetic field to the orbital motion of pairs[17] formed above , in this case the absence of a field effect will constrain the length scale of the pair. Gaps associated with the formation of ladder-like structures[18] also involve large energy scales and so would not be expected to be sensitive the fields applied here. Finally the antiferromagnetic Fermi liquid based approaches[19] have treated the pseudo-gap effect, but the extent of any magnetic field dependence which would be predicted is not clear.
The fact that the onset temperature for spin gap effects is not shifted down in temperature along with the known suppression of demonstrates that the gap even in optimally doped is not closely tied to the onset of superconductivity, and thus has nothing to do with superconducting fluctuations. The abrupt decrease in then requires a strongly temperature dependent gap. Clearly the gap is not present at high temperatures, rather there must be an abrupt transition near 100K that causes the gap to open. ††margin: * This abrupt opening could reflect the onset of charge ordering into fluctuating structures which would enable the development of a gap[17, 18]. Finally, the mechanism for the gap must have an energy scale large compared to electron spin Zeeman energy scale ( for a 14 Tesla field), even at optimal doping where the gap only appears slightly above 100 K.
To conclude, we find that the spin gap effect in the cuprates is insensitive to magnetic field, with the onset temperature remaining unchanged, within an uncertainty of 2K, by a 14.8T field which suppresses by 8K. These results would appear to call for relatively large energy and short length scales in a scenario involving dynamical pairing correlations or pre-formed pairs. However, in order to make a more definite statement, quantitative predictions from alternative theories will be necessary.
We gratefully acknowledge helpful discussions with P. A. Lee, J. Schmalian, R. Klemm, A. Varlamov, A. Abrikosov, D. G. Stroud, J. Wilkins, and T. R. Lemberger. Work at the Ohio State University was supported by the National Science Foundation Division of Materials Research Contract No. NSF/DMR9357600, by the U. S. Department of Energy, Midwest Superconductivity Consortium, under Contract No. DE-FG02-90ER45427. We gratefully acknowledge the support of the In-House Research Program at the National High Magnetic Field Laboratory and the National High Magnetic Field Laboratory which is supported by the National Science Foundation through Cooperative Agreement No. DMR95-27035 and by the State of Florida.
REFERENCES
- [1] Permanent address: Institute of Solid State Physics; Chernogolovka; 142432 Russia.
- [2] For a review see M. Randeria, preprint, cond-mat/9710223 (1997).
- [3] F. Borsa et al., Phys. Rev. Lett. 68, 698 (1992).
- [4] P. Carretta et al., Phys. Rev. B 54, 9682 (1996).
- [5] P. Carretta et al., Il Nuovo Cimento 19D, 1131 (1997).
- [6] V. F. Mitrovic et al., Bull. Am. Phys. Soc. 43, 966 (1998).
- [7] V. F. Mitrovic et al., preprint (1998).
- [8] J. A. Martindale and P. C. Hammel, Phil. Mag. 74, 573 (1996).
- [9] C. H. Recchia et al., Phys. Rev. Lett. 78, 3543 (1997).
- [10] J.A. Martindale, P.C. Hammel, W.L. Hults and J.L. Smith, Phys. Rev. B 57, 11769 (1998).
- [11] J. L. Smith et al., Guidance and Control Information and Analysis Center, Report No. PR-89-02, p. 11 (1989).
- [12] J. A. Martindale et al., Phys. Rev. B 50, 13 645 (1994).
- [13] D. I. Hoult and R. E. Richards, Proc. R. Soc. Lond. A. 344, 311 (1975).
- [14] Albert Narath, Phys. Rev. 162, 320 (1967).
- [15] U. Welp et al., Phys. Rev. Lett. 62, 1908 (1989).
- [16] X. G. Wen and P. A. Lee, Phys. Rev. Lett. 76, 503 (1996).
- [17] V. J. Emery, S. A. Kivelson, O. Zachar, Phys. Rev. B 56, 6120 (1997).
- [18] S. R. White, D. J. Scalapino, Phys. Rev. Lett. 80, 1272 (1998).
- [19] J. Schmalian et al., Phys. Rev. Lett. 80, 3839 (1998).