Specific Heat (1.2–108 K) and Thermal Expansion (4.4–297 K) Measurements of the 3 Heavy Fermion Compound LiV2O4
Abstract
Specific heat measurements of the heavy fermion normal-spinel structure compound LiV2O4 were carried out using a heat-pulse calorimeter over the temperature range from 1.2 to 108 K. The electronic specific heat of LiV2O4 is extracted from the data using the lattice contribution obtained for LiTi2O4, a superconductor with = 11.8 K. The electronic specific heat coefficient of LiV2O4 is found to be 0.42 and 0.43 J/mol K2 at K for two different high magnetic purity samples, respectively. decreases rapidly with increasing temperature from 4 to 30 K and then decreases much more slowly from 0.13 J/mol K2 at 30 K to 0.08 J/mol K2 at 108 K. The of the first of the above two LiV2O4 samples is compared with theoretical predictions for the spin Kondo model, a generic Fermi liquid model, and an antiferromagnetically coupled quantum-disordered metal. Each of these theories can adequately describe the dependence of in the Fermi liquid regime at low ( 1–10 K) temperatures, consistently yielding a large extrapolated = 428(3) mJ/mol K2. However, none of these theories describes from K to 108 K. Our data are also in severe disagreement with the magnetic specific heat of the spin Heisenberg model, calculated above K for the V sublattice of the spinel structure. Thermal expansion measurements of LiV2O4 were carried out from 4.4 to 297 K using a differential capacitance dilatometer. Strong increases in the thermal expansion coefficient and Grüneisen parameter are found below K, confirming the results of Chmaissem et al. [Phys. Rev. Lett. 79, 4866 (1997)] obtained using neutron diffraction. We estimate , which is intermediate between those of conventional metals and -electron heavy fermion compounds.
pacs:
PACS numbers: 71.28.+d, 75.20.Hr, 75.40.-s, 75.40.CxI Introduction
Heavy fermion (HF) and related intermediate valence (IV) behaviors are ubiquitous in metallic -electron systems containing lanthanide or actinide () atoms with unstable valence.[1] The HF materials are typically intermetallic compounds containing Ce, Yb or U ions and are characterized at the lowest temperatures by a large and nearly -independent spin susceptibility cm3/(mol ), and an extraordinarly large nearly -independent electronic specific heat coefficient J/(mol ) K2, where and is the electronic contribution to the measured specific heat at constant pressure . Large quasiparticle effective masses of –1000 electron masses have been inferred from for the HF compounds and smaller values for the IV materials. The normalized ratio of to , the Sommerfeld–Wilson ratio[2] , is on the order of unity in HF and IV materials as in conventional metals, and is given by , where is Boltzmann’s constant and is the effective magnetic moment of the Fermi liquid quasiparticles. For quasiparticles with (effective) spin , one obtains
| (1) |
where is the -factor of the quasiparticles and is the Bohr magneton. Since in many of the HF and IV compounds, and at low temperatures are both probing the same low-energy heavy quasiparticle spin excitations. With increasing in the heaviest-mass systems, crosses over to local-moment behavior and decreases rapidly, on a temperature scale of –30 K.
Heavy fermion behaviors are not expected for -electron compounds because of the much larger spatial extent of orbitals than of orbitals and the resulting stronger hybridization with conduction electron states. Recently, however, in collaboration with other researchers, we have documented HF behaviors, characteristic of those of the heaviest mass -electron HF systems, in the metallic[3] transition metal oxide compound LiV2O4 using ,[4] ,[4, 5] 7Li and 51V NMR,[4, 6] muon spin relaxation (SR),[4, 7] and 4–295 K crystallography[4, 5, 8] measurements. Independent crystallography and measurements[9, 10] and NMR measurements[10, 11, 12] were reported nearly simultaneously by other groups, with similar results. LiV2O4 has the face-centered-cubic normal-spinel structure (space group ),[13] and is formally a system. The Li atoms occupy tetrahedral holes and the V atoms octahedral holes in a nearly cubic-close-packed oxygen sublattice, designated as Li[V2]O4. The is extraordinarily large for a transition metal compound, J/mol K2, decreasing rapidly with to J/mol K2 at 30 K.[4] As discussed extensively in Refs. [4] and [5], from –100 K to 400 K, shows a Curie-Weiss-like [] behavior corresponding to antiferromagnetically coupled ( to K) vanadium local magnetic moments with and , but static magnetic ordering does not occur above 0.02 K in magnetically pure LiV2O4, and superconductivity is not observed above 0.01 K.
To our knowledge, in addition to LiV2O4 the only other stoichiometric transition metal spinel-structure oxide which is metallic to low temperatures is the normal-spinel compound LiTi2O4.[14, 15, 16, 17] In contrast to LiV2O4, this compound becomes superconducting at K (Refs. [14, 18]) and has a comparatively -independent and small from up to 300 K. [14, 19, 20, 21] The resistivity of thin films at 15 K is (4.3–8.8) cm.[22] The spinel system Li1+xTi2-xO4 with cation occupancy Li[LixTi2-x]O4 exists from to ;[14, 15, 17] for ,[23] the oxidation state of the Ti is and the compound is a nonmagnetic insulator. A zero-temperature superconductor-insulator transition occurs at –0.2.[14, 19, 20]
In this paper, we report the details of our measurements on LiV2O4 and of the data analysis and theoretical modeling. We have now obtained data to 108 K, which significantly extends our previous high-temperature limit of 78 K.[4] We also present complementary linear thermal expansion measurements on this compound from 4.4 to 297 K. We will assume that can be separated into the sum of electronic and lattice contributions,
| (3) |
| (4) |
In Ref. [4], we reported measurements up to 108 K on Li4/3Ti5/3O4 which were used to estimate in LiV2O4 so that could be extracted according to Eq. (3). In the present work, we report up to 108 K for LiTi2O4, compare these data with those for Li4/3Ti5/3O4, and obtain therefrom what we believe to be a more reliable estimate of for LiV2O4. The experimental details are given in Sec. II. An overview of our data for LiV2O4, LiTi2O4 and Li4/3Ti5/3O4 is given in Sec. III A. Detailed analyses of the data for the Li1+xTi2-xO4 compounds and comparisons with literature data are given in Sec. III B, in which we also estimate for LiV2O4. The and electronic entropy for LiV2O4 are derived in Sec. III C. The measurements are presented in Sec. IV and compared with the results and lattice parameter data versus temperature obtained from neutron diffraction measurements by Chmaissem et al.[8] From the combined and measurements on the same sample, we derive the Grüneisen parameter from 4.4 to 108 K and estimate
| Sample No. | 2 | 3 | 4A | 5 | 6 |
|---|---|---|---|---|---|
| Lattice parameter (Å) | 8.23997(4) | 8.24100(15) | 8.24705(29) | 8.24347(25) | 8.23854(11) |
| Impurity phase | V2O3 | pure | V2O3 | V2O3 | V3O5 |
| (Str) (mol %) | 1.83 | 1.71 | 2.20 | ||
| (Mag) (mol %) | 0.22(1) | 0.118(2) | 0.77(2) | 0.472(8) | 0.0113(6) |
the value at . Theoretical modeling of the data for LiV2O4 is given in Sec. V. Since the electrical resistivity data for single crystals of LiV2O4 indicate metallic behavior from 4 K to 450 K,[3] we first discuss the Fermi liquid description of this compound and derive the effective mass and other parameters for the current carriers at low temperatures in Sec. V A. This is followed by a more general discussion of the FL theory and its application to LiV2O4 at low . In Sec. V B we compare the predictions of Zülicke and Millis[24] for a quantum-disordered antiferromagnetically coupled metal with our results for LiV2O4. The isolated impurity Kondo model predicts FL behavior at low temperatures and impurity local moment behavior at high temperatures. Precise predictions for the and have been made for this model, and we compare our data with those predictions in Sec. V C. In Sec. V D we consider a local moment model in which the magnetic specific heat of the sublattice of the []O4 spinel structure for spins and per ion is given by a high-temperature series expansion and the predictions compared with the data for LiV2O4. A summary and concluding remarks are given in Sec. VI. Unless otherwise noted, a “mol” refers to a mole of formula units.
II Experimental Details
Polycrystalline LiV2O4 samples were prepared using conventional ceramic techniques described in detail elsewhere, where detailed sample characterizations and magnetic susceptibility results and analyses are also given.[5] A few of these results relevant to the present measurements, analyses and modeling are given in Table I.
Polycrystalline LiTi2O4 and Li4/3Ti5/3O4 samples were synthesized using solid-state reaction techniques.[14] TiO2 (Johnson Matthey, 99.99 %) was dried under a pure oxygen stream at 900 ∘C before use. This was mixed with Li2CO3 (Alfa, 99.999 %) in an appropriate ratio to produce either Li4/3Ti5/3O4 or a precursor “LiTiO2.5” for LiTi2O4. The mixtures were then pressed into pellets and heated at 670 ∘C in an oxygen atomosphere for 1 day. The weight loss due to release of CO2 was within 0.04 wt.% of the theoretical value for LiTiO2.5. However, for Li4/3Ti5/3O4 additional firings at higher temperatures (up to 800 ∘C), after being reground and repelletized, were necessary. LiTi2O4 was prepared by heating
pressed pellets of a ground mixture of the LiTiO2.5 precursor and Ti2O3 in an evacuated and sealed quartz tube at 700 ∘C for one week and then air-cooling. The Ti2O3 was prepared by heating a mixture of TiO2 and titanium metal powder (Johnson Matthey) at 1000 ∘C for one week in an evacuated and sealed quartz tube.
Powder x-ray diffraction data were obtained using a Rigaku diffractometer (Cu K radiation) with a curved graphite crystal monochromator. Rietveld refinements of the data were carried out using the program “Rietan 97 (‘beta’ version)”.[25] The x-ray data for our sample of Li4/3Ti5/3O4 showed a nearly pure spinel phase with a trace of TiO2 (rutile) impurity phase. The two-phase refinement, assuming the cation distribution Li[Li1/3Ti5/3]O4, yielded the lattice and oxygen parameters of the spinel phase 8.3589(3) Å and 0.2625(3), respectively; the concentration of TiO2 impurity phase was determined to be 1.3 mol%. The LiTi2O4 sample was nearly a single-phase spinel structure but with a trace of Ti2O3 impurity. A two-phase Rietveld refinement assuming the normal-spinel cation distribution yielded the spinel phase parameters = 8.4033(4) Å and = 0.2628(8), and the Ti2O3 impurity phase concentration mol%. Our crystal data are compared with those of Cava et al.[16] and Dalton et al.[17] in Table II.
The measurements were done on samples from four different batches of LiV2O4 using a conventional heat-pulse calorimeter, with Apeizon-N grease providing contact between the sample and the copper tray.[26] Additional data were obtained up to 108 K on 0.88 g of the isostructural nonmagnetic insulator spinel compound Li4/3Ti5/3O4, containing only maximally oxidized Ti+4, and 3.09 g of the isostructural superconductor LiTi2O4 to obtain an estimate of the background lattice contribution. A basic limitation on the accuracy of these data, except for LiV2O4 below 15 K, was the relatively small (and sample-dependent) ratios of the heat capacities of the samples to those associated with the tray (the
| Ref. | |||||||
| (Å) | (K) | ||||||
| LiTi2O4 | |||||||
| 8.4033(4) | 0.2628(8) | 700(20) | This Work | ||||
| 8.4033(1) | 0.26275(5) | [16] | |||||
| 8.41134(1) | 0.26260(4) | [17] | |||||
| 8.407 | 685 | [28] | |||||
| 535 | [20] | ||||||
| 0.26290(6) (300 K) | [21] | ||||||
| 0.26261(5) (6 K) | [21] | ||||||
| Li4/3Ti5/3O4 | |||||||
| 8.3589(3) | 0.2625(3) | 725(20) | This Work | ||||
| 8.35685(2) | 0.26263(3) | [17] | |||||
| 8.359 | 610 | [28] | |||||
| 518 | [20] |
“addenda”). For LiV2O4 sample 6, this ratio decreased from 40 near 1 K to 1.0 at 15 K to a relatively constant 0.2 above 40 K. For the superconducting LiTi2O4 sample, this ratio was 0.45 just above ( K), and increased to 0.65 at 108 K. For the nonmagnetic insulator Li4/3Ti5/3O4 sample, this ratio varied from 0.03 to 0.12 to 0.2 at 8, 20 and 108 K, respectively. These factors are important since small (%) systematic uncertainties in the addenda heat capacity can have differing effects on the measured for the different samples, even though the precision of the raw heat capacity measurements (as determined from fits to the data) is better than 0.25%.
III Specific Heat Measurements
A Overview
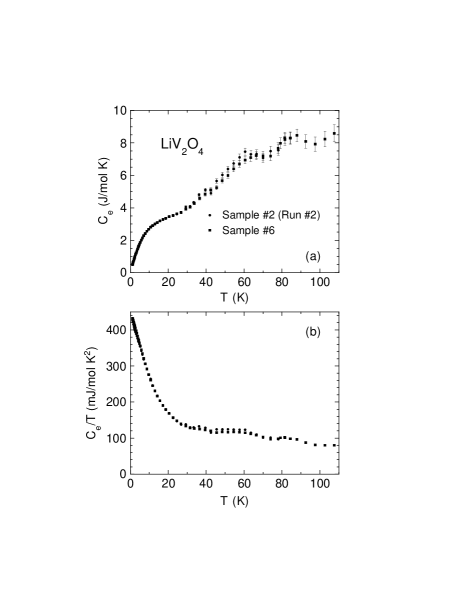
An overview of our measurements on LiV2O4 sample 2, run 2 (1.26–78 K), sample 6 (1.16–108 K), and LiTi2O4 and Li4/3Ti5/3O4 up to 108 K, is shown in plots of and in Figs. 1(a) and (b), respectively. Our data for LiTi2O4 and Li4/3Ti5/3O4 are generally in agreement with those of McCallum et al.[28] which cover the range up to K. For LiTi2O4 above K (see below) and for Li4/3Ti5/3O4, one sees from Fig. 1(a) a smooth monotonic increase in up to 108 K. From Fig. 1(b), the of the nonmagnetic insulator Li4/3Ti5/3O4 is smaller than that of metallic LiTi2O4 up to K, is larger up to K and then becomes smaller again at higher temperatures. Since in Li4/3Ti5/3O4 and in LiTi2O4 cannot be negative,

it follows from Eq. (3) that and hence the lattice dynamics are significantly different in LiTi2O4 compared with Li4/3Ti5/3O4. The data for LiV2O4 in Fig. 1(b) are shifted upwards from the data for the Ti spinels, with a strong upturn in below K. These data indicate a very large . Comparison of for LiV2O4 and LiTi2O4 at the higher temperatures K indicate that a large persists in LiV2O4 up to our maximum measurement temperature of 108 K. In the following, we begin our analyses with the data for the Li1+xTi2-xO4 compounds because we extract a lattice specific heat from these materials as a reference for LiV2O4.
B Li1+xTi2-xO4
In the present paper, our data for LiTi2O4 and Li4/3Ti5/3O4 are most important for determining the lattice contribution to of LiV2O4. At low temperatures, the of a conventional nonmagnetic, nonsuperconducting material is[29]
| (5) |
where and . From Eqs. (I), the first term in Eq. (5) is , the second corresponds to the ideal Debye lattice contribution and the following terms represent dispersion in the lattice properties.[30] The zero-temperature Debye temperature is given by[29] , where is the number of atoms per formula unit ( here) and is in units of mJ/mol K4. Equation (5) suggests the commonly used plot of versus to obtain the parameters and . Unfortunately, the very small heat capacity of the small Li4/3Ti5/3O4 sample and the occurrence of the superconducting transition in LiTi2O4 at 11.8 K complicate the use of this relation to determine for these presumably similar materials below K.
The of LiTi2O4 below 20 K is plotted versus and in Fig. 2(a) and (b), respectively. The superconducting transition at K is seen to be pronounced and very sharp ( K). The dotted line extrapolation of the normal state ( K) data to shown in Figs. 1(b) and 2 uses Eq. (5), equality of the superconducting and normal state entropy at , mJ/mol K, and continuity considerations with above , from which we also obtain estimates of and . Although we cannot rule out a -dependence of , we assume here that is independent of . While [(2) mJ/mol K2] appears to be quite insensitive to addenda uncertainties, [(20) K] is less well-defined. Our value for is slightly smaller than the values of 20–22 mJ/mol K2 reported earlier for LiTi2O4,[20, 28] as shown in Table II. From the measured superconducting state mJ/mol K and normal state mJ/mol K, the discontinuity in at is given by mJ/mol K2, yielding which is slightly larger than previous estimates in Table II. According to Eqs. (I), the lattice specific heat of LiTi2O4 above is given by .
The derived for LiTi2O4 below 12 K is consistent within experimental uncertainties with the measured of Li4/3Ti5/3O4 in the same temperature range after accounting for the formula weight difference. The low- for Li4/3Ti5/3O4 is plotted in Figs. 2. The (20) K found for Li4/3Ti5/3O4 is slightly larger than that for LiTi2O4, as expected. A polynomial fit to the of Li4/3Ti5/3O4 above 12 K is shown by the dashed curves in Figs. 2. The uncertainties in the data and analyses for the Ti spinels have little effect on the analyses of for LiV2O4 in the following Sec. III C, since as Figs. 1 suggest, for LiV2O4 is small compared to of this compound at low temperatures.
To quantify the difference above K between the of LiTi2O4 and Li4/3Ti5/3O4 noted above in

Sec. III A, in Fig. 3 is plotted the difference between the measured of Li4/3Ti5/3O4 and of LiTi2O4. The shape of in Fig. 3 below is similar to that of an Einstein specific heat, but such a specific heat saturates to the Dulong-Petit limit at high and does not decrease with as the data do above 40 K. These observations suggest that intermediate-energy phonon modes in LiTi2O4 at some energy split in Li4/3Ti5/3O4 into higher () and lower () energy modes, resulting from the Li-Ti atomic disorder on the octahedral sites in Li4/3Ti5/3O4 and/or from the difference in the metallic character of the two compounds. Following this interpretation, we model the data in Fig. 3 as the difference between the Einstein heat capacities of two Einstein modes with Einstein temperatures of and (neglecting the modes at high energy ), given by[29]
| (6) |
where is the molar gas constant, = 7 atoms/formula unit and and are the fractions of the total number of phonon modes shifted to and away from , respectively. A reasonable fit of the data by Eq. (6) was obtained with the parameters = 0.012, K, and K; the fit is shown as the solid curve in Fig. 3. The model then predicts that a fraction of the modes removed at energy are moved to an energy .

An alternative parametrization of the experimental data can be given in terms of the specific heat of a two-level system, described by the Schottky function[29]
| (7) |
where is the atomic fraction of two-level sites, and are respectively the degeneracies of the ground and excited levels and is the energy level splitting in temperature units. Fitting Eq. (7) to the data in Fig. 3, we find , and K. The fit is shown as the dashed curve in Fig. 3. The accuracy of our data is not sufficient to discriminate between the applicability of the Einstein and Schottky descriptions.
C LiV2O4
Specific heat data were obtained for samples from four batches of LiV2O4. Our first experiment was carried out on sample 2 (run 1) with mass 5 g. The was found to be so large at low (the first indication of heavy fermion behavior in this compound from these measurements) that the large thermal diffusivity limited our measurements to the 2.23–7.94 K temperature range. A smaller piece of sample 2 (0.48 g) was then measured (run 2) from 1.16 to 78.1 K. Data for samples from two additional batches (sample 3 of mass 0.63 g, 1.17–29.3 K, and sample 4A of mass 0.49 g, 1.16–39.5 K) were also obtained. Subsequent to the theoretical modeling of the data for sample 3 described below in Sec. V, we obtained a complete data set from 1.14 to 108 K for sample 6 with mass 1.1 g from a fourth batch. A power series fit to the data for sample 6 is shown as solid curves in Fig. 1.
We have seen above that of LiTi2O4 is significantly different from that of Li4/3Ti5/3O4. Since LiV2O4 is a metallic normal-spinel compound with cation occupancies Li[V2]O4 as in Li[Ti2]O4, and since the formula weight of metallic LiTi2O4 is much closer to that of LiV2O4 than is that of the insulator Li4/3Ti5/3O4, we expect that the lattice dynamics and of LiV2O4 are much better approximated by those of LiTi2O4 than of Li4/3Ti5/3O4. Additionally, more precise and accurate data were obtained for LiTi2O4 as compared to Li4/3Ti5/3O4 because of the factor of three larger mass of the former compound measured than of the latter. Therefore, we will assume in the following that the of LiV2O4 from 0–108 K is identical with that given above for LiTi2O4. We do not attempt to correct for the influence of the small formula weight difference of 3.5% between these two compounds on ; this difference would only be expected to shift the Debye temperature by %, which is on the order of the accuracy of the high temperature data. The of LiV2O4 is then obtained using Eq. (3).
The data for samples 2 (run 2) and 6 of LiV2O4, obtained using Eqs. (I), are shown up to 108 K in plots of and vs. in Figs. 4(a) and (b), respectively. An expanded plot of below 9 K for LiV2O4 is shown in Fig. 5(a), where data for sample 2 (run 1) and sample 3 are also included. The data for samples 2 and 3 are seen to be in agreement to within about 1%. However, there is a small positive curvature in the data for sample 2 below K, contrary to the small negative curvature for sample 3. This difference is interpreted to reflect the influence of the larger magnetic defect concentration present in sample 2 as compared with that in sample 3, see Table I.[5] Therefore, we believe that the data for sample 3 more closely reflect the intrinsic behavior of defect-free LiV2O4 compared to the data for sample 2 and all fits to of LiV2O4 below 30 K by theoretical models to be presented in Sec. V below are therefore done using the data for sample 3. As seen
in Fig. 5(a), the data for sample 6 lie somewhat higher than the data for the other samples below about 4 K but are comparable with those for the other samples at higher temperatures. This difference is also reflected in the magnetic susceptibilities ,[5] where for sample 6 is found to be slightly larger than those of other samples.
To obtain extrapolations of the electronic specific heat to , the data in Fig. 5 from 1 to 10 K for samples 3 and 6 were fitted by the polynomial
| (8) |
yielding
| (10) |
| (11) |
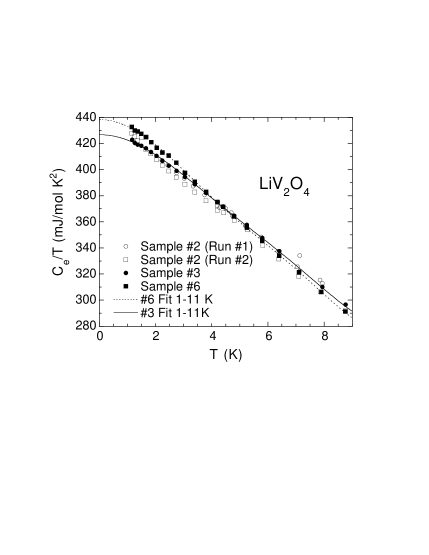
The fits for samples 3 and 6 are respectively shown by solid and dashed curves in Fig. 5. The values are an order of magnitude or more larger than typically obtained for transition metal compounds, and are about 23 times larger than found above for LiTi2O4.
The -dependent electronic entropy of LiV2O4 was obtained by integrating the data for sample 6 in Fig. 4(b) with ; the extrapolation of the vs. fit for sample 6 in Fig. 5 from K to yields an additional entropy of 1.16 K) = 0.505 J/mol K. The total is shown up to 108 K in Fig. 6; these data are nearly identical with those of sample 2 (run 2) up to the maximum measurement temperature of 78 K for that sample (not shown). The electronic entropy at the higher temperatures is large. For example, if LiV2O4 were to be considered to be a strictly


localized moment system with one spin per V atom, then the maximum electronic (spin) entropy would be 2, which is already reached at about 65 K as shown by comparison of the data with the horizontal dashed line in Fig. 6. Our data for one sample (sample 4A) of LiV2O4 were anomalous. These are shown in Fig. 7 along with those of sample 2 (run 2) for comparison. Contrary to the data for sample 2, the data for sample 4A show a strong upturn below K and a peak at about 29 K. We have previously associated the first type of effect with significant ( mol%) concentrations of paramagnetic defects.[4] Indeed, Table I shows that this sample has by far the highest magnetic impurity concentration of all the samples we studied in detail. The anomalous peak at 29 K might be inferred to be due to small amounts of impurity phases (see Table I). However, the excess entropy under the peak is rather large, ln(2). We also note that the height of the anomaly above “background” is at least an order of magnitude larger than would be anticipated due to a few percent of V4O7 or V5O9 impurity phases which order antiferromagnetically with Néel temperatures of 33.3 and 28.8 K, respectively.[31] It is possible that the 29 K anomaly is intrinsic to the spinel phase in this particular sample; in such a case Li-V antisite disorder and/or other types of crystalline defects would evidently be involved. As seen in Table I, this sample has by far the largest room temperature lattice parameter of all the samples listed, which may be a reflection of a slightly different stoichiometry and/or defect distribution or concentration from the other samples. Although these data for sample 4A will not be discussed further in this paper, the origin of the anomaly at 29 K deserves further investigation.

IV Thermal Expansion Measurements
The linear thermal expansion coefficient of LiV2O4 sample 6 was measured between 4.4 and 297 K. Figure 8(a) shows and over this range, and Fig. 8(b) shows expanded plots below 50 K. At 297 K, K-1, which may be compared with the value K-1 obtained for LiTi2O4 between 293 and 1073 K from x-ray diffraction measurements.[32] Upon cooling from 297 K to about 25 K, of LiV2O4 decreases as is typical of conventional metals.[30] However, nearly becomes negative with decreasing at about 23 K. This trend is preempted upon further cooling below K, where both and exhibit strong increases. The strong increase in below 20 K was first observed by Chmaissem et al.[8] from high-resolution neutron diffraction data, which motivated the present measurements. We fitted our data by a polynomial in over three contiguous temperature ranges and obtained the fit shown as the solid curves in Figs. 8. From the fit, we obtain

.
Shown as the solid curve in Fig. 9(a) is the linear thermal dilation expressed in terms of the lattice parameter , where we have used our polynomial fit to the data to compute and have set Å. The determined from the neutron diffraction measurements by Chmaissem et al.[8] for a different sample (sample 5) are plotted as the filled circles in Fig. 9. The two data sets are in overall agreement, and both indicate a strong decrease in with decreasing below 20 K. There are differences in detail between the two measurements at the lower temperatures as illustrated below 100 K in Fig. 9(b), suggesting a possible sample dependence.
Our measurement of for sample 6 is compared with the measured for the same sample in Fig. 10(a), where the temperature dependences of these two quantities are seen to be similar. We infer that the strong increase in with decreasing below K is an electronic effect associated with the crossover to heavy fermion behavior. For most materials,

the volume thermal expansivity and are related through the dimensionless Grüneisen parameter , with[30]
| (12) |
where is the adiabatic bulk modulus and is the molar volume. In this model, where is a characteristic energy of the system. If independent contributions to can be identified, as assumed in Eq. (3), a relation similar to Eq. (3) exists for the thermal expansivity, with an independent for each contribution
| (13) |
where is understood to refer to measurements under constant pressure. For a metal, , and . Here is the mass-enhanced quasiparticle density of states at the Fermi energy and the volume dependence of the electron-phonon interaction is neglected. Thus is a direct measure of the volume dependence of . For a free electron gas, . For most real metals ; e.g., (Cu), 1.6 (Au), 1.6 (V), (Sr), (Ba), 2.22 (Pd).[30]
We have computed for LiV2O4 from Eq. (12) using the polynomial fit to our data for sample 6 and using the experimental data in Fig. 8 for this sample. The molar volume of LiV2O4 at low temperatures is given in Table III. The bulk modulus is assumed to be GPa, which is the range found[33] for the similar compounds Fe2O3, Fe3O4, FeTiO3, MgO, TiO2 (rutile), the spinel prototype MgAl2O4,[34] and MgTi2O5.[35] The obtained by substituting these values into Eq. (12) is plotted versus temperature as the filled circles in Fig. 10(b). Interpolation and extrapolation of is obtained from the polynomial fit to the data, shown by the solid curve in Fig. 10(b). From Fig. 10(b), at 108 K and decreases slowly with decreasing , reaching a minimum of about 0.1 at 23 K. With further decrease in , shows a dramatic increase and we obtain an extrapolated . A plot of vs. obtained from our experimental data points is linear for K2, and extrapolates to 11.50 at , to be compared with 11.45 as calculated from the smooth fitted relations for and ; this justifies the (long) extrapolation of to . An accurate determination of the magnitude of must await the results of bulk modulus measurements on LiV2O4. Our estimated is intermediate between those of conventional nonmagnetic metals and those of -electron heavy fermion compounds such as UPt3 (), UBe13 (34) and CeCu6 (57) with and 1.67 J/mol K2, respectively.[36]
From the expression[29] relating to the specific heat at constant volume , and using our data and the estimate for above, of LiV2O4 can be considered identical with our measured to within both the precision and accuracy of our measurements up to 108 K.
V Theoretical Modeling: Electronic Specific Heat of LiV2O4
A Single-Band Spin Fermi Liquid
As mentioned in Sec. I, the high-temperature of LiV2O4 indicated a vanadium local moment with spin and . In the low-temperature Fermi liquid regime, for a Fermi liquid consisting of a single parabolic band of quasiparticles with and conduction electrons per unit volume ,[37, 38, 39, 40] the Fermi wavevector of LiV2O4 assuming conduction electrons/V atom is given in Table III. In terms of the mass-enhanced density of states at the Fermi energy for both spin directions , the (neglecting electron-phonon interactions) and are given by
| (15) |
| (16) |
where is a Landau Fermi liquid parameter and is the Stoner enhancement factor. The Fermi liquid scattering amplitudes are related to the Landau parameters by . The superscripts “a” and “s” refer to spin-asymmetric and spin-symmetric interactions, respectively. Using Eq. (15) and the value in Table III, the experimental value of for LiV2O4 in Eq. (10) yields the effective mass , Fermi velocity , , Fermi temperature and for LiV2O4 given in Table III. From Eqs. (1) and (V A), the Wilson ratio[2] is expressed as
| (17) |
Substituting the experimental –2 K) = 0.0100(2) cm3/mol (Ref. [4]) and in Eq. (10) for LiV2O4 into Eq. (1) assuming yields
| (18) |
This value is in the range of those found for many conventional as well as -electron HF and IV compounds.[1] The value in Eq. (18) yields from Eq. (17)
| (19) |
In Fermi liquid theory, a temperature dependence is often computed for at low temperatures having the form[38, 39, 40]
| Property | |
|---|---|
| FW | |
| (12 K) | |
| (20) |
where is given by Eq. (15) and is a scaling or cutoff temperature. Engelbrecht and Bedell[41] considered a model of a single-band Fermi liquid with the microscopic constraint of a local (momentum-independent) self-energy, where the interactions are mediated by the quasiparticles themselves (in the small momentum-transfer limit). They find that only -wave () Fermi-liquid parameters can be nonzero and that the coefficient in Eq. (20) is
| (21) |
where and . Within their model, neither ferromagnetism nor phase-separation can occur. For , the only potential instability is towards antiferromagnetism and/or a metal-insulator transition; in this case they find . For , a BCS superconducting state is possible and . The value of for LiV2O4 in Eq. (19) is within the former range of this theory.
Auerbach and Levin[42] and Millis et al.[43, 44] formulated a Fermi-liquid theory of heavy electron compounds at low temperatures on the basis of a microscopic Kondo lattice model. The large enhancement of arises from the spin entropy of the electrons on the magnetic-ion sites (i.e., spin fluctuations).[43] The Wilson ratio is and a contribution to is found. The origin of this latter term is not ferromagnetic spin fluctuations (“paramagnons”),[42] but is rather electron density fluctuations and the screened long-range Coulomb interaction.[43] The coefficient of the term found by Millis[43] is , which may be rewritten as
| (22) |
Using the values mJ/mol K2 [Eq. (10)], = 288 K (Table III) and in Eq. (19), Eqs. (21) and (22) respectively predict
| (23) |
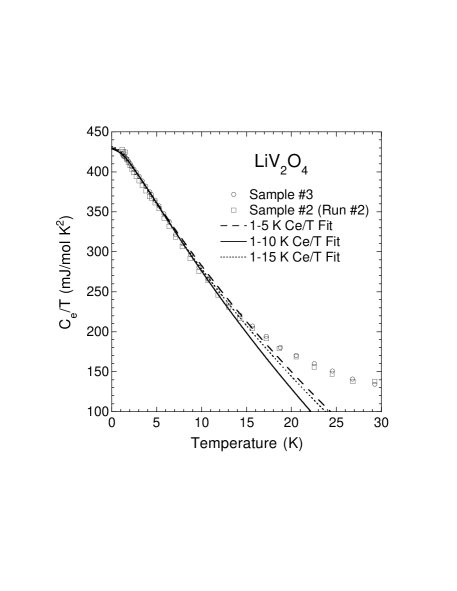
We have fitted our low-temperature data for LiV2O4 sample 3 by the expression
| (24) |
initially with . The fit parameters and were found to depend on the fitting temperature range above 1 K chosen, and are sensitive to the precision of the data. The parameters obtained for 1–3 K and 1–5 K fits were nearly the same, but changed when the upper
limit to the fitting range was increased to 10 and 15 K. The fits for the 1–5 K, 1–10 K and 1–15 K fitting ranges are shown in Fig. 11, along with the data for sample 2 (run 2). As a check on the fitting parameters, we have also fitted the data for sample 3 by Eq. (24) with as an additional fitting parameter. The fit for the 1–30 K range is plotted as the solid curve in Fig. 11. Since the fits for the smaller ranges with and for the larger ranges with should give the most reliable parameters, we infer from the fit parameters for all ranges that the most likely values of the parameters and their error bars are
| (25) |
The parameters in Eq. (25) are very similar to those obtained using the same type of fit to data for the heavy fermion superconductor UPt3 with K,[45] for which –450 mJ/mol K2 and mJ/mol K4.[45, 46] Our and values for LiV2O4 (288 K and 181, Table III) are also respectively very similar to those of UPt3 (289 K and 178).[39]
The experimental value in Eq. (25) is a factor of larger than and larger than predicted in Eq. (23). A similar large [–] discrepancy was found by Millis for the coefficient for UPt3.[43] As explained by Millis,[43] the large discrepancy between his theory and experiment may arise because the calculations are for a single parabolic band, an assumption which may not be applicable to the real materials. However, he viewed the most likely reason to be that his calculations omit some effect important to the thermodynamics such as antiferromagnetic spin fluctuations.[43] In this context, it is possible that the magnitude of predicted by one of the above two theories is correct, but that terms higher order in not calculated by the theory are present which mask the contribution over the temperature ranges of the fits;[47] in this case the large experimental value would be an artifact of force-fitting the data by Eq. (24). Indeed, we found that the fits were unstable, i.e., depended on the temperature range fitted (cf. Fig. 11). In addition, the applicability of the theory of Millis[43] to LiV2O4 is cast into doubt by the prediction that the Knight shift at a nucleus of an atom within the conduction electron sea (not a “magnetic” atom) “would be of the same order of magnitude as in a normal metal, and would not show the mass enhancement found in .”[44] In fact, the Knight shift of the 7Li nucleus in LiV2O4 for –10 K is about 0.14%,[4, 6, 10, 11] which is about 6000 times larger than the magnitude (0.00024%) found[17] at room temperature for the 7Li Knight shift in LiTi2O4. Similarly, the 7Li 1/ from 1.5 to 4 K in the highest-purity LiV2O4 samples is about 2.25 s-1K-1,[4, 6] which is about 6000 times larger than the value of s-1K-1 found[17] at 160 K in LiTi2O4, where is the 7Li nuclear spin-lattice relaxation time.
B Quantum-Disordered Antiferromagnetically Coupled Metal
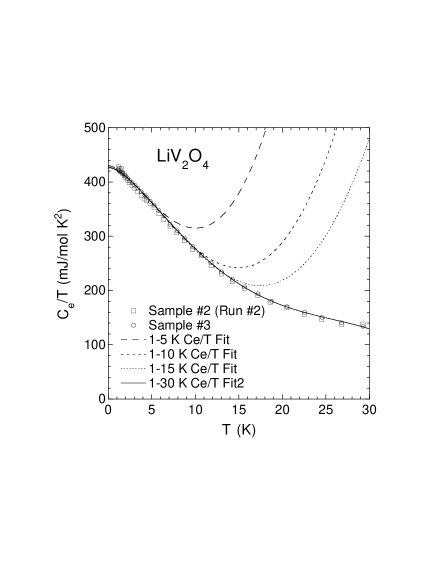
The antiferromagnetic (AF) Weiss temperature of LiV2O4 from measurements is –60 K, yet the pure system exhibits neither static antiferromagnetic AF nor spin-glass order above 0.02 K.[4, 5] A possible explanation is that the ground state is disordered due to quantum fluctuations. We consider here the predictions for of one such theory. A universal contribution to the temperature dependence of of a three-dimensional (3D) metal with a control parameter near that required for a zero-temperature AF to quantum-disordered phase transition, corresponding to dynamical exponent , was calculated by Zülicke and Millis,[24] which modifies the Fermi liquid prediction in Eq. (20). Upon increasing from in the quantum-disordered region, the system crosses over from the quantum disordered to a classical regime. The same scaling theory predicts that the low- spin susceptibility is given by , where the constant is not determined by the theory.[48]
Zülicke and Millis found the electronic specific heat to be given by[24]
| (27) |
| (28) |
Here, is the (nonuniversal) electronic specific heat coefficent at in the usual Fermi liquid theory [ above], is a characteristic temperature and is the number of components of the bosonic order parameter which represents the ordering field: = 3, 2, 1 for Heisenberg, XY and Ising symmetries, respectively. The number is not determined by the scaling theory but is expected to be on the order of the number of conduction electrons per formula unit; thus for LiV2O4, we expect . We have defined such that . The variable is expected to be temperature dependent, but this temperature dependence cannot be evaluated without ascertaining the value of an additional parameter in the theory from, e.g., measurements of the pressure dependence of ; here, we will assume to be a constant.[49] From Eq. (27), the value of in the absence of quantum fluctuations is reduced by these fluctuations, and the measured is
| (29) |
We fitted our vs. data for LiV2O4 sample 3 by Eqs. (V B), assuming = 3. The fitting parameters were and ; the value is then obtained from Eq. (29). The 1–20 K and larger ranges did not give acceptable fits. The fits for the 1–5, 1–10 and 1–15 K fitting ranges are shown in Fig. 12. From these fits, we infer the parameters and errors
| (30) | |||||
| (31) |
Within the context of this theory, quantum fluctuations reduce the observed by about a factor of two compared with the value in the absence of these fluctuations. The value of is close to the nominally expected value mentioned above. The relatively large value of indicates that LiV2O4 is not very close to the quantum-critical point, and therefore predicts that long-range AF order will not be induced by small changes in external conditions (pressure) or composition. The former prediction cannot be checked yet because the required experiments under pressure have not yet been done. The latter expectation is consistent with the data available so far. Magnetic defect concentrations on the order of 1% do induce static magnetic ordering below K, but this ordering is evidently of the short-range spin-glass type.[4] Substitution of Zn for Li in Li1-xZnxV2O4 induces spin-glass ordering for but long-range AF ordering does not occur until .[9] Finally, two caveats regarding the fits and discussion in this section are in order. The first is that (unknown) corrections of order and to the theory of Zülicke and Millis[24] exist but have not been included in the prediction in Eqs. (V B); incorporating these corrections may alter the parameters obtained from fits to experimental data.[50] The second caveat is that the theory
may need modification for compounds such as LiV2O4 in which geometric frustration for AF ordering exists in the structure.[50]
C Spin-1/2 Kondo Model
Calculations of the impurity spin susceptibility and/or impurity electronic contribution to the specific heat for the Kondo model were carried out by Wilson[2] and others[51, 52, 53, 54, 55, 56, 57, 58] using different techniques. Both and depend only on the scaling parameter , where is the Kondo temperature (here, we use Wilson’s definition[2]). The impurity is predicted to be Curie-Weiss-like at temperatures high compared with , and to level out at a constant high value for due to the formation of a singlet ground state.
In the limit of zero temperature, one has[55]
| (32) |
where is the number of impurity spins. The Wilson number[2] is given by[59, 60]
| (33) |
where is Euler’s constant. Setting , Avogadro’s number, one obtains from Eqs. (32) and (33) the electronic specific heat coefficient per mole of impurities
| (34) |
To characterize the dependence of , we utilized accurate numerical calculations using the Bethe ansatz by Jerez and Andrei.[58] The calculated shows a maximum, max[, which occurs at . The calculations were fitted by the expressions
| (36) |
| (37) |
| (38) |
where and the coefficients for the two types of fits are given in Table IV for the fitting range . Equations (V C) incorporate the zero-temperature limit in Eqs. (32–34). The maximum (rms) deviations of the fit from the calculated numerical data are 0.011% (0.0035%) for and 0.031% (0.021%) for but then progressively deteriorate to 0.48% (0.14%) in the region . The corresponding deviations for the fit are 0.0044% (0.00091%), 0.031% (0.017%) and 5.1% (1.6%).
The experimental data for LiV2O4 sample 3 were least-square fitted from 1.2 to 5 K by Eqs. (37) and (38),[61] yielding , and then from Eq. (34):
| (39) |
The fit is shown in Fig. 13 as the solid curves. For comparison, also shown in Fig. 13(a) are the predictions for = 25 K and 28 K. Unfortunately, despite the good agreement of the theory for K with our measured at low , the Kondo model prediction for qualitatively disagrees with the observed temperature dependence at low .[5] This difficulty of self-consistently fitting the and data is a problem
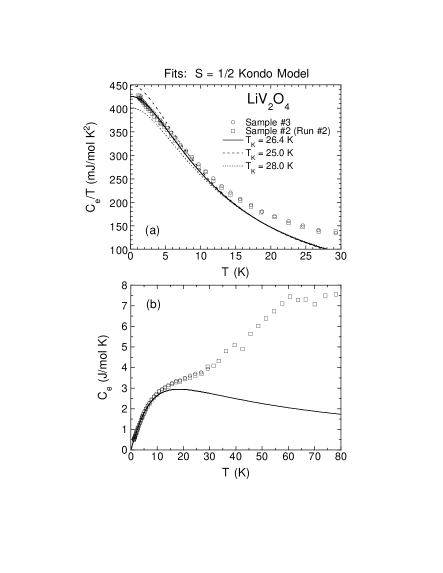
we have encountered in all our attempts so far to fit our data for both measurements over any extended temperature range by existing theory (see also the next section).
D Local Moment High-Temperature Description
As discussed above, the data for LiV2O4 suggest that at high temperatures a local moment description in which the moments are antiferromagnetically coupled with Weiss temperature to K may be applicable.[4, 5] Accordingly, we have calculated the magnetic specific heat for localized moments on the octahedral (B) sublattice of the A[B2]O4 spinel structure assuming nearest-neighbor AF Heisenberg interactions using the general high-temperature series expansion (HTSE) results of Rushbrooke and Wood.[62] The Hamiltonian is , where the sum is over all exchange bonds and the exchange constant corresponds to AF interactions. In terms of this Hamiltonian, , where is the coordination number for the B sublattice of the spinel structure. The above range of then gives –40 K assuming . The general HTSE prediction is[62]
| (40) |
where and the coefficients depend in general on the spin-lattice structure in addition to . The coefficients for the B sublattice of the spinel structure with and up to the maximum available are given in Table V. The predictions for versus scaled-temperature with = 5 are very similar for and . A comparison

| 1 | 13/6 | |
| 2 | 3 | |
| 3 | 715/36 | |
| 4 | 4421/324 | |
| 5 | 670741/6480 |
of the predictions for = 0 to 5 indicates that the calculations for are accurate for , a range with a lower limit slightly above the temperatures at which broad maxima occur.
In Fig. 14 the HTSE prediction of for the B sublattice of the spinel structure with , and K in Eq. (40) is compared with the experimental data for LiV2O4 samples 2 and 6 from Fig. 4(a). The HTSE has a much lower magnitude than the data and a qualitatively different temperature dependence. From Eq. (40), changing just scales the curve with . Thus the local moment picture is in severe disagreement with our measurements, despite the excellent agreement between the corresponding HTSE prediction and the data from 50–100 K to 400 K.[4, 5]
VI Summary and Concluding Remarks
We have presented data for LiV2O4 sample 6 which extend our previous measurements[4] up to 108 K. We have also presented data for the isostructural superconducting compound LiTi2O4 ( K) up to 108 K which complement our earlier data[4] on the isostructural nonmagnetic insulator Li4/3Ti5/3O4. We concluded here that the lattice contribution to for LiTi2O4 provides the most reliable estimate of the for LiV2O4, and we then extracted the electronic contribution to of LiV2O4 from 1.2 to 108 K. Inelastic neutron scattering measurements of the lattice dynamics and spin excitations would be very useful in interpreting the measurements presented here. It will be important to determine whether or not there exist significant differences in the lattice dynamics of LiV2O4 and LiTi2O4; in our data analyses and modeling, we have assumed that these compounds are similar in this respect.
For two high-magnetic-purity LiV2O4 samples 3 and 6, the electronic specific heat coefficients were found to be K and 0.43 J/mole K2, respectively. To our knowledge, these values are significantly larger than previously reported for any metallic transition metal compound.[63] For LiTi2O4, we found J/mole K2. of LiV2O4 decreases rapidly with increasing temperature from 4 to 30 K and then decreases much more slowly from a value of 0.13 J/mol K2 at 30 K to 0.08 J/mol K2 at 108 K. Even these latter two values are exceptionally large for a metallic -electron compound. The temperature dependences of , , the low- resistivity and the 7Li NMR properties are remarkably similar to those of the heaviest mass -electron heavy fermion compounds.[1] In a plot of versus , the data point for LiV2O4 sits amid the cluster formed by the -electron heavy fermion and intermediate valent compounds as shown in Fig. 15,[64] where several

data for elemental metals, the A-15 superconductor V3Si ( K),[65, 66] and superconducting and/or metallic -metal oxides LiTi2O4 ( K),[14] Sr2RuO4 ( = 1 K),[67] and (V0.95TiO3,[68] are also included for comparison.
From our theoretical modeling in Sec. V, Fermi liquid models and the Kondo model (with a Fermi liquid ground state) are capable of describing our data for LiV2O4 from 1 K up to K, although the magnitudes of the derived parameters remain to be understood theoretically. The localized moment model in Sec. V D failed both qualitatively and quantitatively to describe the data. None of the models we used can account for the additional contribution to at higher temperatures, from K up to our high temperature limit of 108 K, which appears to be distinct from the contribution beginning at much lower and could arise from orbital,[69, 70] charge and/or spin[71, 72] excitations. The crystalline electric field and/or the spin-orbit interaction may produce some energy level structure which is thermally accessible within our temperature range.[73] Conventional band structure effects cannot give rise to our results.[74]
As is well-known for conventional metals, the electron-phonon interaction increases by the factor , where is the electron-phonon coupling constant, but does not affect ; i.e., in Eq. (15). One can correct the observed Wilson ratio for electron-phonon interactions by multiplying the observed value by .[75] The electron-phonon interaction is not taken into account in any of the analyses or modeling we have done. This correction would have had a significant quantitative impact on our analyses if we used, e.g. as in LiTi2O4 (Refs. [20, 28]); most previous analyses of the specific heats of other (-electron) HF compounds also did not take the electron-phonon interaction into account.[1]
From our combined specific heat and thermal expansion measurements on the same sample 6 of LiV2O4 from 4.4 to 108 K, we derived the Grüneisen parameter which shows a dramatic enhancement below K as the compound crosses over from the quasilocal moment behavior at high temperatures to the low-temperature Fermi liquid regime, confirming the discovery of Chmaissem et al. from neutron diffraction measurements.[8] Our estimated extrapolated value of the electronic Grüneisen parameter is about 11.4, which is intermediate between values for conventional metals and for -electron heavy fermion compounds. This large value indicates a much stronger dependence of the mass-enhanced density of states on the volume of the system than simply due to the decrease in the Fermi energy with increasing volume as in the quasi-free electron picture. In the -electron HF systems, the large values are thought to arise from a strongly volume dependent hybridization of the -electron orbitals with those of the conduction electrons.[36, 76] In the present case of LiV2O4, the origin of the large is unclear.
It is conceivable that the same mechanism is responsible for the heavy fermion behavior in LiV2O4 as in the -electron heavy fermion systems if one of the 1.5 -electrons/V atom is localized on each V atom due to electron correlation effects and crystalline electric field orbital energy level structure,[77] and if the orbital occupied by the localized electron is hybridized only weakly with the conduction electron states. That such localization can occur in similar systems is supported by calculations for the compound NaTiO2.[78] Additional scenarios for the heavy fermion behavior mechanism(s) are given by Kondo et al.[4, 5] involving the geometric frustration for AF ordering within the V sublattice and/or low-lying coupled dynamical orbital-charge-spin excitations. Further experimental and theoretical investigations of the physical properties of LiV2O4 may thus reveal interesting new physics which may also allow a deeper understanding of the -electron heavy fermion class of materials.
Acknowledgments
We are indebted to F. Izumi for helpful communications regarding the Rietveld analyses and to A. Jerez and N. Andrei for providing high-accuracy numerical values[58] of the magnetic susceptibility and specific heat of the Kondo model. We thank V. Antropov, F. Borsa, O. Chmaissem, J. B. Goodenough, R. J. Gooding, B. N. Harmon, J. D. Jorgensen, M. B. Maple and A. J. Millis for helpful discussions and correspondence, and V. Antropov and B. N. Harmon for communicating to us the results of their unpublished band structure calculations for LiV2O4. Ames Laboratory is operated for the U.S. Department of Energy by Iowa State University under Contract No. W-7405-Eng-82. This work was supported by the Director for Energy Research, Office of Basic Energy Sciences.
REFERENCES
- [1] For reviews, see: G. R. Stewart, Rev. Mod. Phys. 56, 755 (1984); A. C. Hewson, The Kondo Problem to Heavy Fermions (Cambridge University Press, Cambridge, 1993).
- [2] K. G. Wilson, Rev. Mod. Phys. 47, 773 (1975).
- [3] D. B. Rogers, J. L. Gillson, and T. E. Gier, Solid State Commun. 5, 263 (1967).
- [4] S. Kondo, D. C. Johnston, C. A. Swenson, F. Borsa, A. V. Mahajan, L. L. Miller, T. Gu, A. I. Goldman, M. B. Maple, D. A. Gajewski, E. J. Freeman, N. R. Dilley, R. P. Dickey, J. Merrin, K. Kojima, G. M. Luke, Y. J. Uemura, O. Chmaissem, and J. D. Jorgensen, Phys. Rev. Lett. 78, 3729 (1997).
- [5] S. Kondo, D. C. Johnston, and L. L. Miller, unpublished.
- [6] A. V. Mahajan, R. Sala, E. Lee, F. Borsa, S. Kondo, and D. C. Johnston, Phys. Rev. B 57, 8890 (1998).
- [7] J. Merrin, Y. Fudamoto, K. M. Kojima, M. Lardin, G. M. Luke, B. Nachumi, Y. J. Uemura, S. Kondo, and D. C. Johnston, unpublished.
- [8] O. Chmaissem, J. D. Jorgensen, S. Kondo, and D. C. Johnston, Phys. Rev. Lett. 79, 4866 (1997).
- [9] Y. Ueda, N. Fujiwara, and H. Yasuoka, J. Phys. Soc. Jpn. 66, 778 (1997).
- [10] M. Onoda, H. Imai, Y. Amako, and H. Nagasawa, Phys. Rev. B 56, 3760 (1997).
- [11] N. Fujiwara, Y. Ueda, and H. Yasuoka, Physica B 237–238, 59 (1997).
- [12] N. Fujiwara, H. Yasuoka, and Y. Ueda, Phys. Rev. B 57, 3539 (1998).
- [13] B. Reuter and J. Jaskowsky, Angew. Chem. 72, 209 (1960); Ber. Bunsenges. Phys. Chem. 70, 189 (1966).
- [14] D. C. Johnston, J. Low Temp. Phys. 25, 145 (1976).
- [15] A. Deschanvres, B. Raveau, and Z. Sekkal, Mater. Res. Bull. 6, 64 (1971).
- [16] R. J. Cava, D. W. Murphy, S. Zahurak, A. Santoro, and R. S. Roth, J. Solid State Chem. 53, 64 (1984).
- [17] M. Dalton, I. Gameson, A. R. Armstrong, and P. P. Edwards, Physica C 221, 149 (1994).
- [18] D. C. Johnston, H. Prakash, W. H. Zachariasen, and R. Viswanathan, Mater. Res. Bull. 8, 777 (1973).
- [19] M. R. Harrison, P. P. Edwards, and J. B. Goodenough, Phil. Mag. B 52, 679 (1985).
- [20] J. M. Heintz, M. Drillon, R. Kuentzler, Y. Dossmann, J. P. Kappler, O. Durmeyer, and F. Gautier, Z. Phys. B – Condens. Mat. 76, 303 (1989).
- [21] D. P. Tunstall, J. R. M. Todd, S. Arumugam, G. Dai, M. Dalton, and P. P. Edwards, Phys. Rev. B 50, 16 541 (1994).
- [22] T. Inukai, T. Murakami, and T. Inamura, Thin Solid Films 94, 47 (1982).
- [23] F. Bertaut and A. Durif, C. R. Acad. Sci. (Paris) 236, 212 (1953).
- [24] U. Zülicke and A. J. Millis, Phys. Rev. B 51, 8996 (1995).
- [25] F. Izumi, in The Rietveld Method, edited by R. A. Young (Oxford University Press, Oxford, 1993), Ch. 13.
- [26] C. A. Swenson, Phys. Rev. B 53, 3669 (1996).
- [27] C. A. Swenson, in Thermal Expansion of Solids, edited by C. Y. Ho (CINDAS data series on Material properties: v. I-4, American Society of Metals, Ohio, 1998), Ch. 8.
- [28] R. W. McCallum, D. C. Johnston, C. A. Luengo, and M. B. Maple, J. Low Temp. Phys. 25, 177 (1976).
- [29] E. S. R. Gopal, Specific Heats at Low Temperatures (Plenum, New York, 1966).
- [30] For a review, see T. H. K. Barron, J. G. Collins, and G. K. White, Adv. Phys. 29, 609 (1980).
- [31] G. D. Khattak, P. H. Keesom, and S. P. Faile, Phys. Rev. B 18, 6181 (1978).
- [32] U. Roy, K. Petrov, I. Tsolovski, and P. Peshev, Phys. Stat. Sol. (a) 44, K25 (1977).
- [33] F. Birch, in Handbook of Physical Constants, ed. S. P. Clark, Jr., Sec. 7 (Geolog. Soc. Am., New York, 1966), pp. 129–136.
- [34] M. B. Kruger, J. H. Nguyen, W. Caldwell, and R. Jeanloz, Phys. Rev. B 56, 1 (1997).
- [35] R. M. Hazen and H. Yang, Science 277, 1965 (1997).
- [36] For a review, see A. de Visser, J. J. M. Franse, and J. Flouquet, Physica B 161, 324 (1989).
- [37] C. Kittel, Introduction to Solid State Physics, 4th Edition (Wiley, New York, 1971), Ch. 7.
- [38] C. J. Pethick and G. M. Carneiro, Phys. Rev. A 7, 304 (1973).
- [39] C. J. Pethick, D. Pines, K. F. Quader, K. S. Bedell, and G. E. Brown, Phys. Rev. Lett. 57, 1955 (1986).
- [40] G. Baym and C. Pethick, Landau Fermi Liquid Theory (John Wiley & Sons, New York, 1991).
- [41] J. R. Engelbrecht and K. S. Bedell, Phys. Rev. Lett. 74, 4265 (1995).
- [42] A. Auerbach and K. Levin, Phys. Rev. Lett. 57, 877 (1986); Phys. Rev. B 34, 3524 (1986).
- [43] A. J. Millis, Phys. Rev. B 36, 5420 (1987).
- [44] A. J. Millis and P. A. Lee, Phys. Rev. B 35, 3394 (1987).
- [45] G. R. Stewart, Z. Fisk, J. O. Willis, and J. L. Smith, Phys. Rev. Lett. 52, 679 (1984).
- [46] W. Trinkl, U. Weilnhammer, S. Corsépius, T. Schreiner, E.-W. Scheidt, and G. R. Stewart, Phys. Rev. B 54, 1163 (1996).
- [47] A. Ishigaki and T. Moriya, J. Phys. Soc. Jpn. 65, 376 (1996).
- [48] L. B. Ioffe and A. J. Millis, Phys. Rev. B 51, 16 151 (1995).
- [49] In the fit to the specific heat data by this theory in Ref. [4], = constant and were assumed.
- [50] A. J. Millis, private communication (1997).
- [51] H. R. Krishna-murthy, J. W. Wilkins, and K. G. Wilson, Phys. Rev. B 21, 1003 (1980).
- [52] H. R. Krishna-murthy, J. W. Wilkins, and K. G. Wilson, Phys. Rev. B 21, 1044 (1980).
- [53] L. N. Oliveira and J. W. Wilkins, Phys. Rev. Lett. 47, 1553 (1981).
- [54] V. T. Rajan, J. H. Lowenstein, and N. Andrei, Phys. Rev. Lett. 49, 497 (1982).
- [55] V. T. Rajan, Phys. Rev. Lett. 51, 308 (1983).
- [56] H.-U. Desgranges and K. D. Schotte, Phys. Lett. 91A, 240 (1992).
- [57] A. M. Tsvelick and P. B. Wiegmann, Adv. Phys. 32, 453 (1983).
- [58] A. Jerez and N. Andrei (1997), unpublished.
- [59] N. Andrei and J. H. Lowenstein, Phys. Rev. Lett. 46, 356 (1981).
- [60] J. W. Rasul and A. C. Hewson, J. Phys. C: Solid State Phys. 17, 3337 (1984).
- [61] The prediction of Rajan et al.[54, 55] for of the Kondo model was used to fit our low- data in our initial publication,[4] where we used a fit to digitized data from the theoretical plots. The digitized data were parametrized by , where .
- [62] G. S. Rushbrooke and P. J. Wood, Mol. Phys. 1, 257 (1958). Note that the definition of in this paper is a factor of two smaller than ours. We determined the parameters in this paper corresponding to the B sublattice of the A[B2]O4 spinel structure to be .
- [63] R. Ballou, E. Lelièvre-Berna, and B. Fåk, Phys. Rev. Lett. 76, 2125 (1996).
- [64] B. A. Jones et al., Fig. 1 in P. A. Lee, T. M. Rice, J. W. Serene, L. J. Sham, and J. W. Wilkins, Comments Cond. Mat. Phys. 12, 99 (1986).
- [65] A. Junod, J.-L. Staudenmann, J. Muller, and P. Spitzli, J. Low Temp. Phys. 5, 25 (1971).
- [66] J. P. Maita and E. Bucher, Phys. Rev. Lett. 29, 931 (1972).
- [67] Y. Maeno, K. Yoshida, H. Hashimoto, S. Nishizaki, S. Ikeda, M. Nohara, T. Fujita, A. P. Mackenzie, N. E. Hussey, J. G. Bednorz, and F. Lichtenberg, J. Phys. Soc. Jpn. 66, 1405 (1997).
- [68] D. B. McWhan, J. P. Remeika, T. M. Rice, W. F. Brinkman, J. P. Maita, and A. Menth, Phys. Rev. Lett. 27, 941 (1971).
- [69] M. Takigawa, E. T. Ahrens, and Y. Ueda, Phys. Rev. Lett. 76, 283 (1996).
- [70] W. Bao, C. Broholm, G. Aeppli, P. Dai, J. M. Honig, and P. Metcalf, Phys. Rev. Lett. 78, 507 (1997).
- [71] J. B. Silva, W. L. C. Lima, W. C. Oliveira, J. L. N. Mello, L. N. Oliveira, and J. W. Wilkins, Phys. Rev. Lett. 76, 275 (1996).
- [72] N. Andrei and A. Jerez, Phys. Rev. Lett. 74, 4507 (1995).
- [73] R. J. Radwański, (unpublished).
- [74] V. Antropov and B. N. Harmon, (unpublished).
- [75] P. Fulde, J. Keller, and G. Zwicknagl, in Solid State Physics, Vol. 41, edited by H. Ehrenreich and D. Turnbull (Academic Press, San Diego, 1988), pp. 1–150.
- [76] A. S. Edelstein and N. C. Koon, Solid State Commun. 48, 269 (1983); for a review, see P. Thalmeier, J. Magn. Magn. Mater. 76&77, 299 (1988).
- [77] J. B. Goodenough, private communication (1997).
- [78] S. Yu. Ezhov, V. I. Anisimov, H. F. Pen, D. I. Khomskii, and G. A. Sawatzky, Report cond-mat/9712230.