THE STRUCTURE OF THE RIPPLE PHASE IN CHIRAL
AND RACEMIC DMPC MULTIBILAYERS
Kheya Sengupta1***Electronic mail: kheya@rri.ernet.in, V.A. Raghunathan1†††Electronic mail: varaghu@rri.ernet.in and John Katsaras2‡‡‡Electronic mail: KATSARASJ@CP7.AECL.CA
1Raman Research Institute, Bangalore - 560 080, India.
2National Research Council, Steacie Institute of Molecular Sciences, Chalk River Laboratories,
Chalk River, Ontario, K0J 1J0, Canada.
ABSTRACT
We present electron density maps of the ripple phase of chiral and racemic
dimyristoylphosphatidylcholine.
The structures of the two systems are found to be identical within
experimental errors,
thus unambiguously showing that the chirality of the lipid
molecules does not influence the structure of this phase.
PACS: 61.30.Eb, 61.10.-i, 64.70.Md
I. INTRODUCTION
Lipid water mixtures show a variety of phases as a function of temperature
and humidity, including a number of diverse lamellar phases [1-3].
These
lamellar phases are of interest because they serve as model systems for
biological membranes. Further, phase transitions in these systems is
also a topic of current interest [2].
In the high temperature Lα phase, which
has the symmetry of a smectic-A liquid crystal, the
hydrocarbon chains are molten and exhibit no in-plane ordering.
In the low temperature
L phase, the chains are in the all-trans
conformation and are ordered on a
two-dimensional lattice
[1,4]. In addition to these two lamellar
phases, some phospholipids
also exhibit an intermediate ripple or P phase,
characterized by periodic one-dimensional height modulation of the bilayer
[1-3, 5-7]. In this phase, the conformation of the chains has not yet been
unambiguously determined, but from x-ray data it is clear that most of the
hydrocarbon chains are ordered in the same manner as in the
L phase.
A complete theory of the ripple phase that explains all the experimental
observations is yet to be formulated. Recently, Lubensky and MacKintosh
[8,9] have proposed a Landau theory that describes phase transitions
between the Lα, P and
L
phases in chiral and achiral bilayers.
In the case of achiral
bilayers, this model predicts the existence of two distinct symmetric
ripple phases in
addition to a square lattice phase. When the system is chiral, one of these
two phases becomes asymmetric [10]. Thus, according to this
phenomenological model,
achiral bilayers can exhibit only symmetric ripples, while both symmetric
and asymmetric ripples can occur in chiral bilayers.
In order to test the predictions put forth by Lubensky and
MacKintosh [8] concerning the influence of molecular chirality on the
structure of the ripple phase, Katsaras and Raghunathan [11] carried out
x-ray diffraction experiments on aligned films of chiral (l) and
racemic (dl) dimyristoylphosphatidylcholine (DMPC) bilayers. They
found that under similar experimental conditions, the diffraction patterns
from the two systems were practically indistinguishable. Moreover,
both the
systems were found to have an oblique unit cell, indicating the presence of
asymmetric ripples.
The observation of asymmetric ripples in the racemate can still be
reconciled with the predictions of the Lubensky-MacKintosh model if the
d and l enantiomers within each layer phase separate into chiral
domains. To investigate this possibility, Katsaras et al. performed
calorimetric measurements on mixtures of l-dipalmitoylphosphatidylcholine
having perdeuterated hydrocarbon chains (l-DPPC-d62) and
d-DPPC [12]. They found the data consistent with a binary system
whose components exhibit complete mutual solid solubility. This
suggests that the asymmetric
ripples seen in racemic DMPC multibilayers are not the result
of the formation of chiral domains due to phase separation.
The structural features that can be obtained directly from a diffraction
pattern are the following:
the wavelength of the ripples
(), the average separation between the bilayers
() and the angle () between the two axes of the
unit cell. The values of these three parameters
are found to be comparable in chiral and racemic DMPC bilayers
under similar experimental conditions [11].
In order to check whether the
detailed shape of the ripples in these two systems are also similar, we
have now calculated the electron density
profiles of the ripple phase of l and dl-DMPC.
In this brief report we present the results of these calculations.
All the structural features of the ripple
phase in the two systems are found to be identical within experimental
errors. This confirms the conclusion of ref. [11] that molecular chirality
does not play any significant role in determining the structure of the
ripple phase.
II. EXPERIMENT
The sample was deposited on a curved glass surface from a concentrated
lipid/methanol solution to obtain a stack of bilayers
oriented parallel to the surface. However, the ripple direction does
not get fixed by this procedure. The result is a sample that is aligned
along the layer normal but is a powder in the plane of the bilayer.
The temperature was controlled to within 0.5oC and the
relative humidity was
maintained at 982 . Further experimental details are to be
found in ref. [11].
III. DATA ANALYSIS
We have applied geometrical corrections to the observed intensities relevant
to our system, taking into account the fact that the sample is a powder
in two dimensions and oriented in one. We have ignored absorption corrections
as the thickness of the sample was not accurately known. However,
by assuming reasonable values of the sample thickness,
we
have confirmed that
the electron density profiles are not
significantly affected by these
corrections [13].
In order to calculate the electron density map, the phase of each Bragg
reflection must be
determined. As the structure possesses a center of symmetry, the phase can
only take values of either 0 or .
To determine the phases of the reflections we have adopted the procedure
developed by Sun et. al. [14].
The electron density function (x,z) is described as the
convolution of a ripple contour function C(x,z) and the transbilayer
electron density profile Tψ(x,z). Here is the direction of the ripple
wavevector and is the direction of the average layer normal.
C(x,z) = (z-u(x)), where u(x) describes the ripple profile and is taken to
have the form of a sawtooth with peak-to-peak amplitude A. is the
projection of the longer arm of the sawtooth on the x-axis. Tψ(x,z) gives
the electron density at any point (x,z) along a straight line, which
makes an angle with the z-axis. The electron density in the methylene
region of the bilayer is close to that of water and is taken as zero.
Tψ(x,z) is modeled as consisting of two delta functions with positive
coefficient of magnitude ,
corresponding to the headgroup regions seperated by a
distance L, and a central delta function with negative
coefficient of magnitude ,
corresponding to the methyl region. The six adjustable parameters in the
model are: A, , , /,
L and a common normalizing factor.
Using this
model for the electron density profile,
the expected structure factors at the observed (h,k) values are calculated.
The calculated structure factors are compared with the observed ones and
a chi-square value is obtained, which is subsequently minimized by varying
the adjustable parameters in the model. The phase of each of the Bragg
reflections is obtained from the structure factors calculated from the
converged model. These calculated phases are combined with the observed
magnitudes of the structure factors and inverse Fourier transformed
to get the electron density function.
IV. RESULTS AND DISCUSSION
The observed and calculated structure factors (Fo and Fc
respectively)
for l and dl-DMPC
at 24oC and 98 RH is given in Table 1. Almost all the phases
of the
corresponding reflections in the two cases are the same.
We have calculated the electron density profiles of the ripple phase of
l
and dl-DMPC bilayers at various temperatures and a
relative humidity of 982.
The profiles at
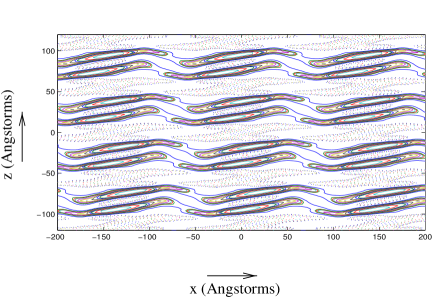
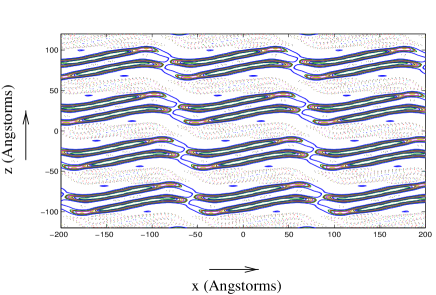
24 oC are presented in Figs. 1 and 2. The structural parameters
of the ripple phase
at two different temperatures are given in Table II. As one can observe,
the ripples formed by chiral and racemic DMPC bilayers do not differ
appreciably. The peak-to-peak amplitude in both cases is approximately 18 Å,
and the ratio of the length of the major arm to that of the minor arm
is found
to be 2.1 and 2.4 for l-DMPC and dl-DMPC bilayers,
respectively. Furthermore, the thickness of the bilayer in the
two arms is different in both cases. This can be explained in terms of
an average tilt of the hydrocarbon chains along the ripple wavevector [13].
The minor differences in the two figures arise most probably because we have
not been able to apply
absoption corrections.
Thus at all temperatures studied, the structure of the ripple phase in
chiral and racemic DMPC bilayers is practically identical.
V. CONCLUSION
In this brief report we have presented electron density profiles of
chiral and racemic DMPC bilayers in the ripple phase. The maps show
asymmetric ripples in both the systems. Moreover, all
the structural features in the two cases are found to be practically
identical
under similar experimental conditions. The present study thus unambiguously
confirms our earlier conclusion that the structure of the P
phase does
not depend on the chirality of the lipid molecules constituting the
bilayer [11].
Acknowledgements: We thank Yashodhan Hatwalne and K. Usha for many
helpful discussions and HKL Research Inc. for the use of their software.
References:
-
1.
A. Tardieu, V. Luzzati, and F. C. Reman, J. Mol. Biol. 75, 711 (1973).
-
2.
F. C. MacKintosh, Current Opinion in Colloid and Interface Science 2, 382 (1997).
-
3.
M. J. Janiak, D. M. Small, and G. G. Shipley, J. Biol. Chem. 254, 6068 (1979).
-
4.
G. S. Smith, E. B. Sirota, C. R. Safinya, and N. A. Clark, Phys. Rev. Lett. 60, 813 (1988).
-
5.
D. C. Wack and W. W. Webb, Phys. Rev. A 40, 2712 (1989).
-
6.
M. P. Hentschel and F. Rustichelli, Phys. Rev. Lett. 66, 903 (1991).
-
7.
J. T. Woodward and J. A. Zasadzinski, Biophys. J. 72, 964 (1997).
-
8.
T. C. Lubensky and F. C. MacKintosh, Phys. Rev. Lett. 71, 1565 (1993).
-
9.
C-.M. Chen, T.C. Lubensky and F.C. MacKintosh, Phys. Rev. E 51, 504 (1995).
-
10.
Symmetric (asymmetric) ripples correspond to a rectangular (oblique) unit cell.
-
11.
J. Katsaras and V. A. Raghunathan, Phys. Rev. Lett. 74, 2022 (1995).
-
12.
J. Katsaras, R. F. Epand, and R. M. Epand, Phys. Rev. E 55, 3751 (1997).
-
13.
K. Sengupta, V. A. Raghunathan and J. Katsaras (to be published).
-
14.
W.-J. Sun, S. Tristram-Nagle, R. M. Suter, and J. F. Nagle, Proc. Natl. Acad. Sci. USA 93, 7008 (1996).
Table I.
The observed and calculated stucture factors at 24oC and 98 RH
| l-DMPC | dl-DMPC | ||||
| h | k | Fo | Fc | Fo | Fc |
| 1 | 0 | 100.0 | -80.2 | 100.0 | -117.1 |
| 1 | -1 | 42.5 | -38.0 | 59.2 | -32.9 |
| 2 | 0 | 29.7 | -19.8 | 65.0 | -43.3 |
| 2 | -1 | 43.6 | -40.5 | 68.0 | -55.2 |
| 2 | -2 | 9.3 | -15.4 | 29.0 | -38.5 |
| 2 | 2 | 15.7 | -14.6 | 21.7 | -3.2 |
| 2 | 3 | 10.6 | 7.9 | 10.6 | 0.3 |
| 3 | 0 | 21.2 | -2.9 | 32.9 | 11.5 |
| 3 | -1 | 42.4 | 33.9 | 53.3 | 39.3 |
| 3 | -2 | 29.2 | 32.0 | 35.0 | 38.3 |
| 3 | 2. | 9.5 | 17.1 | 9.0 | 16.0 |
| 3 | 3. | 16.5 | -15.9 | 12.3 | -0.5 |
| 3 | 4 | 16.3 | 10.3 | 13.3 | 2.0 |
| 3 | 5 | 12.4 | -4.2 | - | - |
| 4 | 0 | 29.9 | 27.9 | 31.1 | 22.5 |
| 4 | -1 | 25.5 | -31.2 | 33.1 | -37.4 |
| 4 | -2 | 55.5 | -79.5 | 56.8 | -57.5 |
| 4 | -3 | 27.7 | -33.9 | 27.9 | -35.8 |
| 5 | 0 | 8.5 | 0.6 | 9.6 | 4.6 |
| 5 | -1 | 5.9 | 0.8 | 12.0 | -0.3 |
| 5 | -2 | 7.8 | -10.1 | 10.8 | -29.4 |
| 6 | 0 | 4.4 | 1.2 | 6.4 | -5.6 |
| 6 | -1 | 5.9 | -5.4 | - | - |
| 7 | 0 | - | - | 5.5 | -2.2 |
| 9 | 0 | - | - | 4.5 | -1.3 |
Table II.
The structural parameters of the ripple phase
| (o) | (Å) | D | (Å) | A(Å) | |||
| l-dmpc | 24 o C | 991 | 1422 | 561 | 972 | 181 | |
| 21 o C | 99 | 145 | 56 | 98 | 18 | ||
| dl-dmpc | 24 o C | 98 | 141 | 56 | 100 | 19 | |
| 21 o C | 98 | 140 | 56 | 99 | 18 |