Effect of Combining a DC Bias Current with an AC Transport Current on AC Losses in a High Temperature Superconductor
Abstract
Creating complex flux configurations by superposing a dc current or magnetic field onto the ac current in a type II superconducting tape should lead to a variety of peculiar behaviors. An example is the appearance of the Clem valley, a minimum in the ac losses as a function of the dc bias amplitude, which has been theoretically studied by LeBlanc et al., in the continuation of Clem’s calculations. These situations have been investigated by applying a dc current to a silver-gold sheathed Bi-2223 tape at 77 K (critical current 29 A), in addition to the usual ac transport current. The ac losses were measured by the null calorimetric method to ensure that the total losses were being accounted for. These were recorded for different values of the ac and dc currents, leading to the observation of two different behaviors depending on the ac current. Our revelation of the Clem valley is, to our knowledge, the first experimental validation of this phenomenon in high temperature superconductors, and may provide a simple way of reducing the ac loss in industrial applications of these materials.
I Introduction
Since their discovery, high temperature superconductors (HTS) have seen their properties greatly improved following the optimization of their fabrication process and their design. Their widespread use in industrial applications seems to be rapidly approaching. Nevertheless, the study of their behavior has generally included very simple arrangements, whereas practical situations will involve much more complex situations, for example the electromagnetic environment.
In the particular field of energy transportation, HTS tapes may be subjected not only to an ac current, but also to magnetic fields of various orientations from neighboring conductor tapes, or from other devices such as coils in a transformer. Thus, while the isolated superconducting tape behavior in transport current conditions seems to be quite well understood by way of intensive ac loss measurements, interest now turns towards subjecting the superconducting tape to the superposition of several electromagnetic perturbations.
For example, some workers are measuring the effect of dc [1, 2, 3] and ac [3, 4, 5, 6] magnetic fields on ac transport losses or the effect of dc current on ac losses induced by an ac magnetic field [7].
Following previous work of Clem [8] and later by LeBlanc et al. [9], we choose to apply a dc current to our Ag-Au/Bi-2223 superconducting tape in addition to the usual ac transport one, and to look at the effects on its ac losses. This paper presents our first results, which confirm the expected decrease in ac losses, and the suggested explanations for the observed effects.
II Theoretical considerations
When the ac losses in a tape are generated by the application of an ac transport current or an ac magnetic field, the profiles of magnetic induction inside the superconducting materials show a horizontal mirror symmetry, which leads to the well-known ac loss calculations. On the other hand, if a dc signal (collinear current or magnetic field) is applied to the tape in addition to the ac one, flux density profiles may lose this symmetry if one considers the field dependence of the bulk pinning properties [9, 10] (by way of the critical current), or the presence of surface barriers against flux entry and exit [8, 11] or the Meissner screening current [10, 11].
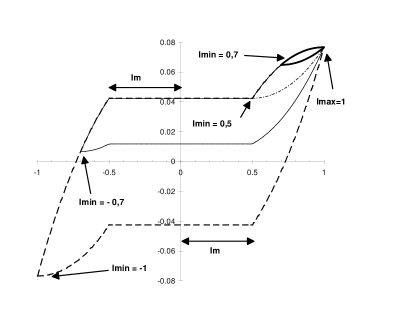
We consider in particular the latter which is a current circulating at the surface to compensate the magnetic field outside the superconducting material when in the Meissner state, and which modifies the hysteresis loops of the magnetic flux density in such a way that the total current flowing through the material is reduced by in absolute value. This situation is illustrated in Fig. 1, using the theoretical formulation established by LeBlanc et al. [10], in the case where a dc current is applied in addition to the ac transport current . The average magnetic flux density is given as a function of the total current, which is being varied between { = + } and { = - }. Here the critical current is considered independent of the magnetic field, following the Bean approximation.
When expressing the ac losses as a function of the applied dc bias current, two different behaviors are observed depending on whether the ac current is smaller or larger than .
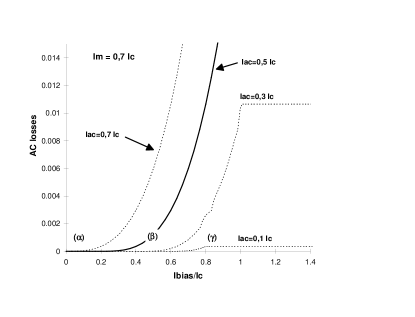
If the ac current amplitude is less than the Meissner screening current, then the ac losses have the shape displayed in Fig. 2. These ac losses curves are also obtained using the LeBlanc et al. calculations [10], with each one corresponding to a value of the ac current and all current values normalized by the critical current . The initial plateau (identified as zone ) appears when the total current ( + ) is less than the Meissner current, i.e. when the magnetic flux is totally expelled from the superconductor: there are no losses at all. Then the ac losses increase (zone ) as the dc current is increased since screening is no longer totally effective. A last zone , with another plateau, may appear as the dc current is increased above { + } if the condition { /2} is met. Otherwise, the ac losses variation ends with the () zone. The zone plateau occurs when = { - } is larger than the Meissner current, so that the hysteresis loop displays no horizontal segment. This case is illustrated by the thick curves in Fig. 2.
If the ac current is greater than the Meissner screening current, the ac loss behavior as a function of the dc bias current is different from the previous situation. In that case, the first plateau (zone ) is replaced by a decrease, so that the ac loss curves display a minimum as the dc current amplitude is augmented. On the other hand, the two other typicallyshaped zones ( and ) still exist and follow the same criteria. The reason for this decrease in ac losses is the diminution of the area between the two horizontal segments of the hysteresis loops (see Fig. 2) as the dc current amplitude is augmented. The location of the ac loss minimum can be deduced from the Fig. 2 curves and corresponds to a superposition of the upper and lower horizontal segments, i.e. to = -. Thus the minimum occurs when = - .
A similar behavior for the ac loss as a function of the dc bias current is obtained when replacing the Bean approximation by the Kim approximation, i.e. with the critical current inversely proportional to the magnetic induction. The only difference consists in more rounded transitions between the different zones.
III Experimental details
The null calorimetric method [12, 13] has been used for the ac loss measurements at liquid nitrogen temperature. Very briefly, its principle consists in feeding alternately during a few seconds the superconducting tape with an ac current (plus a dc bias current in this case) and a reference tape with an increasing dc current, until their heating effects are equal so that the amplitude of the temperature variation is nulled. The major advantage of a calorimetric method is the assurance of recording all the losses, which becomes fundamental when dealing with more complex electromagnetic environments. For example, this is not the case for the electrical method, where one is restricted to only the transport loss.
The superconductor tape measured here is a silver-gold alloy sheathed Bi-2223 conductor made by the Powder-in-Tube technique in IREQ laboratories. Its characteristic dimensions are a cross-sectional area of 2.10-3 cm2, and a length of about 30 cm. Its critical current has been determined by the fitting of its V-I characteristic with the double integration of the sum of gaussian curves and is equal to 29 A. Excessive heating occurred during the measurement campaign and damaged the sample thereby lowering its critical current value to about 25 A. The data corresponding to one or the other of the sample conditions, i.e. to a 29 or 25 A critical current, will be clearly identified in Fig. 2 and Fig. 3, which illustrate the measurement results.
The reference tape mentioned above is composed of brass (resistivity of 7.3 .cm at 77 K), and has the same dimensions as the superconducting sample.
IV Results and discussion
The ac losses were measured for different values of the ac and dc currents in the superconducting tape. The choice of the ac current frequency was guided by the requirement of a maximum resolution in the determination of the ac losses, but without heating the sample excessively. Consequently, the ac loss measurements at lower currents (less than half the critical current) were made at 559 Hz, while those at higher currents were done at 55 Hz. Nevertheless, we verified that the choice of the frequency has no effect on the shape of the ac loss curve.
When expressed as a function of the dc bias current, the measured ac losses display two different behaviors depending on the value of the fixed ac current.
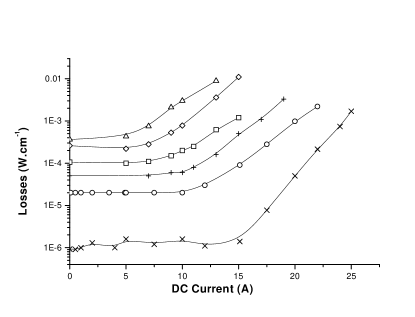
As shown in Fig. 3, for low ac current values (ranging from 3 to 15 Arms, while the critical current is 29 A), the ac loss curves as a function of the dc bias current show an initial plateau at a loss level equal to that obtained with no additional dc current, followed by an increase. In this graph, ac losses, expressed in W/cm, are measured at 559 Hz and displayed on a log scale for convenience. Solid and dotted lines through the data points serve as guides to the eye. The dc current values corresponding to the end of the plateau decrease as the ac current is augmented, and seem to follow the following relationship: Idc + Iac = constant.
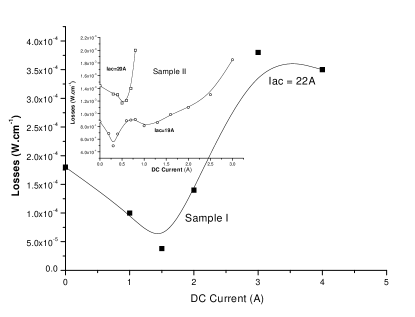
For the higher ac current values, i.e. 19 and 20 Arms with a critical current value of 25 A, and 22 Arms for a critical current of 29 A, the ac loss curves in Fig. 4 display an initial decrease as the dc current value is increased, followed by the usual increase. When comparing the 19 and 20 Arms curves, one can see that the location of this minimum moves to higher dc current values as the ac current amplitude is increased, although corresponding dc current values remain very small (less than 1 A). A more thorough investigation is required to characterize this movement. It appears that these are the first reported observations of the Clem valley in HTS and the first in any superconductor using transport currents. LeBlanc et al. had observed it on a VTi sample with applied magnetic fields [9].
Returning to the loss behavior at low ac currents, our measurements display the general shape of LeBlanc’s theoretical predictions (see Fig. 2), with a plateau followed by an ac loss increase. Moreover, the position of the end of the plateau seems to obey the predicted relationship, i.e. + = constant. In the simulations, this constant, 20 A from our measurements, would correspond to the Meissner screening current.
Nevertheless, the loss level of the plateau ( zone) constitutes a major discrepancy, since the Meissner screening current is expected to prevent any flux line from entering the superconducting material whenever the total applied current ( + ) is less than , and consequently, the plateau is situated at a zero ac loss level. On the contrary, in our measurements, the plateau height for each ac current value corresponds to the ac losses measured when no additional dc current is applied, which are anything but null. Moreover, for an HTS material, the Meissner screening current value, which is related to the lowest critical magnetic field, is very small (of the order of magnitude of 10-5A).
A possible explanation for this discrepancy comes from the granular nature of our sample. Before penetrating into the superconducting grains, magnetic flux lines first enter the intergrain material, which possesses a lower critical current density and which acts as weak links between the grains. Therefore, each grain is individually screened from the magnetic flux lines by the intergrain material, and the current circulating in it. In this regime, the losses are solely due to the ac current in the intergrain superconducting material. When an increase in the dc bias current causes the total current to exceed the intergrain critical current, flux lines begin to enter into the grains, which then also contribute to the ac losses. Any further increase of the dc current allows more flux lines to penetrate into the grains, which leads to an increase in the losses. According to this interpretation, the intergrain critical current is estimated to be equal to 20 A, while the intragrain one is 29 A (these measurements at low ac currents have been made on the sample before its deterioration).
V Conclusion
The measurement of ac losses on a Ag-Au/Bi-2223 superconducting tape has been performed with a dc bias current superimposed on the ac transport current. The results are generally coherent with the simulations of LeBlanc et al. but a discrepancy remains in the loss level at low ac currents. While more theoretical and experimental work is required in this matter, we may point to the existence of both intragrain and intergrain material in real samples. Nevertheless, our results constitute the first observation of the Clem valley in HTS and the first in any superconductor by a transport method.
Acknowledgment
The authors want to thank Professor M.A.R. LeBlanc for his kind help.
References
- [1] M. Ciszek, B.A. Glowacki, A.M. Campbell, S.P. Ashworth, W.Y. Liang, P. Haldar and V. Selvamanickam, ”Influence of external magnetic field and its orientation on transport ac losses in Bi-2223 and Tl-1223 silver sheathed tapes”, Proceedings of 1996 Applied Superconductivity Conference (Pittsburgh), published in IEEE Trans. Appl. Supercond.
- [2] B. Dutoit, N. Nibbio, G. Grasso and R. Flukiger,”Self field and applied field ac loss measurements of multifilamentary Bi(2223) tapes”, Proceedings of EUCAS 1997, The Netherlands.
- [3] J.J. Rabbers, B. ten Haken and H.H.J. ten Kate,”Measuring transport current loss of BSCCO/Ag tapes exposed to external AC magnetic fieldÉ, Proceedings of topical ICMC’AC Loss & stability”, 1998, The Netherland.
- [4] S. Fukui, M. Ito, N. Amemiya, O. Tsukamoto and M. Hakamata, ”AC losses of Nb3Sn AC multifilamentary superconducting wires due to transport current”, Proceedings of ICEC16, 1996, Kitakyushu.
- [5] D.E. Daney, H.J. Boenig, M.P. Maley, D.E. McMurry and B.G. DeBlanc, ”AC loss calorimeter for three-phase cable”, IEEE Trans. Appl. Supercond. Vol. 7, pp. 310, 1997.
- [6] N. Magnusson and S. Hornfeldt, ”Calorimetric AC loss measuring system for HTS carrying AC transport currents”, Proceedings of EUCAS, 1997, The Netherlands.
- [7] M. Ciszek, B.A. Glowacki, S.P. Ashworth, E. Chesneau, A.M. Campbell and J.E. Evetts, ”AC magnetic losses in multifilamentary Ag/Bi-2223 tape carrying DC transport current”, Proceedings of EUCAS, 1997, The Netherlands.
- [8] J.R. Clem, ”Theory of ac losses in type-II superconductors with a field-dependent surface barrier”, J. Appl. Phys., Vol. 50 (5), May 1979, pp. 3518.
- [9] M.A.R. LeBlanc, G. Fillon and J.P. Lorrain, ”The role of bulk pinning in the Clem valley in hysteresis losses in type II superconductors”, J. Appl. Phys., vol. 59 (9), May 1986, pp. 3208.
- [10] M.A.R. LeBlanc, D.S.M. Cameron, D. LeBlanc and J. Meng, ”Reduction of low frequency ac losses in coaxial cables of type II superconductors by a steady bias current”, J. Appl. Phys., Vol. 79(1), January 1996, pp. 334
- [11] M.A.R. LeBlanc, ”The effect of bias magnetic fields and currents on A.C. losses in type II superconductors”, Appl. Supercond., vol. 3, 1995, pp. 497.
- [12] P. Dolez, ”Développement d’une méthode calorimétrique de mesure des pertes ac pour des rubans supraconducteurs à haute température critique”, Ph. D. Thesis, April 1998, University of Sherbrooke, Canada.
- [13] P. Dolez, J. Cave, D. Willén, W. Zhu and M. Aubin, ”Improvements and validation of the null calorimetric method for ac loss measurements in superconductors”, Cryogenics, vol. 38, 1998, pp. 429.