Frictional mechanics of wet granular material
Abstract
The mechanical response of a wet granular layer to imposed shear is studied experimentally at low applied normal stress. The granular material is immersed in water and the shear is applied by sliding a plate resting on the upper surface of the layer. We monitor simultaneously the horizontal and the vertical displacements of the plate to submicron accuracy with millisecond time resolution. The relations between the plate displacement, the dilation of the layer and the measured frictional force are analyzed in detail. When slip begins, the dilation increases exponentially over a slip distance comparable to the particle radius. We find that the total dilation and the steady state frictional force do not depend on the driving velocity, but do depend linearly on the applied normal stress. The frictional force also depends linearly on the dilation rate (rather than the dilation itself), and reaches a maximum value during the transient acceleration. We find that the layer can temporarily sustain a shear stress that is in excess of the critical value that will eventually lead to slip. We describe an empirical model that describes much of what we observe. This model differs in some respects from those used previously at stresses times larger.
pacs:
PACS: 83.70.Fn, 47.55.Kf, 62.40.+i, 81.40.PqI INTRODUCTION
The response of any material to an applied shear stress is an important mechanical property. We are concerned here with granular materials, for which the response to shear stress amounts to friction. We have previously reported an extensive study of dry granular friction under low applied normal stress [1, 2], and here we extend that work to the case of wet materials. Although our motivation is primarily fundamental, it should be recognized that a study of granular friction, including the wet case, is of potential interest in connection with applications such as the processing of powders. It may also be of conceptual or heuristic interest in connection with seismic phenomena, though the applied stresses in our work are lower by a factor of . Do the friction laws obtained at pressures of 100 MPa extrapolate to such low stresses, or do completely new effects occur? An excellent review of geophysically inspired experiments conducted at high pressures has been given by Marone [3]. Much of the work described in that review was concerned with the determination of friction laws that incorporate memory effects. These state variable friction laws are also reviewed in the book by Scholz [4], and a recent review of friction that includes consideration of microscopic physics has been given by Persson [5].
We have several different motivations in considering the case of a granular medium that is immersed in a fluid. It is well known that even slight amounts of water adsorbed on a granular medium (or a rough surface) can affect friction. In one recent paper, the condensation of small amounts of water near points of contact was shown to produce substantial strengthening of a granular material [6]. To eliminate this effect, one can fill the pore spaces entirely with a fluid, i.e., submerge the material. Once we undertook such an experiment, we found that immersion has additional merits : Lubrication reduces the friction so that the transition from stick-slip dynamics to continuous sliding occurs at very low velocity. Thus, one can study the dynamics of the transition from rest to steady sliding over a wide range of velocities, which turns out to allow delicate tests of friction laws.
Broad references to the literature on granular friction were given in the introduction to our previous paper [1], and we do not repeat that material here. Works specifically concerned with friction in wet granular materials appear to be rather limited. However, it is important to mention the experimental work of Marone et al. on the frictional behavior of simulated fault gouge [7]. They studied the response of immersed granular material subjected to shear deformation and observed both a noticeable dilation of the material and a consequent velocity strengthening. These results were obtained at large normal stress (50-190 MPa) in sand. The work presented here differs from their work in two essential respects: First, the normal stress applied to the layer is at least six orders of magnitude smaller in our work (typically 20 Pa). Second, the granular material considered here consists of spherical glass beads with a narrow size distribution. We point out in a later section the similiarities and differences in the resulting frictional dynamics. A thorough controlled study of the frictional behavior of an immersed granular material under low stress, comparable to what we have presented previously for dry materials, has not appeared previously to our knowledge.
The experimental setup is similar to that described in Refs. [1, 2, 8, 9]. The sensitivity achieved in the present paper is an advance over previous work. We are able to measure both vertical and horizontal displacements to a precision of about , and are able to do so with excellent time resolution of . It is true but surprising that precision for displacement measurements much better than the particle size is necessary in order to explore the dynamics fully. We focus attention here particularly on the vertical dilation that accompanies slip, since it is clear that dilation is a necessary dynamical variable in any granular friction law.
The present article is organized as follows. Our experimental methods are described in Sec. II and the observations are presented in detail in Sec. III. In Sec. IV we compare our results to an empirical model and previous work and then we conclude.
II EXPERIMENTAL METHODS
A Introduction
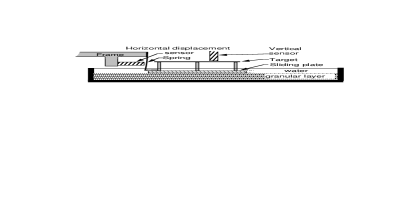
A schematic diagram of the experimental setup is shown in Fig. 1. The granular material resides in a rectangular tray whose lower surface has been coated permanently with a layer of particles to ensure that no sliding occurs at this interface when the layer is sheared. A given amount of granular material is then spread out on the tray and it is filled with distilled water. A homogeneous layer of material 3 mm deep is obtained by sliding a straight rod along the side edges of the tray. The sliding plate is gently placed on top of the granular layer, additional water is added to ensure that it is submerged and covered by about of water, and a visual check is made to ensure that no air bubble has been trapped underneath the plate.
Shear stress is imposed on the granular layer by translating the plate over its upper surface. In order to transmit the shear stress, the bottom surface of the sliding plate is roughened in one of two ways: (a) If visualization is not required, a glass plate is used with a monolayer of granular material glued to its lower surface. (b) When visualization is desired, a transparent acrylic plate is used; its lower surface is ruled with parallel grooves 2 mm apart and about 0.1 mm deep to pin the material. Most of the experiments reported here have been done using (b), but we have checked that (a) gives essentially the same results.
The dimensions of the sliding plate are length , width , and thickness ; the direction of travel is along the length. The in-plane dimensions of the tray (i.e. ) are much larger than those of the sliding plate; no boundary effect has been observed.
The granular material used in most of the experiments reported here consists of spherical glass beads with a mean diameter of and a standard deviation that is from Jaygo, Inc. We have checked that our conclusions remain valid for other samples with mean diameters of about and .
Whether or not a layer of beads was glued to the bottom of the container did not affect the experimental results described in this paper. We conclude that the shear zone is smaller than the layer height in all cases considered. The small total vertical dilation of the granular layer during shear, described in Sec. III, indicates that the shear zone height is, at most, a few beads. The size of the shear zone can become comparable to the height of the granular layer for the largest beads (for which the layer height is approximately six bead diameters) at low pulling velocities. However, such a case is not included in the experimental results.
Visual inspection of the top layer of beads underneath the transparent acrylic plate shows that the beads are arranged randomly. The arrangement remains random after repeated sliding of the plate. The organization of beads in deeper layers cannot be determined visually.
The volume fraction of glass beads is for both wet and dry cases. We find that shaking and pressing of the material does not increase the volume fraction measurably. The measured value is close to the numerically obained estimate of for random close packing of uniform spheres [10]; a slightly larger value would be expected for random close packing if there is some variation in bead size.
B Driving system and frictional force measurement
In order to control the stiffness of the driving system, the plate is pushed with a blue tempered steel leaf spring (constant ) connected to a translation stage. The stage is driven at constant velocity (between and ) by a computer-controlled stepping-motor which turns a precision micrometer. The coupling between the spring and the plate is accomplished through a rounded tip which is glued to one end of the plate. This makes it possible for the plate to move both horizontally and vertically as the thickness of the granular layer varies during the motion.
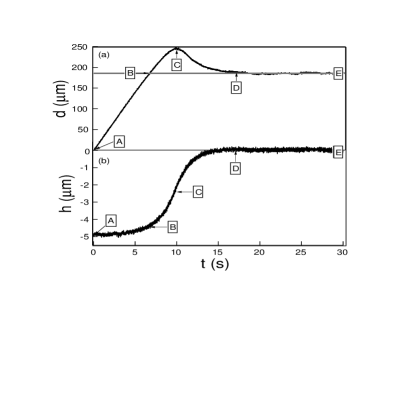
The elastic coupling through the spring allows relative motion of the plate with respect to the translator. The horizontal relative motion is monitored by measuring the displacement of the spring from its rest position at the coupling point with an inductive sensor, model EMD1050 from Electro Corporation, as in Refs.[1, 8]. A typical trace of as a function of time is shown in Fig. 2(a).
The differential equation governing the position of the sliding plate in the laboratory frame reads
| (1) |
where is the mass of the sliding plate, is the spring constant, and is the pulling velocity. Here denotes the frictional force, which depends on time. For the parameter range used in the experiment, the inertia of the sliding plate can be neglected and the frictional force is then . We estimate that the displacement is known within so that the frictional force is measured within . This is typically about of the normal stress.
C Vertical displacement measurement
The vertical displacement of the plate is monitored with a second inductive sensor as shown in Fig. 2(b). The target of the sensor is a blue tempered steel plate connected to the sliding plate with the help of five pillars (diameter = ). The target is not perfectly flat and parallel to the sliding plate; the measurements must be corrected to exclude this source of error at the micron level of sensitivity. Once this is done, we estimate that the vertical position of the plate is known within about . We also point out that is determined only to within an additive constant; We choose the constant so that in the steady-state regime [e.g. the right hand side of Fig. 2(b)].
D Applied normal stress: effect of immersion
The plate is immersed in water, so it experiences a buoyant force. The mass of the displaced volume of water (volume of the plate + volume of length of the pillars) is . In the following, we define the mass of the sliding plate to be its real mass reduced by . For instance, most of the results given below are obtained with a sliding plate whose actual mass is , so that . The mass of the plate must be small enough that the plate does not sink significantly into the granular layer. We estimate the density of the water-glass beads mixture to be about . Then, assuming that the granular layer behaves like a dense fluid, estimating the equilibrium depth of the bottom surface of the plate, and assuming that the plate sinks (during translation) when this depth equals the plate thickness, we determine that the plate should be expected to sink into the granular bed for masses larger than . Experimentally, we find that the granular layer can sustain somewhat larger loads but we limited our study to .
III EXPERIMENTAL RESULTS
A Basic observations
We always prepare the system for measurements in the same way to assure reproducible experimental conditions. The granular layer is first installed as previously described, and the plate is then pushed at constant velocity () until a steady state regime is reached. During this initial “break-in” phase, the plate slightly sinks in the granular layer and a small heap forms at the leading edge. This heap has been proven to have a negligible effect on the frictional force by turning the plate through 90 degrees. The results obtained by pushing the plate either along its length or along its width differ only slightly, despite the factor of 1.5 difference in dimensions. The spring is then pulled back until it loses contact with the rounded tip so that no stress is initially applied for the measurements of interest.
Once the sample has been prepared as just described, the spring is pushed at constant velocity, and both the spring horizontal displacement , and the vertical position of the plate are monitored during the motion as shown in Fig. 2. The horizontal position of the plate in the laboratory frame is deduced from through the relation (Fig. 3). After a transient regime (which is discussed in Sec. III.C), both the frictional force and the vertical position of the plate are found to reach steady asymptotic values, provided that the spring is pushed at a velocity larger than about . We focus next on the behavior in this steady-state regime.
B Steady-state regime
The frictional force in the steady-state dynamical regime is proportional to the mass of the sliding plate as shown in Fig. 4. The frictional force is then written:
| (2) |
where is the frictional coefficient in the steady-state regime, which might depend on the plate velocity. There is no evidence of an additional viscous contribution to the frictional force, which could arise due to the surrounding water. Indeed, the linear interpolation leads to for . [We find for , a value that is consistent with zero, given the uncertainty in .] It is important to know that such a contribution is insignificant, since it would be independent of the normal applied stress. The experimental slope in Fig. 4 leads to a friction coefficient for the diameter beads. This value is significantly smaller than that measured for the same material when dry. In that case, we observe stick-slip motion for which is found to vary between about and [1].
We also analyzed the dependence of the frictional force on the velocity in the steady-state regime that arises after the initial transient. Within the experimental resolution, we find that the frictional force does not depend on the pulling velocity over four orders of magnitude, as shown in Fig. 5.
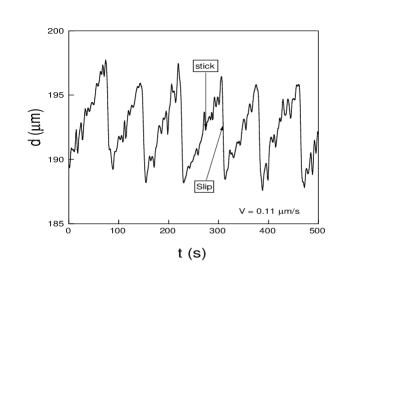
However, when the velocity is very small (less than about ), we find stick-slip motion [11] (Fig. 6). In this case, which corresponds to the leftmost point in Fig. 5, we have used the time average frictional force as an estimate. The steady state, which could presumably be reached for such small velocities by increasing the spring constant, would probably have a somewhat higher friction coefficient since velocity weakening is a requirement for the stick-slip instability. Except for such very low velocities (typically ), it is safe to conclude that the friction coefficient is independent of velocity.
C Transient regime
1 Description
The sequence of events in the transient regime is as follows. When the spring first comes into contact with the rounded tip at A in Fig. 2(a), the applied stress increases linearly with time, and the plate remains at rest (Fig. 3) until a minimum horizontal applied stress is reached at B. During this initial stress loading over the interval AB, no significant change in the vertical position of the plate is observed [Fig. 2(b)]. When the applied stress is large enough, the plate begins to slide significantly. The layer begins to dilate while the applied stress continues to increase along BC, reaches a maximum at C, and then decreases along CD to its asymptotic value at E. The total variation of the vertical position of the plate is only a few micrometers (typically ).
2 Layer dilation
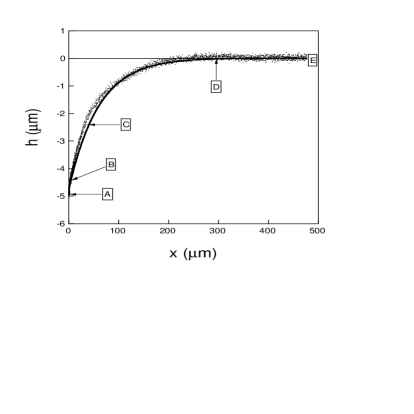
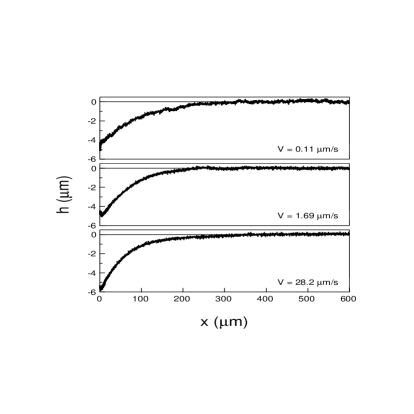
We find that the vertical position of the plate tends to its asymptotic value roughly exponentially with the sliding distance as shown in Fig. 7, and that the dilation is roughly independent of the driving velocity (Fig. 8). This result suggests that the dilation rate may be expressed as a function of the dilation and of the plate velocity as follows:
| (3) |
where is the characteristic distance over which the layer dilates. The experimental behavior of as a function of and is shown in Fig. 9. Although the law given in Eq. (3) is only roughly satisfied, the mean slope of the curve leads to , which is approximately the mean radius of the glass beads. The corresponding exponential variation of shown in Fig. 7 demonstrates good agreement between Eq. (3) and the experimental data.
We measure no systematic dependence of the total dilation on the driving velocity for layers prepared in the same way. Any variation is, at most, over the full velocity range accessible to the experimental setup. Since we expect the initial compaction of the layer to be the reproducible (given identical preparation), we conclude that the mean density of the sheared granular layer does not depend on the shear rate within the experimental resolution. In contrast, the total dilation decreases when the normal applied stress is increased; typically decreases by when the mass of the plate is increased by .
The total dilation depends strongly on the initial conditions. For instance, we show in Fig. 10 the different behaviors of and as functions of time in two cases: (1) The horizontal stress is released prior to the experiment. [The layer is prepared as described in Sec. III.A with results shown in Fig. 2.] In this case we find . (2) The horizontal stress is not released between runs. [The plate is initially pushed at constant velocity () until the steady-state regime is reached. The motion of the translator is suddenly stopped and the plate stops at a well-defined horizontal applied stress (). The translator motion is then started again.] In this second case we find that the total dilation of the layer during the motion is only . The smaller dilation observed in case (2) suggests that the continuously applied horizontal stress prevents the layer from compacting freely between runs.
The small magnitude of the total dilation, roughly of the bead radius, implies that the shear zone is localized to at most a few layers of beads. The near constancy of the vertical displacement during sliding suggests that shear may organize the beads into horizontal layers.
In summary, a significant dilation of the granular layer accompanies the horizontal motion of the plate. During the transient regime, the layer dilates from its initial compaction to allow the horizontal motion of the plate. This slight expansion of less than one tenth of the bead diameter occurs over a characteristic horizontal displacement comparable to the bead radius. The total dynamical dilation decreases when the normal stress is increased and does not depend on the driving velocity. Experiments performed with and diameter beads show that the total dilation scales with the bead size.
3 Frictional force
The frictional force reaches a maximum during the initial transient while the layer dilates (label C in Fig. 2). For a given layer under the same experimental conditions, the measured value of is reproducible to within 10%. As explained in the following, this experimental scatter originates essentially in fluctuations of the initial compaction. This scatter is small enough not to interfere with a measurement of the maximum frictional force as a function of and .
In contrast to the behavior of the steady-state frictional force , the maximum frictional force increases with over the whole range of accessible driving velocities. Nevertheless, we find that increases only slowly for as shown in Fig. 11.
When layers of new material are prepared, the initial compaction fluctuates somewhat. We infer this fact from the dependence of the maximum frictional force on the total dilation for many layers that have not been subjected to an initial horizontal stress. The results are plotted in Fig. 12, where one can see that the maximum frictional force increases linearly with :
| (4) |
whith and .
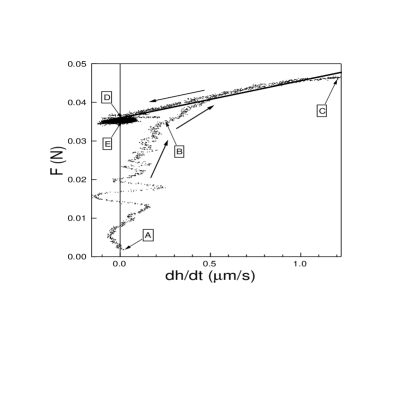
Thus, the initial overshoot of the frictional force is at least partially related to the additional energy the system requires to dilate. In Fig. 13, we show the variation of the frictional force with the dilation rate during a single transient event. As soon as the plate moves significantly in the horizontal plane (B and afterwards), increases roughly linearly with the dilation rate and can be described by
| (5) |
with . Note that depends linearly on the dilation rate rather than on the dilation itself. This result is surprising. If we suppose that the overshoot of the frictional force originates in the potential energy used to lift the plate, one would expect the frictional force to depend linearly on : The energy balance between the additional potential energy acquired by the weight per unit time and the power provided by the driving system would lead to according to Eq. (3). The experiment performed by Marone et al. at large stress agrees with this prediction [7]. Nevertheless, such a dependence is not observed in our experiments. The excess work done by the driving system during the overshoot is experimentally about twice the increase in the potential energy.
We also notice from Fig. 13 that Eq. (5) fails to describe the initial stage of the motion, when the velocity and the displacement of the plate remain small (typically and ). The total displacement of the plate is then only of the bead radius and the velocity is so small that we can expect the system to respond as an elastic medium. However, the experimental setup does not currently allow us to study in detail the very early response of the granular layer to a stress loading and unloading because of play in the driving system.
In summary, the experimental results exhibit the important role played by the dilation of the layer on the frictional force , which depends roughly linearly on the dilation rate when the plate experiences a significant motion in the horizontal plane. As a consequence, the maximum value reached by the frictional force during the transient for a given driving velocity depends linearly on the total dilation of the layer between its initial state and the steady-state regime.
D Response to a static shear stress larger than the critical value
Let us now consider the response of a compact granular layer to a static horizontal applied force . The layer is prepared by driving the system in the steady-state regime at large velocity (typically ), stopping the motor suddenly, and pulling the spring back until the applied stress is fully released (). Afterwards, the spring is again pushed ahead but at lower velocity (typically ) and is stopped at a given value of the applied stress .
We find that the granular layer can sustain the applied stress for a long time (several minutes) when typically. Nevertheless, the plate creeps slowly and the frictional force gradually declines. Small amplitude oscillations of the vertical position of the plate are observed (typically in amplitude as shown in Fig. 14, case 1) without a mean rise of the plate; the horizontal velocity (not shown) does not exhibit measurable oscillations. In contrast, when the applied stress is larger (e.g. , case 2 of Fig. 14), the granular layer sustains the stress only for a few minutes. The plate creeps slowly at first while a significant dilation of the layer is observed (typically ). After a few minutes a large slip event occurs during which the stress is released. The plate slides rapidly for a few tens of micrometers in the horizontal plane and compacts by about vertically. After the slip event, the horizontal motion of the plate is again hardly noticeable and vertical oscillations are observed as for lower applied stress. The plate can then sustain the remaining stress, which is now smaller, for a long time. We do not understand the oscillations of the vertical position of the plate, but they cannot be experimental artifacts, to the best of our knowledge.
IV DISCUSSION AND CONCLUSION
A Recapitulation of the main experimental results and empirical model
The experiments performed on immersed granular material allow us to propose an empirical model for the mechanical behavior of a sheared granular layer under very low stress. The model may also be applicable to dry materials but a stiffer measurement system would be required to verify this. The main results are as follows:
1 Layer dilation
Any horizontal motion of the plate involves a dilation of the granular layer:
(i) The vertical position of the plate tends roughly exponentially (Fig. 7) to its asymptotic value over a distance , which is approximately the bead radius. The dilation rate then obeys Eq. (3).
(ii) The total dilation of the layer does not depend on the driving velocity when the plate slides continuously.
(iii) The total dilation of the layer decreases when the normal applied stress is increased.
(iv) The total dilation of the layer scales like the bead size.
2 Frictional force
After a transient, the plate generally slides continuously. The measured frictional force in the steady-state regime is proportional to the normal applied stress (Fig. 4) and does not depend on the driving velocity over the whole velocity range accessible to the experimental setup (Fig. 5). Nevertheless, the existence of a stick-slip motion (Fig. 6) and the response of the granular layer to a static applied stress (Fig. 14) are consistent with a velocity weakening of the granular layer at very small velocity (typically ).
During the transient, while the layer is dilating significantly, the frictional force depends roughly linearly on the dilation rate (Eq. (5) and Fig. 13) and the frictional force reaches a maximum value that increases with the driving velocity (Fig. 11) and increases linearly with the total dilation of the layer (Eq. (4) and Fig. 12).
3 Empirical model
The motion of the plate is approximately governed by the differential equation given by Eq. (1) in which must be replaced by its empirical expression proposed in Eq. 5. The vertical position of the plate obeys Eq. 3. The system of differential equations that governs the time evolution of and can be written:
| (6) | |||||
| (7) |
with the initial conditions:
| ; | (8) | ||||
| (9) |
The initial value of is provided by the experiment. The system of differential equations [Eqs. (7) and (9)] is then integrated numerically using the Runge-Kutta method [12].
In the next section, we discuss the results of our simplified empirical model and compare them to the experimental measurements.
4 Comparison of the empirical model to the experimental results
We show in Fig. 15 the result of integrating the empirical model and comparing it to the experimental data. The model is expected to describe the dynamics of the plate only from B to E. We take as the initial value of its value at B. The model correctly describes the dilation of the layer. However, the agreement between the experimental and the theoretical instantaneous values of the force is imperfect; the small discrepancy is mainly due to the fact that the model Equation (3) does not account for the detailed behavior of in the cycle shown in Fig. (9). Nevertheless, the empirical model is in qualitative agreement with the experimental results and allows one to predict an increase of the maximum frictional force with the total dilation and the driving velocity .
On the other hand, the empirical model cannot describe the very early stage A to B of the plate motion and the response of the granular layer to a static applied stress. Further experimental studies would be required to obtain a complete description of these phenomena. Our experimental setup does not allow us to perform these experiments in its present configuration.
B Comparison to previous work
Both this work and previous studies [3] point out the important role played by the dilation on the frictional properties of the sheared granular material. However, the results obtained at small stress differ significantly from previous experimental results obtained at much larger stress.
To explain these differences, we first summarize the friction law given by Marone et al. [7]. The first law decribes the dependence of the frictional force on the slip velocity and on the surface’s slip history via a state variable [13]:
| (10) |
where is the shear stress, is the normal applied stress, is a constant (which can be understood as the overall frictional coefficient), is an arbitrary reference velocity, and and are two empirical constants. The evolution of the state variable is governed by
| (11) |
where is a characteristic distance over which the frictional force changes following a change in the slip velocity . According to Eqs. (10) and (11), the steady-state value of the frictional force depends on and . The experiments performed at large normal applied stress qualitatively agree with this theoretical description.
We find experimentally that the steady-state value of the frictional force does not depend on the driving velocity at low stress. In the absence of any velocity strengthening or weakening, so that , and the frictional force reads
| (12) |
where we have set because in the steady-state regime. Eq. 12 agrees with the energetic argument (equality of work done and potential energy gain) mentioned in Sec.III.C.3 provided that . We tentatively assume this connection between the state variable and the vertical displacement in our work in order to allow an interpretation of our results in term of their theory. With this assumption the model of Marone et al. leads to . Our experiments performed at small applied stress disagree qualitatively with these results. Indeed, the frictional coefficient is found to increase linearly with the dilation rate (Eq. 5) rather than with . However, in making a comparison one should also note that the normal and tangential forces are applied independently to the granular material in our work, while in Ref. [7], the two are equal.
C Conclusion
The immersion of the material presents several experimental advantages. First, it allows one to work in well-defined conditions and to suppress any variability related to humidity changes. Efforts to eliminate water are rarely adequate because of adsorption. Second, a continuous motion of the sliding plate is observed even at low driving velocity (that is, stick-slip motion is avoided) and an extremely precise study of the steady frictional properties of the granular layer is then possible. The transient behavior that precedes the steady-state continuous motion allows a precise study of the dynamics of the frictional force for granular materials under low stress. A comparison with previous work shows that there are significant differences from the high stress case most relevant to geophysics.
Certainly, there are different physical processes at work at high pressures, where the individual particles can be fractured by the stress and plastic flow may also occur. We hope to obtain additional insight by imaging the granular layer during the motion of the plate. The response of the granular layer on very long time scales to static applied stress, including the slow strengthening of the material in the presence of stress, will be analyzed in a further publication [14]. We believe that our proposed friction law would also apply to dry material at low stress, although further experiments would be required to demonstrate this.
Acknowledgements This work was supported by the National Science Foundation under Grant No. DMR-9704301. J.-C. G. thanks the Centre National de la Recherche Scientifique (France) for supporting the research of its members, that was carried out in foreign laboratories. We are grateful for the collaboration of S. Nasuno, who built the apparatus and developed many of the methods used in this investigation. We appreciate helpful discussions with C. Marone and comments on the manuscript by T. Shinbrot.
REFERENCES
- [1] S. Nasuno, A. Kudrolli, A. Bak, and J. P. Gollub, Phys. Rev. E 58, 2161 (1998).
- [2] S. Nasuno, A. Kudrolli, and J. P. Gollub, Phys. Rev. Lett. 79, 949 (1997).
- [3] C. Marone, Annu. Rev. Earth Planet Sci. 26, 643 (1998).
- [4] C. H. Scholz, The mechanics of earthquakes and faulting, Cambridge, Cambridge Univ. Press (1990).
- [5] B. N. J. Persson, Sliding friction : physical principles and applications, Springer, New York (1998).
- [6] L. Bocquet, E. Charlaix, S. Ciliberto, and J. Crassous, Nature (London) 396, 735 (1998).
- [7] C. Marone, C. B. Raleigh, and C. H. Scholz J. Geophys. Res. 95 7007 (1990); C. Marone, PAGEOPH 137, 409 (1991).
- [8] F. Heslot, T. Baumberger, B. Perrin, B. Caroli, and C. Caroli, Phys. Rev. E 49, 4973 (1994).
- [9] T. Baumberger, F. Heslot and B. Perrin Nature (London) 367, 544 (1994).
- [10] J.F. Brady, J. Chem. Phys. 99, 567 (1993).
- [11] This stick-slip motion of the plate occurs at very slow velocities (typically ), and is the mark of a velocity weakening of the granular layer for small velocity. A detailed study of this regime is in principle possible but would require a very long experimental effort. Here we focus on the continuous motion and on the transient regime at larger velocities.
- [12] W. H. Press, S. A. Teukolsky, W. T. Vetterling, and B. P. Flannery, Numerical Recipes, Cambridge, Cambridge Univ. Press (1992).
- [13] J.R. Rice and J. Gu, Pure Appl. Geophys. 121, 187 (1983).
- [14] J.-C. Géminard, W. Losert, S. Nasuno, and J.P. Gollub, in preparation.