Inter- and Intra-Chain Attractions in Solutions of Flexible Polyelectrolytes at Nonzero Concentration
Abstract
Constant temperature molecular dynamics simulations were used to study solutions of flexible polyelectrolyte chains at nonzero concentrations with explicit counterions and unscreened coulombic interactions. Counterion condensation, measured via the self-diffusion coefficient of the counterions, is found to increase with polymer concentration, but contrary to the prediction of Manning theory, the renormalized charge fraction on the chains decreases with increasing Bjerrum length without showing any saturation. Scaling analysis of the radius of gyration shows that the chains are extended at low polymer concentrations and small Bjerrum lengths, while at sufficiently large Bjerrum lengths, the chains shrink to produce compact structures with exponents smaller than a gaussian chain, suggesting the presence of attractive intrachain interactions. A careful study of the radial distribution function of the center-of-mass of the polyelectrolyte chains shows clear evidence that effective interchain attractive interactions also exist in solutions of flexible polyelectrolytes, similar to what has been found for rodlike polyelectrolytes. Our results suggest that the broad maximum observed in scattering experiments is due to clustering of chains.
I Introduction
Polyelectrolytes are long-chain molecules with ionizable side-groups [1, 2]. In a polar solvent, these ionizable groups can dissociate resulting in localized charges along the backbone of the polymer forming a “macroion”, plus mobile counterions that are no longer permanently bonded to the chain. Due to the long-range nature of the electrostatic interactions, the counterions, though mobile, are not entirely uncorrelated with the macroions. For polyelectrolytes with a sufficiently high charge density along the backbone, some of the counterions remain bound to the chain. This phenomenon is known as “counterion condensation”.
The qualitative theory of counterion condensation has been worked out by Manning [3] for long rodlike polyelectrolytes at infinite dilution. Within the Manning theory, counterion condensation occurs when the distance between charges along the chain is sufficiently small (i.e. the charge density is sufficiently high) compared to the length scale set by the electrostatic interactions ( being the charge, the dielectric constant and the thermal energy). Counterions continue to condense onto the macroions, resulting in a renormalized charge density along each chain, until the effective average charge separation equals .
Manning’s theory provides a lucid picture for understanding counterion condensation, but its simplicity invites more complex questions. For example, it is not clear how the qualitative features of the theory would be modified by having flexible chains. Equally unclear is how the essential results of the theory can be generalized to nonzero concentrations instead of just at infinite dilution. Recent experiments [4, 5, 6], theories [7, 8, 9, 10] and simulations [11, 12] have attempted to address some of these issues, but no consistent picture has yet emerge.
Another issue related to counterion condensation concerns the possibility of attractive interactions between two or more like-charged chains. There is now convincing evidence, both numerical [13] and analytical [14], that attractive interactions can exist between rodlike polyelectrolytes with the same charge. This attraction is mediated by the fluctuating charge density along the rods created by the condensed counterions when they move on and off the rods, leading to an effective van der Waals-like interaction. But the same question for flexible polyelectrolyte chains is still open. Since flexible chains can undergo conformational changes as the degree of counterion condensation changes and deviation from linearity in turn affects the degree of counterion condensation, these two factors become highly convoluted and their net effects on the attractive interaction is unclear.
This paper will try to address some of the issues raised here for solutions of flexible polyelectrolytes at nonzero concentrations. The complexity of the problem demands a careful treatment of the relevant microscopic interactions involved. Computer simulations provide a simple way to study the problem without resorting to approximate methods such as the Debye-Hückel or other mean field theories. In the simulations described below, all counterions in the solution as well as charges on the macroions are handled explicitly, with the full unscreened coulombic interactions among them. The method we used is similar to those in other computer simulations reported recently [11]. While the focus of the previous studies has been on chain structure and single-chain properties, the present study concentrates on inter- and intra-chain interactions.
II Model and Simulation Method
In our simulations, each polyelectrolyte chain is represented by a bead-spring model with monomers. Every monomer has unit charge . We employ cubic periodic boundary condition, with polymer chains inside the simulation box of dimension . In this study, we have considered only solutions with monovalent counterions of charge and no added salt; therefore, the number of counterions necessarily equals , due to charge neutrality. No explicit solvent molecules are included in the simulations. The solvent is represented by a dielectric continuum. The particles interact with each other through a coulombic potential, renormalized by the dielectric constant . In addition to the coulombic interaction, every pair of particles has an excluded volume interaction, represented by a purely repulsive truncated and shifted Lennard-Jones (RLJ) potential
| (1) |
The monomer size is approximately . We measure all lengths in units of and all energies in units of . The connectivity of the chains is maintained by the finitely extensible nonlinear elastic (FENE) potential [15]:
| (2) |
which defines the spring potential between consecutive monomers along the chain. We set and to ensure essentially no bond crossing. We assume the polyelectrolyte backbone is in a good solvent, therefore no explicit solvent-polymer interactions has been included. This model as well as the parameters are essentially identical to those used in previous simulations by Stevens and Kremer [11].
Special handling of the coulombic interaction is necessary in a solution with finite concentration. The minimum image convention is usually sufficient for short range interactions, but the long range nature of the coulomb potential causes a pair of charges to interact far beyond their first periodic image. The Ewald summation method properly accounts for such contributions from all the images, but its implementation generally requires extensive computation. An efficient alternative is the tabulated Ewald method with interpolation [16] which we have used in the present study. This allows us to treat arbitrarily high concentrations with high efficiency and without approximation.
The scale of the charge-charge interaction is set by the Bjerrum length . The simulations have all been carried out at a constant temperature . The Bjerrum length can be varied by changing the dielectric constant . For the results reported below, varies between 0.83 and 6.7 . Using the fact that the Bjerrum length in water at 25 oC is about 7.1 Å, the typical range of in an aqueous solution would be approximately 1 to 2 if the monomer size is taken to be roughly 4 to 8 Å.
We employ standard molecular dynamics (MD) methods [17] for the simulation. To carry out constant temperature dynamics, either Brownian dynamics [18] or stochastic collision [19] can be used. We have found stochastic collision to be more efficient, because it generally generates a faster relaxation time for the polymer configurations [20]. In our simulations, we assign new velocities to all the particles from a Maxwell-Boltzmann distribution every 100 to 1000 MD time steps.
The dynamics of the system is performed using the Verlet leap-frog/central difference algorithm at a time step of where . To ensure full equilibration, the simulations were run long enough such that the chains move at least six times their contour lengths. This required anywhere from 250,000 to 4,000,000 time steps for most systems studied.
We have studied multi-chain systems at three different monomer number densities: = , and , with various chain lengths = 16, 24, 32, and 48. The system sizes are chosen so that the contour length of each chain does not exceed half of the box length. This translates to 12 chains for =16, 10 for =24, 6 or 9 chains for =32, and 6 for . These systems are all well below the overlap density. We have also performed extensive simulations with 27 chains at the above densities with .
III Results and Discussions
A Counterion Condensation
Counterion condensation is difficult to quantify directly. Counting the number of counterions within a certain distance from the polyelectrolyte is a possible though not very precise measure since the macroion can have influence on a counterion far away from the chain due to the long-range nature of the coulomb potential. As an alternative, the osmotic pressure has often been used, both experimentally and theoretically, as an indirect measure of the degree of counterion condensation. To truly determine the degree of counterion condensation though, it is necessary to study the correlation between the motions of the counterions and that of the macroion. This is best done by examining the velocity correlation between the counterions and the chain.
In lieu of measuring the velocity cross-correlation, there is a simpler alternative for quantifying counterion condensation. We can measure the diffusion coefficient of the counterions instead. If the chains are massive, they diffuse slowly. Therefore, if the motions of the condensed counterions are correlated to the chains, they would exhibit a substantially reduced diffusion coefficient too. Measuring the diffusion coefficient of the counterions is in principle easy, at least theoretically, and this provides an accurate estimate of the degree of counterion condensation. In the limit where the uncondensed counterions are essentially ideal, i.e. assuming that they do not interact with each other strongly, should be simply proportional to the number of uncondensed counterions. The counterion diffusion coefficient can also be related to the mobility of the counterions via the Einstein relationship.
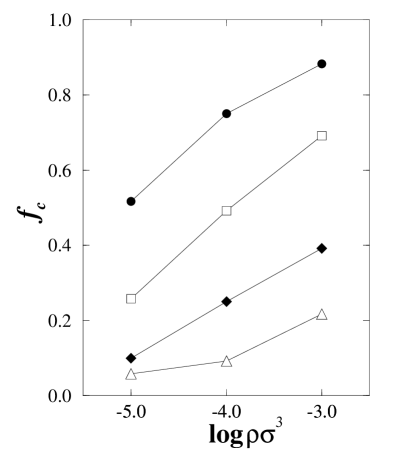
The counterion diffusion coefficients are shown in Fig. 1 for various Bjerrum lengths at the three different concentrations studied, closed triangles for = , open squares for and closed circles for . In order to estimate the intrinsic mobility of the counterions in the absence of counterion condensation, we have also run the simulations at these three concentrations for various without the macroions. The dashed line in Fig. 1 indicates this intrinsic diffusion coefficient , which was found to be independent of for this concentration regime and roughly independent of also. The open circle at =0 indicates the diffusion coefficient obtained for a system with the coulombic interactions turned off, providing another independent estimate for the intrinsic diffusion coefficient in the absence of counterion condensation.

As expected, decreases with increasing , signaling an increasing counterion condensation. For the lowest concentration studied = (triangles in Fig. 1), the dependence is apparently linear, and this linearity appears to extend throughout the entire range of studied. For still larger values of which we have not studied, this linearity is expected to eventually give way to a faster than linear decrease, since obviously cannot be less than zero. For the two higher concentrations, the dependence deviates from linearity sooner, but the basic features are the same.
There is no sharp break in the dependence on . This suggests a behavior qualitatively different from that predicted by Manning theory. Manning theory suggests that there is some critical value of below which no condensation occurs. For the model used here, , the mean distance between charges on the chain, is 1. According to Manning theory, the onset of counterion condensation should then occur at = 1. However, we observe in Fig. 1 that for all concentrations, the dependence of on does not exhibit any break at near 1 or at any other value.

This departure from Manning theory is likely a result of the flexibility in the chain conformation, which in turn is strongly dependent on the degree of counterion condensation. As we will show in Sect. III B, the structure of flexible polyelectrolytes are not always extended, and this affects the validity of the arguments behind Manning theory, which was originally formulated for long rods.
Using the simulations, we can examine other qualitative aspects of Manning theory. For example, one can study the condensation of counterions onto partially-charged polyelectrolyte chains. The results presented in Fig. 1 are for fully-charged chains, i.e. every monomer on the backbone is charged. We have also examined partically-charged chains. By charging only certain fractions of the monomers, we simulated solutions of chains with different charge fractions . The condensation of counterions was again quantified by measuring the counterion diffusion coefficients . According to Manning theory, counterion condensation will continue until the renormalized charge fraction (charge of the backbone minus the charge of the condensed counterions divided by the number of monomers) on the chain is such that the average charge separation is equal to the Bjerrum length . Consequently, Manning theory predicts that the renormalized charge fraction as a function of the charge fraction of the bare chain would exhibit a saturation behavior. Figure 2 shows how depends on for three different concentrations at = 1.7. From these data we can determine the number of condensed counterions and compute the renormalized charge fraction . Figure 3 shows extracted from results in Fig. 2 plotted as a function of . For this set of parameters, the renormalized charge fraction should saturate at 0.6 according to Manning theory. But the data show no such saturation. Instead, the renormalized charge fraction seems to increase monotonically for all concentrations studied.

Our observation that there is no saturation in the renormalized charge fraction is consistent with the analytical theory of Liu et al. [10] for finite-length polyelectrolyte rods in a poor solvent. However, a recent small-angle X-ray and neutron scattering experiment [6] seems to suggest that saturation does occur, in support of Manning theory. This experimental conclusion was based on the assumption that the peak observed in the scattering amplitude arose from a correlation tube of the size of the Debye-Hückel screening length around each chain. Since the screening length is thought to depend on the concentration of free counterions, it was argued that the position of the scattering peak could be used to determine the renormalized charge fraction on the chains. In Sect. III C, we will show that this interpretation may be incorrect.

The counterion diffusion coefficient in Fig. 1 are replotted in Fig. 4 as a function of concentration for the four different Bjerrum lengths studied. At each , there is a steady decrease in with increasing concentration, indicating that counterion condensation increases with increasing concentration. Again, the dependence is smooth, without any abrupt changes or any signs of a critical transition point. Our results are qualitatively consistent with the experimental measurements of counterion self-diffusion coefficients using pulsed field gradient NMR techniques in the low concentration region [21]. From these data, we can directly determine the fraction of counterions condensed onto the chains. This is shown in Fig. 5 as a function of concentration for the four different studied. Clearly, the number of counterions condensed is not only a function of the Bjerrum length, but also a strong function of concentration.

B Single-Chain Conformations and Intrachain Attractions
We have studied the single-chain structure at various concentrations and Bjerrum lengths for a number of different chain lengths . The equilibrium averaged squared radii of gyration are shown in Fig. 6 for four different Bjerrum lengths. Data for the three different concentrations are displayed, with triangles for = , squares for and circles for . For all three concentrations, the data fall on straight lines on a log-log plot for all studied, indicating that the chain lengths from the shortest one with on are all in the scaling limit. For comparison, we have also shown the squared radii of gyration for neutral chains at infinite dilution as dashed lines in Fig. 6. For all lengths studied, the charged chains are substantially larger than the neutrals.
From the slopes of the lines in Fig. 6 we can extract the exponent in the scaling relationship , and their values are shown in Table I. For the lowest concentration = , the chains are fully extended with for all . For the intermediate concentration = , the chains are still fairly extended, with a slight variation in going toward larger .
For the highest concentration = , however, the variation in the exponent is quite substantial. For the smallest = 0.83, 0.85, indicating a semi-extended chain structure. But at the largest = 6.7, 0.48, indicating a globular structure with a scaling exponent that is actually smaller than a gaussian chain. In between these two extremes, there is a consistent decrease in , suggesting that the size of the chain decreases steadily toward more globular structures. Figure 7 shows examples of chain conformations at = for different Bjerrum lengths, illustrating the progression from a semi-extended structure to a globular structure in accordance with the variation in . Though the scaling indicates an exponent smaller than gaussian behavior for TABLE I.: Scaling exponents for at various Bjerrum lengths and concentrations. 0.833 0.84 0.98 1.0 1.667 0.77 0.99 1.0 3.333 0.62 0.94 1.0 6.667 0.48 0.82 1.0 large values of , it is important to remember that the absolute size of the charged chains are larger than the neutrals (dashed lines in Fig. 6).
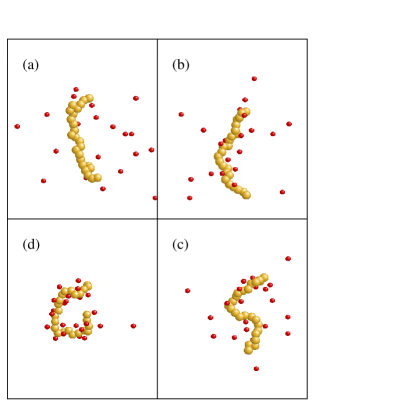
Recent studies of effective attractive interactions between like-charged polyelectrolytes have considered only rigid rods [13, 14] where the issue of intrachain attraction did not come up. A natural extension of these studies is to ask whether an effective attractive interaction also exists between different parts on the same chain, and if it does, whether its nature is identical to the interchain interactions. The globular structures shown in Fig. 7 for large Bjerrum lengths suggest the existence of attractive intrachain interactions. This is corroborated by the smaller-than-gaussian scaling exponent observed. Compared to the extended structures at small , the higher globular structures are more contorted, with a larger number of bends. The same behavior has also been observed in a previous simulation of flexible polyelectrolytes [11]. The explanation ascribed to it was that increasing counterion condensation at larger screened the intrachain repulsion in such a way that the structure of the chains went from being fully extended to that of an essentially neutral polymer. But the scaling evidence from the present work goes beyond this assertion and suggests the presence of an attractive interaction causing the chains to attain a structure even more compact than that of a neutral polymer. This collapse of the chain agrees qualitatively with the recent results of Winkler et al. [12]
Having established the presence of an attractive intrachain interaction, the next question is whether this attractive interaction has the same origin as the interchain attraction observed in polyelectrolyte rods. This is a difficult question to answer. Interchain attraction can arise from the charge fluctuations along the backbone of the rods as condensed counterions come on and off the rods. But this is not the only mechanism possible. Ray and Manning recently suggested that two like-charged rods can share counterions in such a way to form what is analogous to a covalent bond [22]. The effective distance scale of this covalent-like interaction is predicted to be of the order of the Debye-Hückel screening length, which is much longer than the intrachain distance here. Therefore, the first mechanism is more likely to be correct for the attractive intrachain interactions. However, more work is necessary to fully elucidate the origin of the intrachain attraction.
The attractive interactions are evident only for solutions with very large Bjerrum lengths. For smaller , the chains are apparently well extended. For these cases, the intrachain attractions, if present, are not strong enough to overcome the coulombic repulsion between different parts of the same chain.
C Interchain Interactions
The most straightforward way to determine whether interchains attraction exists is to calculate the free energy as a function of the separation between two chains. Theoretically, this could be done by an umbrella sampling procedure [23] or by computing the potential of mean force of separating two chains [24]. Unfortunately, due the long-range nature of the coulomb potential, both of these methods suffer from heavy statistical noise. Compounded by the need to deal with a finite polymer concentration (i.e. multiple chains), these direct methods are not always very useful in practice.
An alternative is to monitor the radial distribution function of the centers-of-mass of the polyelectrolyte chains. The logarithm of is related to the free energy of separating a pair of chains, so by monitoring we can obtain information equivalent to those given by direct calculations of the free energy. From sufficiently long MD simulations carried out at equilibrium, an accurate determination of the radial distribution function is not too difficult.
The data we will show were obtained from very long simulations of chains with monomers at many different concentrations and Bjerrum lengths. These chains are shorter than those used for obtaining the results shown in the last two subsections. The motivation for this was to enhance the statistics in the calculations by putting more chains in the simulations, but reducing the size of each chain to keep the computation at a manageable level. We have also run calculations at a number of different combinations of and larger . The results are all qualitatively identical to those shown below for and .
Figure 8 shows the radial distribution function as a function of the center-of-mass separation between chains for a very small Bjerrum length . The simulations were carried out for three different concentrations by varying the size of the simulation box : = ( = 300), ( = 139) and ( = 64).

Although we have used very long runs to extract the functions, there is still substantial statistical noise in the data. We have indicated the size of the statistical noise by error bars which represent one standard deviation from the mean. Despite this, some of the minor peaks and valleys in may not be significant. So we will rely on the gross features of to draw our conclusions.
For the lowest concentration ( = 300), is fairly featureless with two broad humps. There is a correlation hole for distances smaller than roughly , indicating that chains cannot come closer together by distances much smaller than . Beyond that, there is a fairly constant density. Apparently, for this at this concentration, the polyelectrolyte chains behave very much like particles with an effective radius of approximate . Because there are 27 chains in the periodic box of length , happens to be the dimension of the average volume available for each chain. So the effective radius of deduced from the appears to be a result of a net repulsive interaction pushing chains away from each other to fully fill the volume available. It is important to point out here that the radius of gyration of the chains are much shorter than the dimension of the correlation hole and the concentrations studied here are all well below the overlap density. Incidentally, the Debye-Hückel screening length for these conditions is also roughly . Therefore, it is also possible that the correlation hole in may be related to the screening length instead. That this is actually not the case will be evident from data to be presented below.
Now turning to the intermediate concentration = ( =139), we observe similar behavior as for the lower concentration. This time, the dimension of the correlation hole shrinks to about , which again is about 1/3 of . Beyond this, is again rather featureless, indicating an essentially structureless solution of chains with repulsive interactions.

Next, we examine the highest concentration = ( = 64). shows a distinct peak in the short-distance region. Beyond that, has the generally featureless appearance similar to the last two concentrations. Based on the observations in the previous two cases, we expect the dimension of the correlation hole to be at 1/3 the box size, namely around . But the left edge of now stands at approximately . These facts together indicate that the peak at small distance is a new feature not present in the previous cases, and the left edge of does not actually correspond to the dimension of the correlation hole. The origin of this new feature will become clear below.
In Fig. 9, we show the same data for a larger = . For the lowest concentration, a similar is observed here compared to the one at the smaller Bjerrum length in Fig. 8. Notice that the dimension of the correlation hole has not changed, although the screening length is smaller for = than it is for in Fig. 8 by a factor of . So the size of the correlation hole is apparently unrelated to the Debye-Hückel screening length.
The size of the correlation hole appears to be more closely related to the polymer concentration instead of the screening length. Essentially the same conclusion can be inferred from the study of Stevens and Kremer [11], which showed that in the very low concentration regime, the position of the peak in the structure factor scales with the polymer concentration to a power of approximately 1/3. In this very dilute regime, the peak in the structure factor is entirely due to the correlation hole in ; therefore, the size of the correlation hole should scale with the polymer concentration to a power of . This is corroborated by our observations here that the correlation hole shrinks by a factor of roughly 2 when the density decreases by a factor of 10.
The fact that the size of the correlation hole has no apparent relationship to the screening length has important implications for the small-angle X-ray and neutron scattering experiments [6] referred to in Sect. III A. Our results suggest that the arguments used in the experiments in arriving at the conclusion that the counterion condensation saturates at a certain renormalized charge fraction is wrong, i.e. the size of the correlation hole extracted from the peak in the scattering intensity may have nothing to do with the screening length at all.
For the intermediate concentration in Fig. 9, there appears to be an extra feature for distances smaller than the expected size of the correlation hole ( as in Fig. 8) just like in the highest concentration in Fig. 8. Given the size of the statistical noise and the quality of the data, we are uncertain about the significance of this feature. But the same feature will become more prominent in the data to be shown below. So we skip to the highest concentration.
For the highest concentration in Fig. 9, the feature observed previously for = is now much more pronounced. There is now a sharp peak at . This peak is indicative of some kind of clustering of two or more chains at short distances. By integrating under this peak, we can estimate the average number of neighbors each chain has. This turns out to be approximately 0.41. This is strong evidence that there exists an attractive interaction between chains, causing them to cluster with each other. Indeed, if we examine the configurations, we observe a small number of chains pairing up. These pairs appear to be true equilibrium structures, because they would dissolve and reform continually, even in cases where the short-distance peak in cannot be clearly resolved. For example, the integrated peak height in the radial distribution function up to is plotted in Fig. 10 for = and = , indicating that the clustering is a transient but equilibrium phenomena.

Figures 11 and 12 show the same data for two larger Bjerrum lengths = and . For the two highest concentrations, the sharp peak at short distance continues to grow in intensity. The feature that was barely visible for the intermediate concentration in Fig. 9 is now fully developed. The rise in the short-distance peak indicates that more chains are clustering as either the concentration or the Bjerrum length or both increase, implying that the attractive interactions grow in strength at the same time. The rising peak in suggests that more chains are participating in these clusters. Again, by integrating under the short-distance peak in , we TABLE II.: Average number of neighbors around each chain obtained from integrating under the first peak in the radial distribution function up to cutoff distance . 9.75 0.867 0.29 1.667 0.41 3.333 1.69 6.667 1.88 25.5 0.867 0.32 1.667 0.39 3.333 0.74 6.667 0.58 can estimate the average number of neighbors each chain has, and the results are tabulated in Table II for the two highest concentrations. For instance, the peak in for and concentration indicates that each chain has approximately 1.8 neighbors on the average within a distance of around it.


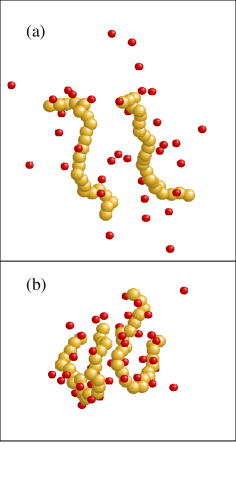
Notice that in spite of the sharp peak observed at short distance, there are no other distinct secondary peaks. If a large number of chains come together to form a large-scale structure, there would have been second and third neighbor peaks evident in . The absence of these peaks suggests that most of the intensity under the sharp peak at short distance is in fact due to small clusters, in agreement with the data in Table II. Indeed, a visual examination of the configurations indicates that most of the chains are forming pairs or triplets. Examples of pairs are shown in Fig. 13. The precise reason for the absence of larger clusters is not clear at this point. There are several possibilities: (a) Some special feature of the attractive interchain interaction causes chains to form small clusters but precludes the creation of larger clusters; (b) The number of chains used in the simulations is too small to accurately reflect the presence of large-scale structures; or (c) The lengths of our simulations are not long enough for the true equilibrium large-scale structures to emerge. Larger simulations are needed to determine the actual reason for the apparent absence of large clusters.
Also interesting is the dependence of the position of the small-distance peak. This is most clearly seen for the highest concentration. Starting from = , the peak position shifts consistently to smaller values, from about to at = . A similar trend can be seen in data for the intermediate concentration.
The data in the radial distribution function demonstrate unequivocally that attractive interchain interactions do exist in solutions of like-charged flexible polyelectrolytes. The strength of this attraction also grows with polyelectrolyte concentration and the Bjerrum length. These attractive interactions lead to clustering of chains, which should be observable in neutron and light scattering experiments. Indeed, it has been suggested that the broad peak detected in recent neutron and light scattering experiments [4] at small wavevectors may actually be related to the formation of clusters or domains [5].
To verify the connection between the short-distance peak observed in the polymer center-of-mass radial distribution function and the broad low-wavevector peak detected in the scattering intensity, we can compute the structure factor from the simulation data and compare them to the experiments. Unfortunately, due to the small size of the simulation box used, the number of allowed wavevectors dictated by the periodic boundary condition we have used is extremely sparse at the low-wavevector region. Instead of Fourier transforming the monomer density directly to get , we first computed the monomer-monomer radial distribution function and then from it using the formula , where is the Fourier transform of and is the monomer density. We have compared the computed this way with a direct Fourier transform of the density, and found the qualitative features to be identical.

Using the monomer radial distribution function offers another advantage. It allows us to separate the inter- and intra-chain contributions to the total scattering intensity. Figure 14 shows the total monomer for and . Clearly, the total (intra-chain plus inter-chain) is dominated by the intrachain correlations at short distance. The inset shows only the inter-chain contribution to at a much expanded scale as the solid line. Also in the inset, superimposed on the monomer is the polymer center-of-mass for the same and concentration taken from Fig. 9. Clearly, the interchain contribution to closely resembles the polymer we discussed earlier. From the interchain contribution to , we can then compute the part of the structure factor that arises solely from the interchain correlation, and this is shown in Fig. 15. The shows a broad peak with a maximum at . By truncating the Fourier integral at different upper limits, we can verify directly that the peak in is essentially due to the first and second peaks in . We found similar results for all other concentrations and Bjerrum lengths.

Although we have correlated the peak in the structure factor to the attractive short-distance peak in the polymer , the accuracy of our data precludes a reliable determination of how scales with the polymer concentration. The reason for this is that although we have seemingly circumvented the problem of the sparseness of the allowed wavevectors by analyzing the monomer radial distribution function, the periodicity in principle does not permit us to extract real independent information about for wavevectors which do not correspond to reciprocal vectors of the cubic boundary condition we employ. If the actual peak lies between two reciprocal vectors, we would not be able to accurately measure its position. Given the size of the simulation box we have used for these calculations, the reciprocal vectors are certainly too sparse. A much larger simulation would be required for a direct comparison with experimentally obtained scattering intensities.
Finally, we can compare the general characteristics of the attractive interactions seen in our simulations of flexible polyelectrolytes with those of the rigid rods observed in previous theoretical work [13, 14]. First, the attractive interactions between the flexibles are strongly concentration dependent whereas for the rods they exist even for infinite dilution. This is not really very surprising, given the fact that the attractive interactions are results of charge fluctuations due to the condensed counterions. For infinite rods, condensation could occur even at zero concentration, but for flexibles it could not. The degree of counterion condensation for flexibles increases with concentration, and so should the strength of the attractive interactions. Secondly, the distance scale of the attractive interactions seems to be very different in the flexibles compared to the rods. For rods, previous calculations show that the attractive interactions are very short-ranged, of the order of 10 or 20 Å. For the flexibles, if we assume a monomer size of roughly 4 Å, the typical position of the peaks observed in from Figs. 8 to 12 would be anywhere from 30 to 100 Å, depending on the concentration and the Bjerrum length. On the other hand, these distances scales are very much in accord with those suggested by neutron and light scattering experiments [4, 5, 6].
IV conclusions
We have carried out detailed molecular dynamics simulations to study inter- and intra-chain interactions in solutions of flexible polyelectrolytes at nonzero concentrations with no added salt. The simulations were performed with explicit counterions and unscreened coulombic interactions. Specifically, we investigated questions related to the existence of effective attractive interactions as well as the nature of counterion condensation at finite concentration.
From the counterion self-diffusion coefficient, we were able to determine how counterion condensation depends on both the Bjerrum length and the polymer concentration. The data revealed a condensation mechanism that is distinctly different from that predicted from Manning theory. Specifically, we observed no saturation in the renormalized charge fraction on the chains which appeared to be a smooth function of the Bjerrum length as well as the polymer concentration.
From the scaling of the mean squared radii of gyration with the chain length, we extracted the scaling exponent under a number of different conditions with various Bjerrum lengths and concentrations. For large Bjerrum lengths and high polymer concentrations, a scaling exponent smaller than a gaussian chain was observed, indicating that the chains had a more compact structure than ideal chains. In conjunction with a visual examination of the chain conformations, we concluded that the compact structures are results of attractive interactions between different parts of the same chain.
To ascertain the presence of attractive interchain interactions, we have studied in great detail the radial distribution functions of the centers-of-mass of the chains in solution. We found a peak at small distances in the radial distribution function for high Bjerrum lengths and/or high concentrations. From the lack of secondary peaks in the radial distribution function and a careful examination of the chain configurations, we concluded that this peak is a result of small domains formed by chains clustering in the solution. This behavior is indicative of the presence of strong interchain attractions. From the structure factor, we have directly verified the connection of the small-distance peak in the polymer radial distribution with the broad peak detected at small wavevectors in the experimental small-angle X-ray and light scattering intensities.
ACKNOWLEDGMENTS
Throughout this work, we benefited from numerous enlightening discussions with Andrea Liu and Eric Amis. This research has been supported in part by the National Science Foundation under grants CHE-9528121 and CHE-9257094. CHM is a NSF Young Investigator, a Camille and Henry Dreyfus Foundation Camille Teacher-Scholar and a Alfred P. Sloan Foundation Fellow. Computational resources have been provided by the IBM Corporation under the SUR Program at USC.
REFERENCES
- [1] F. Oozawa, Polyelectrolytes (Marcek Dekker, New York, 1971).
- [2] J.L. Barrat and J.F. Joanny, Adv. Chem. Phys. 94, 1 (1996).
- [3] G.S. Manning, J. Chem. Phys. 51, 954 (1969).
- [4] M. Sedlak and E.J. Amis, J. Chem. Phys. 96, 826 (1992); B.D. Ermi and E.J. Amis, Macromolecules 30, 6937 (1997).
- [5] B.D. Ermi and E.J. Amis, (preprint).
- [6] W. Essafi, F. Lafuma and C.E. Williams, (preprint).
- [7] M. Mandel, in: Polyelectrolytes, M. Hara, Ed. (Marcel Dekker, New York, 1993).
- [8] M. Muthukumar, J. Chem. Phys. 105, 5183 (1996).
- [9] J.P. Donley, J. Rudnick and A.J. Liu, Macromolecules 30, 1188 (1997).
- [10] R.M. Nyquist, B.-Y. Ha and A.J. Liu, (preprint).
- [11] M.J. Stevens and K. Kremer, J. Chem. Phys. 103, 1669 (1995).
- [12] R.G. Winkler, M. Gold and P. Reineker, Phys. Rev. Lett. 80, 3731, (1998)
- [13] N. Gronbech-Jensen, R.J. Mashl, R.F. Bruinsma and W.M. Gelbart, Phys. Rev. Lett. 78, 2477 (1997).
- [14] B.-Y. Ha and A.J. Liu, Phys. Rev. Lett. 79, 1289 (1997).
- [15] R.C. Armstrong, J. Chem. Phys. 60, 724 (1974).
- [16] M.J. Sangster and M. Dixon, Adv. Phys. 25, 247 (1976).
- [17] M.P. Allen and D.J. Tildesley, Computer Simulation of Liquids (Oxford, New York, 1987).
- [18] M.P. Allen, Mol. Phys. 47, 599 (1982).
- [19] H.C. Andersen, J. Chem. Phys. 72, 2384 (1980).
- [20] B.Y. Drovetsky, J.C. Chu and C.H. Mak, J. Chem. Phy. 108, 6554 (1998).
- [21] F.J.M. Schipper, K. Kassapidou and J.C. Leyte, J. Phys. C 8, 9301 (1996); F.J.M. Schipper, J.G. Hallander and J.C. Leyte, J. Phys. C 9, 11179 (1997).
- [22] J. Ray and G.S. Manning, Langmuir 10, 2450 (1994).
- [23] G. Torrie and J.P. Valleau, Chem. Phys. Lett. 28, 578 (1974).
- [24] D. Chandler, Intro. Modern Stat. Mech. (Oxford, New York, 1989).