Calculations of the A1 phonon frequency in photoexcited Tellurium
P. Tangney and S. Fahy
Department of Physics, University College, Cork, IRELAND.
ABSTRACT
Calculations of the A1 phonon frequency in photoexcited tellurium are presented. The phonon frequency as a function of photoexcited carrier density and phonon amplitude is determined. Recent pump probe experiments are interpreted in the light of these calculatons. It is proposed that, in conjunction with measurements of the phonon period in ultra-fast pump-probe reflectivity experiments, the calculated frequency shifts can be used to infer the evolution of the density of photoexcited carriers on a sub-picosecond time-scale.
PACS numbers : 78.47.+p, 63.20.-e, 63.20.-Kr, 63.20.Ry
During the last decade, continuing advances in ultra-fast laser technology have made possible time-domain studies of coherent phonons on ever shorter time scales [1, 2]. In pump-probe experiments it has been possible to excite a high density of electrons in a semiconductor on a timescale much smaller than the lattice vibrational period and detect the resulting motion of the ions by observing oscillations in the optical reflectivity [3]. In certain materials, femtosecond laser pulses may be used to excite electrons from bonding into antibonding states, thereby depleting the bond charge and changing the equilibrium positions of the atoms; the atoms then oscillate about their new equilibrium — a mechanism know as “displacive excitation of coherent phonons” (DECP) [4]. At very high excitation densities, the bonds may be weakened and the resulting motion has a frequency lower than that observed in conventional Raman scattering.
In recent femtosecond pump-probe experiments, Hunsche et al. [3] reported a linear decrease of the tellurium phonon frequency and an increase of the phonon amplitude with pump fluence. Their results show a cosine time-dependence of the optical reflectivity oscillations as a function of pump-probe delay, which is characteristic of a displaced equilibrium. Moreover, they observed that at high excitation densities the periods of successive single cycles of the oscillations after the pump-excitation tended to decrease.
In this Letter, we calculate from first principles the dependence of the Te phonon frequency on the density of excited electrons, thus opening the possibilty of using the measured shift in phonon frequency to probe local electron-hole plasma density on a sub-picosecond timescale. We calculate the dependence of frequency and equilibrium bondlength on excitation density. We also calculate the initial phonon amplitude as a function of excited electron density, within the DECP mechanism. Finally, we calculate the amplitude dependence of the phonon frequencies and predict a significant anharmonicity of the phonon at very high carrier densities.
If a laser pulse of duration much shorter than the timescale of the ionic motion is incident on a crystal, then an effectively instantaneous photoexcited carrier distribution is created. Initially, the electron and hole distributions will be non-thermal but carrier-carrier scattering [5, 6, 7] will result in a thermal (Fermi-Dirac) distribution of electrons and of the holes in much less than 100 fs, the time-scale of phonon motion. However, electron-hole recombination, resulting in a common chemical potential for electrons and holes, occurs on a time-scale of approximately 1 ns, which is much longer than the phonon period. Although some of the carrier energy will be lost to the lattice by carrier-optical-phonon scattering, we will assume that, within the timescales considered here (less than several ps), this effect is negligible.
With these physical time-scales in mind, we assume in the present calculations that follow that no electron-hole recombination occurs during phonon oscillations. There will then be a constant density of electrons in the conduction bands (with an equal density of holes in the valence bands). A Fermi-Dirac distribution of each carrier type is assumed but the chemical potential for electrons and for holes are not equal. (Previous theoretical investigations [8, 9, 10, 11] of short-time phonon dynamics in systems subjected to electronic excitation by ultrashort laser pulses have assumed, for technical reasons, that the chemical potential for electrons and for holes are equal; this is physically equivalent to assuming that the electron-hole recombination time is much shorter than the phonon period.)
The stable form of tellurium at low pressure is -Te, in which two-fold coordinated tellurium atoms form infinite helical chains parallel to the -axis of the trigonal P3121-D structure [12]. The three atoms per unit cell are at (x0,0x,0) and form a single, complete turn of a helical chain. Each helix is surrounded by six equidistant helices and each atom has four second-nearest neighbours in these adjacent helices. The atomic position free parameter is equal to the ratio of the radius of each helix to the interhelical distance.
The experimentally determined equilibrium value of is = 0.2633 0.0005 and the room-temperature lattice constants are a = 4.4561 Å and c = 5.9271 Å. At these values, the bond length is 2.834 0.002 Å, the bond angle is 103.2 0.1∘, and the second-nearest neighbour distance is 3.494 Å [12].
The motion of atoms in the A1 phonon mode corresponds to a variation of the helical radius , maintaining the symmetry of the crystal. We note that the equilibrium value of is not determined by symmetry, and so may be expected to change in the photoexcited material, allowing DECP excitation of this mode.
At the special value, , the nearest and second-nearest neighbour distances become equal, the atomic coordination number increases to six, the helical chain structure is destroyed, and the structure can be classified as rhombohedral, with space group Rm-D and one atom per unit cell. The high-pressure -Te form of tellurium, which is stable above kbar, has this structure [12]. The -Te structure may be viewed as a Peierls distortion of the -Te structure, as we shall see below.
We have calculated structural total energies as a function of the symmetry phonon displacement and determined the vibrational frequency using the “frozen phonon” method [13]. The total energy is calculated using standard density functional theory (DFT) methods, but with a constrained total occupation of the conduction bands, representing a semiconductor at a fixed electron-hole plasma density. Although this represents a departure from the usual finite-temperature DFT, it is a physically appropriate representation of the system on time-scales much less than the electron-hole recombination time. In general, the use of LDA band energies for excited states is complicated by the fact that the true (quasi-particle) excitation energies are not equal to the DFT eigenvalues. However, in this system the LDA gap (0.26 eV) is not too much different from the experimental band gap (0.33 eV [14]) and the band dispersions within the LDA conduction and valence are very similar to the experimentally determined dispersions [15]. Thus, the approximation of using the LDA excited bands to calculate the total energy of the photoexcited system is reasonably accurate in the present context.
We have calculated the phonon frequency for values of the electron-hole plasma density corresponding to a range of the valence electrons excited into the conduction bands, and for a range of electron temperatures up to eV. We find the electron temperature has a negligible effect on the phonon frequency. This insensitivity to temperature suggests that the results we have obtained are not strongly dependent on the assumption of a thermal distribution of carriers; the dominant effect on the phonon frequency is simply the number of carriers excited to the conduction (anti-bonding) states, and not their precise distribution within those states.
Total energy calculations were performed using the plane-wave pseudopotential method of Ihm, Zunger and Cohen [16], with Hamann, Schlüter and Chiang [17] pseudopotentials and the local density approximation (LDA) exchange-correlation potential of Ceperley and Alder [18]. Plane waves up to energy cutoffs of 16 Ryd and 49 Ryd were used in the expansion of the wavefunctions and the charge density, respectively. Self-consistent potentials, total energies and electronic densities of states were calculated using a regular 10x10x10 grid in the full Brillouin zone (124 k-points in the irreducible zone). States in the valence bands (i.e., bands 1-9) at each k-point were weighted by the Fermi-Dirac distribution with a temperature and a chemical potential . The value of is chosen to ensure the correct number of holes in the valence bands, corresponding to the appropriate electron-hole density. Similarly, the states in the conduction bands (i.e., bands 10 and above) were filled according to the Fermi-Dirac distribution with temperature and chemical potential . In all calculations, we have used the experimentally determined room temperature lattice constants.

Fig. 1 shows the structural energy as a function of for excited carrier densities ranging from to of the valence electron density. The ground state equilibrium value of is found to be 0.2686, approximately larger than the experimental value of 0.2633. The frequency of oscillation about this minimum was calculated as 3.24 THz, smaller than the value obtained in conventional Raman scattering of 3.6 THz. This accuracy is typical of LDA calculations for such materials [19, 14].
The maximum at in Fig. 1 is due to a high degeneracy of states near the Fermi level for this high symmetry structure. This degeneracy is lifted for , lowering the energy of the occupied electronic states and the structural energy, in a striking example of a Peierls (or static Jahn-Teller) distortion. The high sensitivity of the A1 phonon mode to photoexcitation is a direct consequence of this mechanism for stabilization of the -Te structure: occupation of states just above the Fermi level in the photoexcited material greatly reduces the stabilizing effect of the Peierls mechanism.
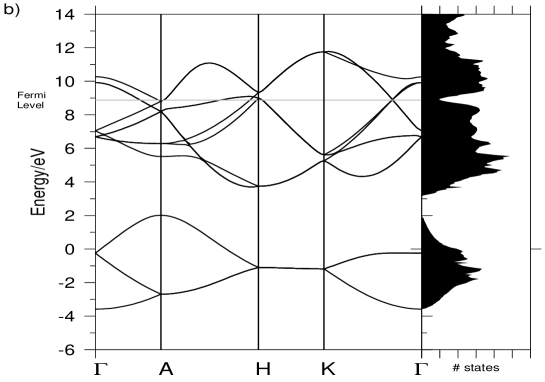
Fig. 2 shows the density of states and the bandstructure along the lines of highest symmetry of the hexagonal Brillouin zone, for = 0.2686 and = . There are nine occupied valence bands in the semiconducting structure. As is increased, the bandgap closes at , where the energy of the lowest conduction band at becomes equal to the top of the valence band at . A direct crossing of the bands occurs for the high symmetry, , structure.

Within the DECP mechanism, the initial amplitude of the phonon motion in the photoexcited material is given by the difference between the value of before excitation by the pump pulse and the equilibrium value of for the photoexcited system. Thus, the initial amplitude of phonon motion is equal to , where is the position of the energy minimum for the photoexcited system and is the minimum for the unexcited system. The energy vs. curves are significantly anharmonic and so the period of motion was calculated from each curve for amplitudes ranging between 0 and the initial DECP amplitude, . The frequency of the vibration will vary from its initial, large amplitude value to its final, small amplitude value as the motion is damped.


.
Fig. 3a shows the linear increase of the equilibrium bondlength with carrier excitation density, clearly demonstrating the weakening of the bonds and the displaced equilibrium that results from electrons occupying antibonding states. Fig. 3b shows the dependence of frequency on excitation density for large and small amplitude motion. For all carrier densities, the anharmonic terms tend to lower the phonon frequency. Thus, the DECP phonon period will decrease on successive cycles of the motion, as damping reduces the amplitude. However, the initial amplitude of DECP motion is large enough to make this effect appreciable only for photoexcited carrier densities greater than approximately 1% of the valence electron density. At this level of excited carrier density, the harmonic phonon frequency is already reduced to 2/3 of its value in the system without excited carriers.
In the light of these calculations, we can offer new insight into the recent pump-probe measurements of the phonon in tellurium. Hunsche et al. [3] measured the phonon frequency for pump flunces up to 12.5 mJ/cm2 and found a systematic decrease in frequency from 3.6 THz for the lowest pump fluences to 2.95 THz for the largest. This reduction in phonon frequency with increasing pump fluence is consistent with the linear decrease in phonon frequency with photoexcited carrier density found in the calculations above. However, using the results of Fig. 3b, we infer a much smaller carrier density than one would expect, based on strictly linear absorption and neglecting carrier diffusion, as given in Ref. [3]. For example, for a pump fluence of 2.4 mJ/cm2, Hunsche et al. estimate a carrier density of cm-3, or 0.7% of the valence electron density, at the sample surface. However, for this pump fluence, the phonon frequency, as measured by the probe reflectivity oscillations, is 0.1-0.2 THz lower than its frequency in the unexcited system (see Fig. 3 of Ref. [3]). Using the calculated phonon frequency as a function of carrier density (Fig. 3b), this frequency change would imply a carrier density of 0.1-0.2% of the valence electron density. Thus, we find that the carrier densities present in the experiments of Hunsche et al. are considerably smaller than the assumption of linear absorption and neglect of carrier diffusion would imply. Moreover, the decrease in the period for successive oscillations at very high pump fluence, where the phonon frequency is 0.3-0.6 THz lower than its value in the unexcited system (Fig. 3 of Ref. [3]), is too large to be due to anharmonicity of the phonon motion, as shown in Fig. 3b for carrier densities of approximately 0.6% of the valence electron density. It is more likely that these changes in period are due to a reduction of the carrier density caused by carrier diffusion.
In conclusion, we have calculated the dependence of the phonon frequency in tellurium on photoexcited carrier density, assuming fast thermalization of the carrier distribution and slow electron-hole recombination. We have also determined the initial amplitude of phonon motion, and the resulting anharmonic corrections to the period, within the DECP mechanism for the photoexcited system. The calculations shed new light on the interpretation of existing pump-probe experiments and open the possibility of using real-time measurements of the phonon period to monitor the evolution of carrier densities in photoexcited tellurium on a sub-picosecond timescale. Similar calculations are feasible for many other materials. This work has been supported by Forbairt Contract SC/96/742.
References
- [1] Jagdeep Shah, Ultrafast Spectroscopy of Semiconductors and Semiconductor Nanostructures, Springer Series in Solid State Sciences, vol. 115 (1996).
- [2] R. Merlin, Solid State Comm., 102, 207 (1997).
- [3] S. Hunsche, K. Wienecke, T. Dekorsky, and H. Kurz, Phys. Rev. Lett. 75, 1815, (1995).
- [4] H.J Zeiger, J. Vidal, T.K. Cheng, E.P. Ippen, G. Dresselhaus, M.S. Dresselhaus, Phy. Rev. B 45, 769, (1992).
- [5] W.Z. Lin, J.G. Fujimoto, E.P. Ippen, R.A. Logan, Appl. Phys. Lett. 51, 161 (1987).
- [6] W.Z. Lin, J.G. Fujimoto, E.P. Ippen, R.A. Logan, Appl. Phys. Lett. 50, 124 (1987).
- [7] W.Z. Lin, R.W. Schoelein, J.G. Fujimoto, E.P. Ippen, IEEE J. QE-24, 267 (1988).
- [8] R. Biswas and V. Ambegaokar, Phys. Rev. B 26, 1980 (1982).
- [9] R. Biswas and V. Ambegaokar, Phys. Rev. Lett. 50, 285 (1983).
- [10] P. Stampfli and K. H. Bennemann, Phys. Rev. B 42, 7163 (1990); P. Stampfli and K. H. Bennemann, Phys. Rev. B 49, 7299 (1994).
- [11] P. L. Silvestrelli, A. Alavi, M. Parrinello, D. Frenkel, Phys. Rev. Lett. 77, 3149 (1996).
- [12] Jerry Donohue The Structures of the Elements, (Wiley Interscience, New York, 1974).
- [13] W. E. Pickett, Comp. Phys. Rep. 9, 115 (1989).
- [14] F. Kirchoff, N. Binggeli, G. Galli and S. Massida, Phys. Rev. B 50, 9063 (1994) and references within.
- [15] P. Tangney and S. Fahy (to be published).
- [16] J. Ihm, A. Zunger, and M. L. Cohen, J. Phys. C 4, 4409 (1979).
- [17] D. R. Hamann, M. Schlüter, and C. Chiang, Phys. Rev. Lett. 43, 1494 (1979).
- [18] D. M. Ceperley and B. J. Alder, Phys. Rev. Lett. 45, 566 (1980).
- [19] F. Mauri, O. Zakharov, S. de Gironcoli, S. G. Louie, and M. L. Cohen, Phys. Rev. Lett. 77, 1151 (1996).