Formation of disclination lines near a free nematic interface
Abstract
We have studied the nucleation and the physical properties of a -1/2 wedge disclination line near the free surface of a confined nematic liquid crystal. The position of the disclination line has been related to the material parameters (elastic constants, anchoring energy and favored anchoring angle of the molecules at the free surface). The use of a planar model for the structure of the director field (whose predictions have been contrasted to those of a fully three-dimensional model) has allowed us to relate the experimentally observed position of the disclination line to the relevant properties of the liquid crystals. In particular, we have been able to observe the collapse of the disclination line due to a temperature-induced anchoring angle transition, which has allowed us to rule out the presence of a real disclination line near the nematic/isotropic front in directional growth experiments.
pacs:
61.30.Jf,61.30.GdI Introduction
Disclination lines [1] are characteristic defects of uniaxial nematic phases. These lines break the orientational order of the director field. They can easily form, for instance by stirring a nematic drop deposited on a glass plate. Observation in the microscope reveals a threaded texture composed of thin and thick threads which are primarily and wedge disclination lines. The former have singular cores whereas the latter form continuous configurations since the director can escape along the disclination axis (the so-called escape in the third dimension [2]). These lines cost an energy per unit length of the order of K (the relevant Frank constant), so they tend to spontaneously collapse when the flow vanishes. They can even all disappear at the end if the constraints at the boundaries and in the bulk are negligible (no external field). By contrast, some of them may subsist if the boundary conditions impose topological constraints which are incompatible with a continuous director field. Such a phenomenom occurs when the liquid crystal is confined inside a sphere with strong homeotropic anchoring (nematic molecules anchored parallel to the local normal of the surface). In this case, a point defect occurs at the center of the sphere (hedgehog configuration) [3, 4]. This configuration is stable if the anchoring energy per unit surface area, , (see below for a more detailed definition of this quantity) is strong enough to prevent the homeotropic anchoring to be broken. More precisely, a defect will appear if the anchoring penetration length [5] is smaller than the sphere radius . Such configurations can be obtained by dispersing a nematic phase in a non miscible isotropic liquid [6]. They are also found in polymer dispersed liquid crystals (PDLC) [7]. These materials, of great practical interest, are obtained by a polymerization-induced phase separation with an average droplet radius typically ranging between 0.1 m and 10 m. Another way to nucleate a disclination line is to confine the nematic liquid crystal inside a capillary tube with a strong homeotropic anchoring. If the tube is circular, the line is a +1 disclination [8]. On the other hand, two +1/2 disclinations must occur near both sides of a flat rectangular capillary tube [9]. In all these examples the nematic phase forms a simply connected medium. Conversely, it is possible to disperse a non-miscible liquid into a nematic liquid crystal and form this way an emulsion. This problem has recently attracted attention [10] because the elastic distorsions produced by the point defects that nucleate near each droplet create long range dipolar forces between the droplets.
In this article, we have chosen to study the nucleation and the physical properties of the -1/2 wedge disclination line that forms at the edge of a nematic sample confined between two parallel glass plates treated chemically to induce a homeotropic anchoring. At the edge, the nematic sample is in contact with an isotropic fluid. The interface between the nematic phase and the surrounding isotropic fluid is generally curved across the sample thickness because the two phases wet the glass plates differently. The first experimentally addressed example was that of the nematic interface in contact with its own melt. Such a situation is achieved in directional solidification when a homeotopic nematic sample is placed in a temperature gradient so that the nematic/isotropic phase transition temperature lies somewhere in the sample. Previous experiments in directional solidification have shown that a disclination line can detach from the interface in the form of triangular domains [11]. To explain this observation, it was suggested that a disclination line lies behind the meniscus separating the two phases and that a dust particle crossing the line could detach it from the meniscus, leading to the observed triangles. This interpretation was reinforced by the fact that energy considerations alone suggest this line can exist near the meniscus. Another reason to suppose its existence was that the wavelength measured at the onset of the Mullins-Sekerka instability was five times larger than the wavelength predicted by the linear stability analysis [12, 13, 14], suggesting a possible renormalization of the apparent surface tension due to the disclination line and to the associated elastic effects [15, 16] . Unfortunately the line was not visible in the microscope in the thin samples used in directional growth. For this reason we tried to see the line by increasing the sample thickness (its distance to the meniscus should essentially scale with the sample thickness). Surprisingly, even though we increased the sample thickness up to 400 m, we never saw the line and concluded that it might be virtual.
Prompted by this failure, we attempted to observe a disclination line at a free nematic interface (i.e., in contact with air), and we discovered that the line may or may not exist in that system, depending on both the strength of the anchoring energy and, much more important, on the value of the preferred tilt angle of the molecules at the free interface.
This article is structured as follows: in section (II) we detail the basic experimental setup and procedure, together with the main phenomenology involved in the formation of a disclination line near a free interface in a confined nematic phase. In section (III) we outline a planar model for the director field in the presence of a disclination line which we use to do a numerical study. In section (III C) a more realistic, three-dimensional structure of the director field is considered and we show it is a good approximation to use the planar model to calculate the position of the disclination line. Finally, in section (IV) we consider the effect of the anchoring angle on the disclination line, and use our planar model to study a temperature-induced anchoring angle transition.
II Experiment
We have prepared thin nematic (N) liquid crystal samples confined between two parallel glass plates. In order to favor a homeotropic anchoring of the liquid crystal on the glass plates, thus inducing a homeotropic alignment of the liquid crystal in the bulk, we have treated the surface of the glass plates by chemically adsorbing a surface active layer on them [17]. Prior to the chemical treatment, the glass plate is thoroughly cleaned by gently washing it with soap and water in order to remove any dirt spots, followed by soaking in soapy water for about 60 minutes, then rinsed in distilled water and quickly dried, first with clean air, and then baked under vacuum at 110∘C for about 30 minutes. We have tested the use of CTAB (hexadecyl trimethyl ammonium bromide) and the use of a silane compound from Merck (ZLI-2510) to align the liquid crystal molecules. In order to treat the plates with CTAB, we dip them into a 0.002% aqueous solution of the surface-active agent. The plates are subsequently lifted slowly out of the solution in order to avoid precipitation of CTAB. For the treatment with the silane compound, we prepare a saturated solution of the surface active agent in toluene. The glass plates are dipped in the solution for a few seconds and quickly lifted out to avoid creating dry silane spots. The excess silane is removed from the glass plates by gently rubbing with lens cleaning tissue. The cells are mounted with the desired gap between plates using either nylon thread (for gaps in the range 100 m - 400 m) or nickel wire (for gaps smaller than 100 m) as spacer. A precision better that 5% in the cell gap is obtained this way. The cells are partially filled by capillarity, keeping them at a temperature in the nematic range of the liquid crystal. Since the observations are to be made in the nematic phase, we make sure that the sample does not go into the isotropic phase once the cells are filled. Even though homeotropic alignment of the nematic phase is achieved faster if the product in the cell is first melted into the isotropic phase, we have observed in some cases that the motion of the N/air meniscus caused by the melting of the nematic phase crucially alters the observable phenomena. Sealing of the cell can also be performed to avoid degradation of the material or to prevent motion of the N/air meniscus. Different liquid crystal mesophases have been used in our experiments: 5CB (K15 from Merck), 8CB (K24 from Merck), MBBA (from ACROS), and I52 (from Merck). Samples with gaps in the range have been used.
A Preliminary observations
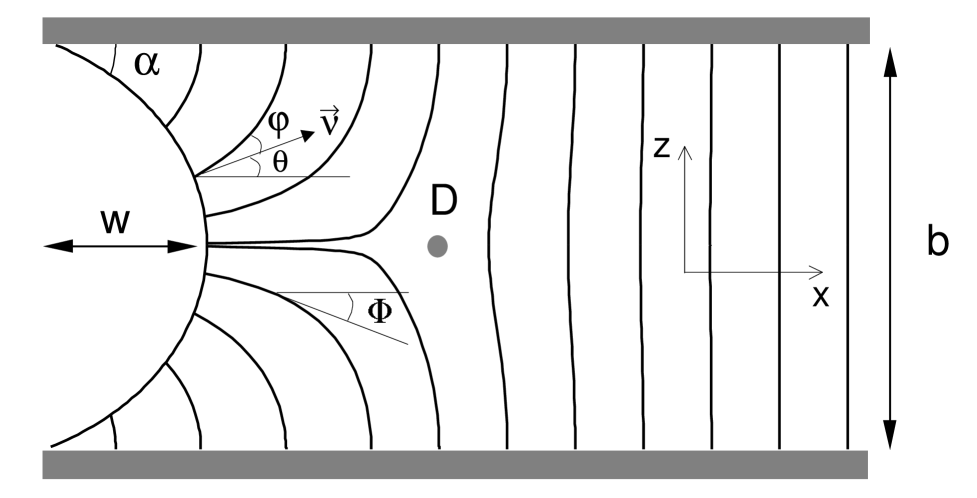
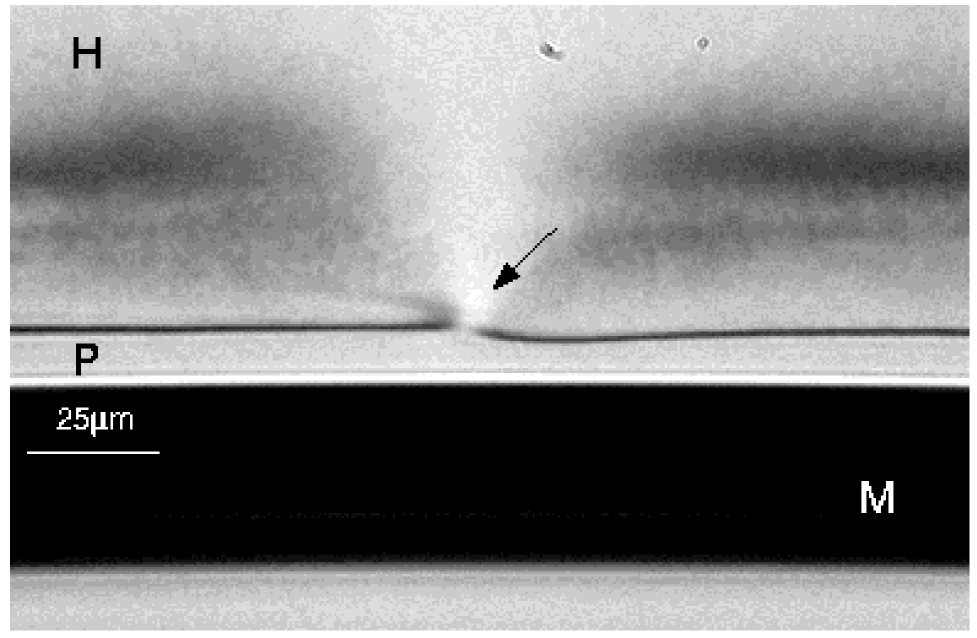
When a disclination line is present, it appears equidistant from the two glass plate boundaries and parallel to the meniscus, suggesting a structure that is translationally invariant along the interface (see Fig. 1). When the sample is observed between crossed polarizers (with the polarizers being parallel or perpendicular to the disclination line), the region between the disclination line and the homeotropic bulk reveals the presence of a distortion of the director field which indicates that it has a component in the direction of the disclination line (see Fig. 2). The presence of three-dimensional defects on the disclination line, and the fact that the position of the line is altered in the vicinity of such defects suggest that the three-dimensional structure of the director field may play a significant role in the position of the disclination line. As we will see below, however, a simple planar model for the disclination line (in which the director field has no component along the line) is able to reproduce both qualitatively and quantitatively our experimental observations on the line position (see section III). A three-dimensional extension of the planar model shows that even though the component of the director field along the disclination line is not negligible, its effects on the position of the line are not very significant (see section III C).
In order to measure the distance of the disclination line to the meniscus, we always select a region that is reasonably far from any such defects and that does not appear distorted by them. For gaps m, both the limit of our optical resolution and the presence of the three-dimensional defects make our observations difficult. We are able to observe the formation of the disclination line, but we are unable to meaningfully measure its distance to the meniscus. Therefore, we will restrict our measurements to samples with m.
B Equilibrium position of the disclination line
We first studied the dependence of the position of the disclination line on the thickness of the sample. The measurements are performed at a constant temperature in a region of the nematic phase where temperature variations of about C have a negligible effect on the position of the disclination line. Typically, this is the situation when the temperature is more that C above the Nematic/Smectic-A phase transition (provided a Smectic-A phase exists) and more that C below the Nematic/Isotropic phase transition.
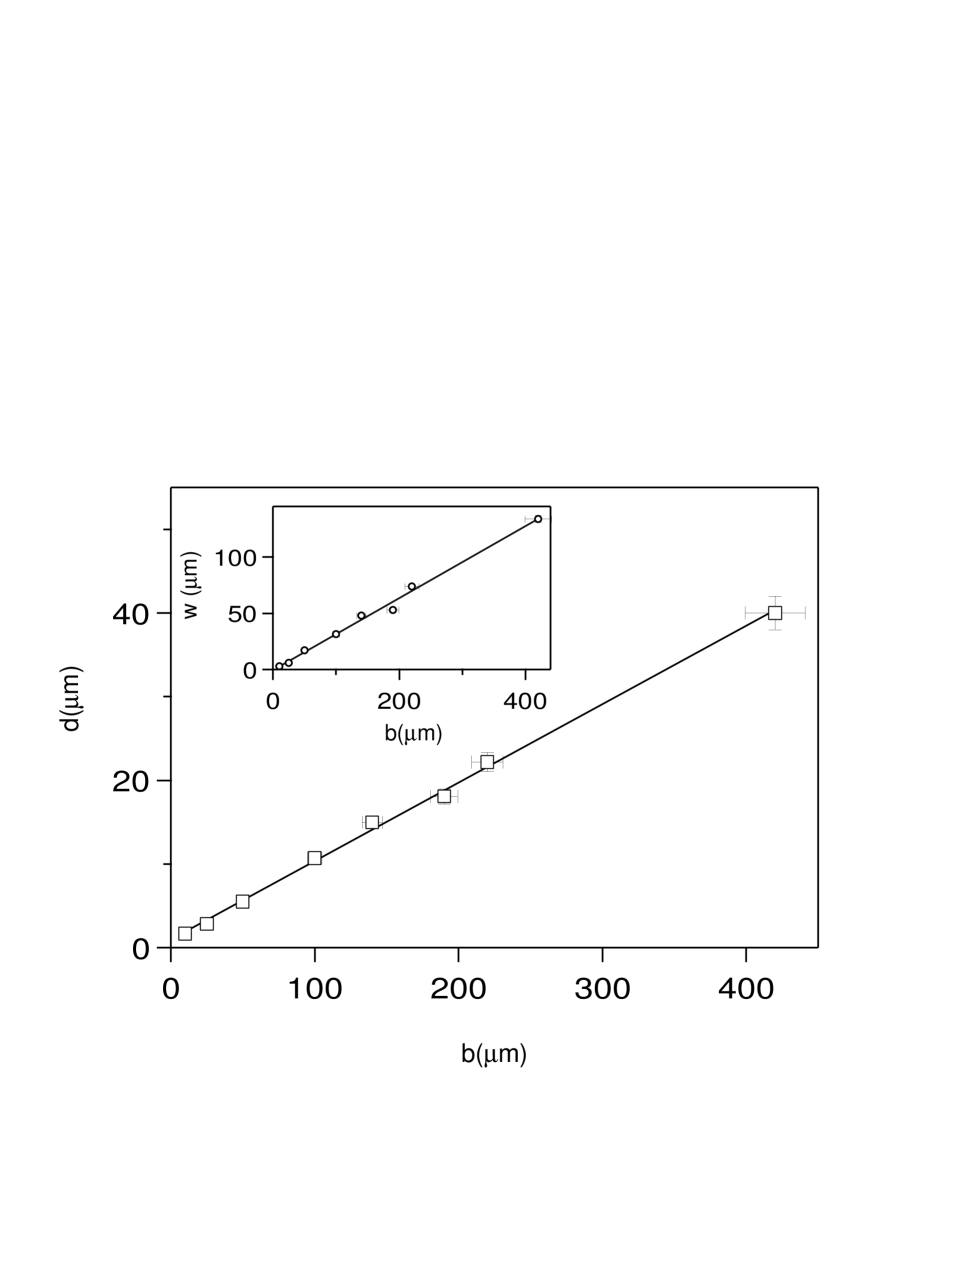
In Fig. 3 we plot the sample-thickness dependence of the position of the disclination line for 5CB. Our liquid crystal has C, and we perform our measurements at C (C). As we see in Fig. 3, the distance of the disclination line to the meniscus scales linearly with the cell gap over the range of gaps we have explored. Clearly, the shape of the meniscus, particularly the wetting angle with the glass plates, will have a strong influence on the position of the disclination line. Assuming a constant radius of curvature (circular profile), we are able to experimentally estimate the wetting angle on the plates (see Fig. 3). Given that the N/air surface energy ( Jm-2) is orders of magnitude larger than the nematic anchoring energy on the free interface ( Jm-2) [18], a shape with a circular profile, which both minimizes the surface area between the two media and meets the glass plates at a given contact angle, should be expected. Similar results are observed with 8CB, MBBA, and I52, with a combination of ratios and wetting contact angles as shown in Table I.
| ZLI-2510 | 5CB | 8CB | MBBA | I52 |
|---|---|---|---|---|
| 0.0940.005 | 0.1050.005 | 0.1050.005 | 0.0960.005 | |
| CTAB | 8CB | MBBA |
|---|---|---|
| 0.1000.005 | 0.1000.005 | |
It is customary to construct the dimensionless parameter , which compares the length scale imposed by the confined geometry (in our case the cell gap, ), with an intrinsic length scale of the material, . Note that throughout this article we will suppose that the anchoring energy on the glass plates (which induces the homeotropic orientation of the bulk) is large compared to , so that the presence of the free interface does not alter the anchoring condition on the plates.
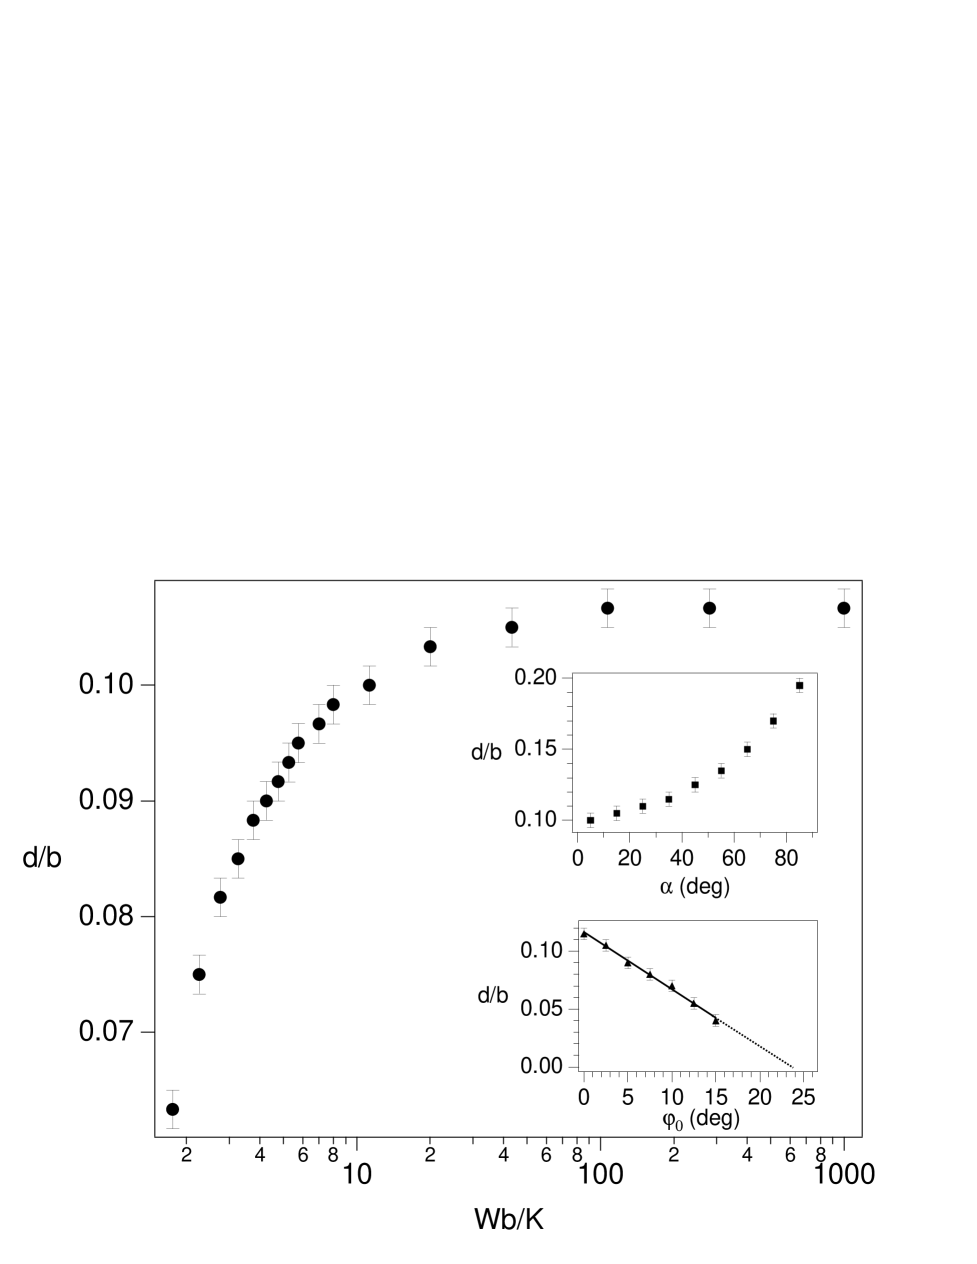
The perturbation caused on the homeotropic director field configuration by the presence of the free interface will be less apparent for samples thinner than . One expects the formation of a disclination line for , when surface anchoring effects dominate and impose a rigid anchoring angle. If , however, elastic effects will dominate and a balance between elastic and surface anchoring torques, rather that a rigid anchoring angle, is expected to determine the anchoring condition at the meniscus. In this case, the distortion caused by the free interface will be less important, and the equilibrium structure may be one without a disclination line. The results reported in Fig. 3 and Table I, namely, a disclination line whose position is completely determined by the geometry of the system, prove that the only relevant length scale is , the cell gap. We are clearly in a regime with , or infinite anchoring energy, where the anchoring angle on the meniscus is rigidly set. If we were able to make clear observations with a small enough sample thickness (typically m), we should presumably see the end of the regime, and observe the collapse of the disclination line.
In the next section, we outline a model to relate the equilibrium position of the disclination line to the different experimental parameters. Our model predicts the disclination line to start collapsing noticeably for (see Fig. 5), which we may use to give a lower bound for the anchoring energy, . We have confidently measured the position of the disclination line for m, and still observe the same ratio (within error bars). We can, thus, estimate ( for 5CB at C [19]). A similar estimate is obtained from our measurements with 8CB.
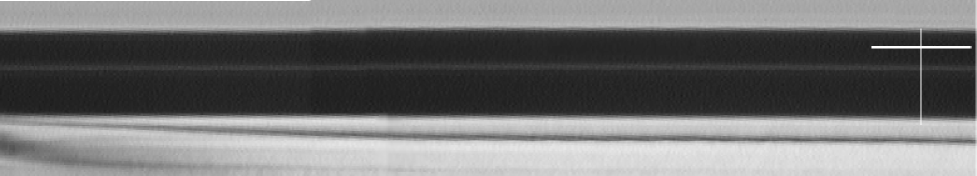

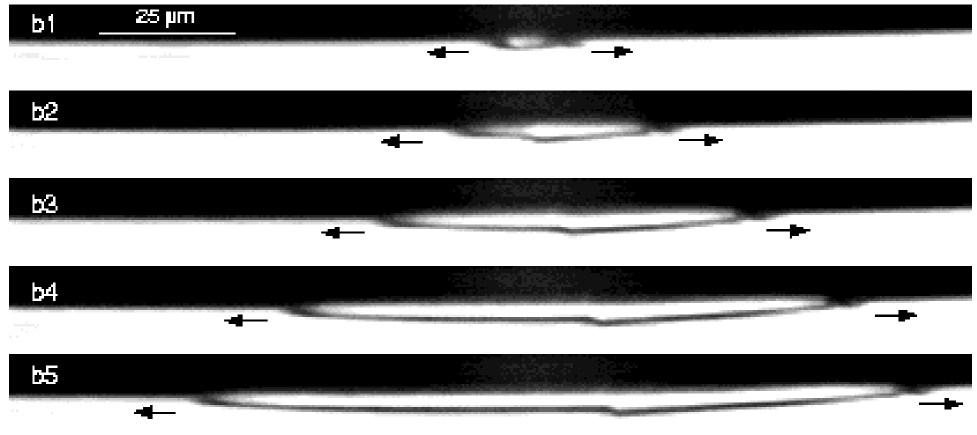
In an attempt to observe experimentally the collapse of the disclination line due to small values of , we have considered altering the value of by replacing the air interface with an interface with another isotropic medium, such as an isotropic fluid or glass wires with different surface treatments. Even though we have observed an effect of the different interfaces on the anchoring conditions, the configurations had poor reproducibility and dubious stability. We also tried to increase by approaching the nematic/Smectic-A phase transition temperature. Indeed, we know from previous work that the bend elastic constant diverges at this transition [19, 20, 21] so that the disclination line energy also diverges. The experiment was performed by placing a m-thick sample of 8CB inside a constant temperature gradient parallel to the liquid-crystal/air interface (see Fig. 4). The immediate observation is that while in the N phase a disclination line is observed, it disappears as we enter the SmA phase. More precisely, shifts from its asymptotic value (close to ) when C and typically equals at C. At this temperature while when (see the following section). This allows us to roughly estimate W in 8CB: .
III Model
In order to better relate the phenomena described in the previous section to the experimental parameters, we modeled the director-field configuration in a confined nematic geometry in the presence of a free interface. Even though our observations show a three-dimensional director-field structure around the disclination line (see section II A), we propose a simple, two-dimensional model with a planar disclination line (the director field is assumed to be perpendicular to the line). This model has allowed us to obtain numerical estimates for the position of the disclination line that match very well the experimental observations. Finally, we consider a more accurate model, where the three-dimensional structure of the director field is taken into account. We verify that, in fact, the predictions from the planar model quite accurately predict the position of the disclination line.
A Equations
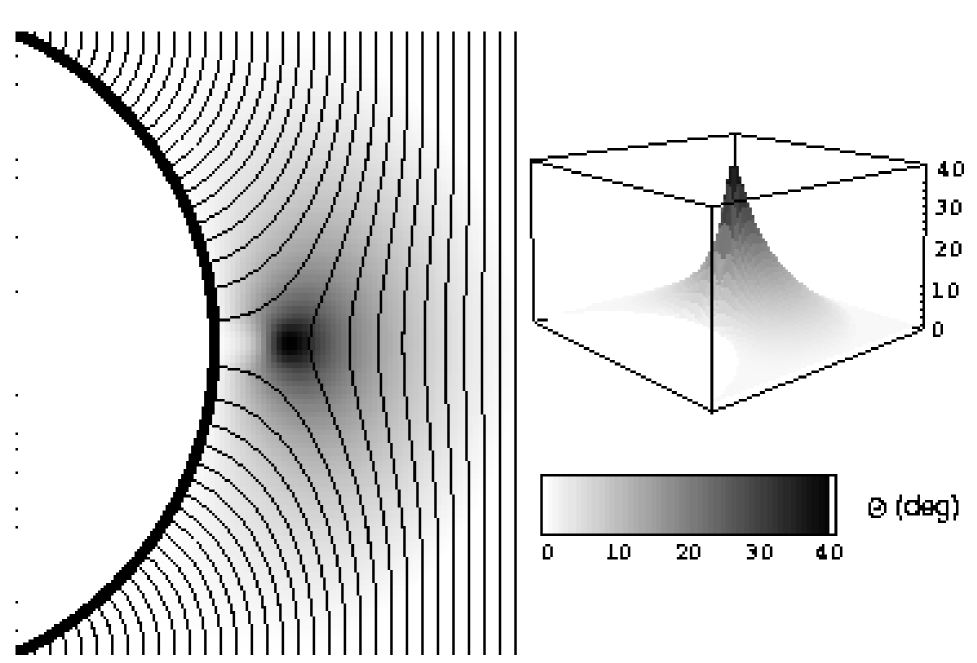
If we consider that the distortion caused by the presence of the free interface is translationally invariant along the interface, and ignore the component of the director field along the disclination line (planar disclination line), then a typical director field configuration will appear as shown in Fig. 1, and it will be characterized by the angular field , with . Given the two-dimensional nature of this approximation, there will be no contribution from the twist of the director field to the elastic free energy (). Likewise, the saddle-splay term () will vanish identically [1, 22]. Moreover, for the experimental conditions described in the previous section in which the samples are kept at a temperature away from both the N/I and N/SmA transitions, the splay and bend elastic constants take on roughly the same values, . A final approximation is made in which the mixed splay-bend term () is neglected [22, 23]. With all this, we can write,
| (1) |
which gives
| (2) |
where . The glass walls are taken to be at , and we assume that a strong anchoring fixes there.
The interaction with the N/air meniscus contributes a surface energy that is customarily approximated by
| (3) |
with . Here, is the angle between the local normal to the meniscus and the horizontal direction, and introduces a favored anchoring angle between the director field and the local normal to the interface for which the surface energy density is minimum (see Fig. 1).
The energy introduced in the system by the presence of the N/air interface will be
| (4) |
where the volume integral spans over the bulk nematic phase and the surface integral spans over the N/air meniscus.
We will seek the director-field distribution (characterized by ) by minimizing the energy functional with respect to . Integrating by parts and imposing that the director field be homeotropic both on the glass boundaries and far from the interface, one obtains
| , | (6) | ||||
| , | on the free interface. | (7) |
Eq. (7) establishes a torque balance at the interface (here, represents the derivative along the local normal direction, and is the angle between the local normal to the interface () and the horizontal direction). The shape of the interface is completely determined by the experimentally measured wetting contact angle (see Fig. 1). These equations can be made dimensionless by rescaling all length scales by and defining the anchoring parameter , which contains all the material properties. With this, one would expect the distance from the disclination line to the meniscus to have a functional dependence of the form . In the strong anchoring regime (), will be rigidly set on the interface, and is expected. Note that there strictly exists in our model a discontinuity in the director field at the tip of the meniscus when is rigidly imposed at the interface. This may lead to values of smaller than the real ones. The use of eq. 7 with a large, but finite, value of effectively removes this discontinuity and shows that the error introduced by the infinite anchoring approximation is very small.
B Numerical model
In order to find the configuration which minimizes the total energy, we proceed to solve eq. III A by relaxing the fixed boundary problem obtained by setting the position of the disclination line at a distance from the meniscus. Therefore, is set for , while is set for . In order to avoid the -discontinuity at , we restrict our calculation to the region. The value of the wetting angle (which can be determined experimentally, see Fig. 3 and Table I) and the value of the favored anchoring angle, , together with the condition of homeotropic configuration both far from the meniscus and on the glass walls, completely determine the director field distribution. Typically, we use discretization grids of about 400x200 points. Once the configuration is obtained, we compute its total energy and then minimize this energy with respect to the configurations obtained by changing the value of . Note that we neglect the contribution of the core of the disclination to the total energy. We assume that it will be constant, independent of and, therefore, will not be relevant in the determination of the configuration with the least energy. In Fig. 5, we show the results of these calculations. First, we explore as a function of . This corresponds to the measurements performed in section (II B). We observe that the model predicts that converges asymptotically to as , for , and . Note that this is, within error bars, consistent with the results reported in Table I. Only our measurements with 5CB (shown in Fig. 3) are slightly smaller that the prediction from our model. Our numerical calculations predict as well that, as gets smaller, starts to decrease. In order for to decrease more than, say, 10% below the infinite anchoring position (which would be experimentally measurable with our optical resolution) one would need (see Fig. 5). We have also explored the effect that and have on the disclination line. We can see in Fig. 5 that increases with increasing values of . Indeed, if we held fixed, a flatter meniscus (larger ) would require larger distortions of the director field in order to match both the strong anchoring on the glass walls and on the meniscus. This would increase the elastic energy, which can be prevented by increasing . The experimental observations reported in Table I are consistent with this result, even though the dispersion in the data, combined with the fact that in the region is not very sensitive to changes in , do not allow for any conclusive trend to be extracted from our measurements. On the other hand, we may exploit the modeled effects of the anchoring angle, , to study the known phenomenon of temperature-induced anchoring transitions (see section IV). We observe (see Fig. 5) that, within our numerical resolution, decreases roughly linearly with increasing values of . Using this result, one can immediately correlate changes in the position of the disclination line with changes in the anchoring condition, provided remains unchanged. Observe that, extrapolating the calculations reported in Fig. 5, we can expect that, even in the presence of a strong anchoring, a configuration without a disclination line may be observed, provided is large enough ( for the configuration in Fig. 5). This is the reason why a real disclination line is not formed spontaneously near a nematic/isotropic front, since on that interface large values for are reported ( for 8CB [24]). We recall that the anchoring length at this interface is too small (of the order of m with Jm-2 [24] and [19])to explain alone the absence of a real disclination line in thick samples (m). We also emphasize that the formation of planar triangles in directional solidification [11] requires that a dust particle crosses the N-I interface, suggesting the disclination line is not real but virtual (its core lies in the isotropic liquid). This observation fully agrees with our predictions.
C Three dimensional effects
As we have seen in section (II A), our experimental observations reveal a three-dimensional structure in the director field in the vicinity of the disclination line. The model described above assumes a planar configuration of the director field, in which the component along the disclination line is ignored. In this section, we study the modifications introduced by a three-dimensional model of the director field.
We have used the full Landau-Ginzburg-de Gennes tensorial expansion for the elastic free energy density in power series of the quadrupolar order parameter (which we define as , assuming a uniaxial system). We take , which is an excellent approximation for 5CB and 8CB in the region of the nematic phase we study. Moreover, the saddle-splay term is included as well () and the mixed splay-bend term is set to zero ()[23]. We have only considered the case of rigid homeotropic anchoring, in which the liquid crystal molecules are forced to anchor on the meniscus at . A detailed description of the model and the numerical methods involved are given in [25].
Indeed, we obtain an equilibrium configuration where the director field has a significant projection in the direction of the disclination line, especially in the vicinity of the line (see Fig. 6). Surprisingly, though, when the position of the disclination line is estimated, the result is, within error bars, the same as the one found with the much simpler planar model. Therefore, the three-dimensional calculations validate the use of the planar model to predict the position of the disclination line as a function of the relevant physical parameters.
IV Effect of the anchoring angle
We have seen on section III that, based on the results from our computations, we expect the disclination line to approach the meniscus as the anchoring angle is larger than zero and that, presumably, configurations without a disclination line might be possible, provided the anchoring angle is large enough. It is well-known that the equilibrium anchoring angle of the nematic molecules at a N/air interface can depend on temperature [26, 27, 28]. We have performed measurements with MBBA and I52, both of which are known to have such a behavior, in order to study the effect the anchoring angle has on the formation of a disclination line. Samples are prepared as explained above and placed in a temperature-regulated oven and the position of the disclination line as a function of temperature is measured.
A Continuous anchoring angle transition in MBBA and I52
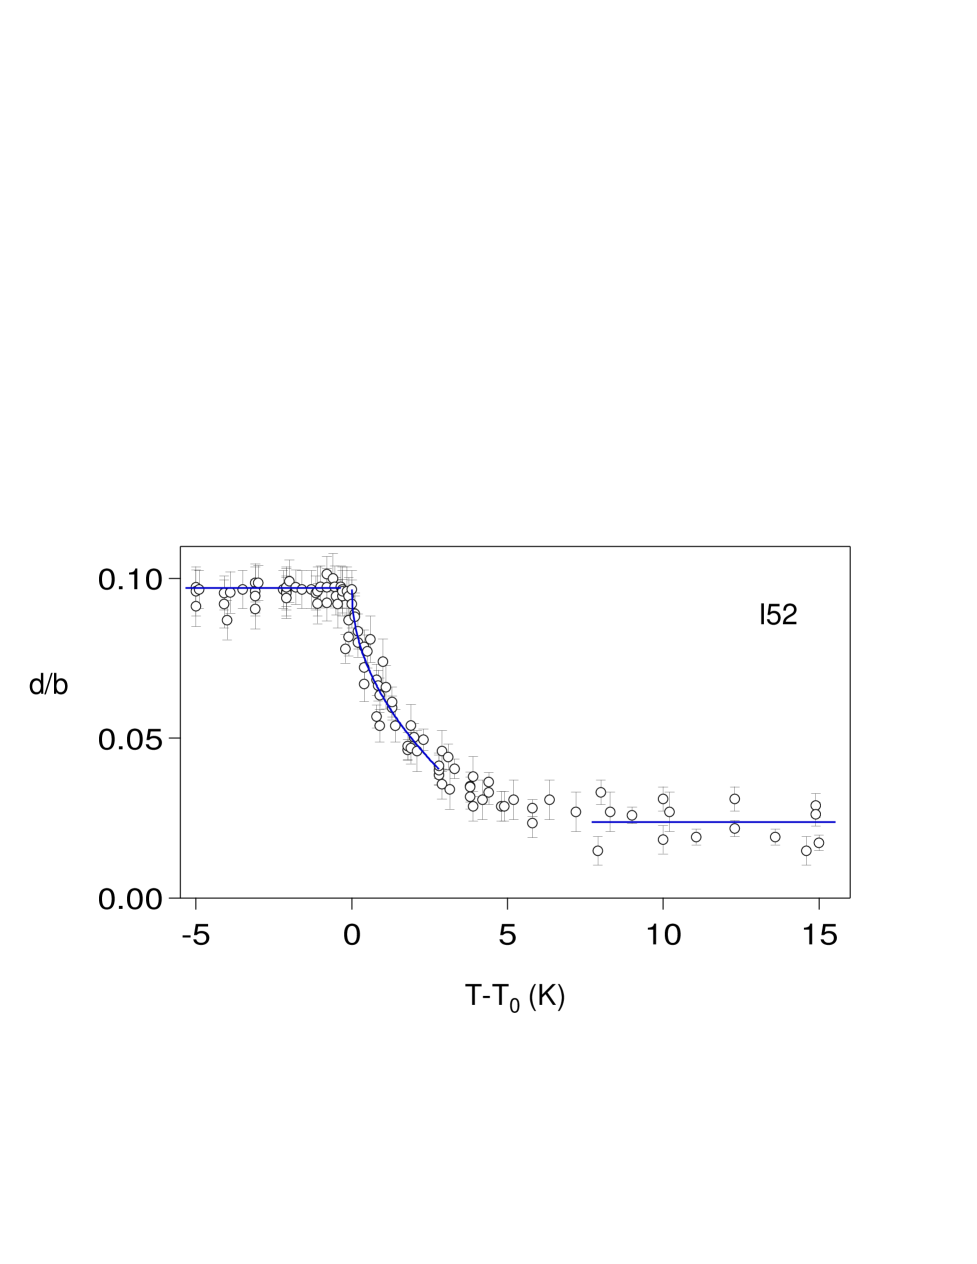
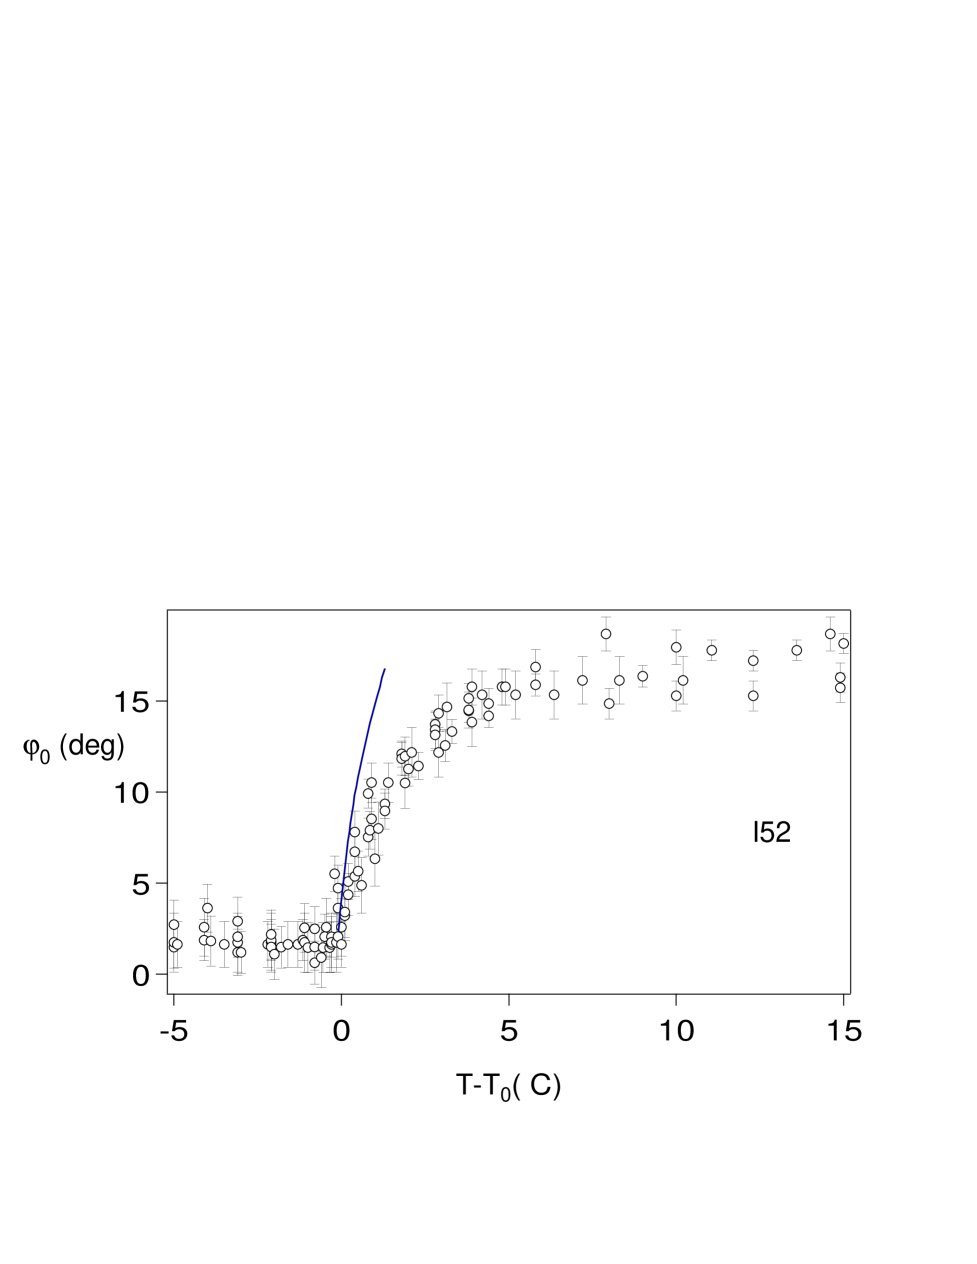
For I52, the disclination line starts to approach continously the N/air meniscus as we increase the temperature beyond C, until it reaches a final configuration where the distance remains unchanged by further increasing the temperature. No hysteresis is observed as we alternate heating and cooling cycles, and the transition temperature is independent of sample thickness. In fact, measurements performed with different values of the cell gap are collapsed by rescaling the distance of the disclination line with the cell gap (see Fig. 7). This suggests that what we are seeing is not due to changes in the anchoring energy, since its influence in the position of the disclination line is introduced by the parameter , which depends on the sample thickness.
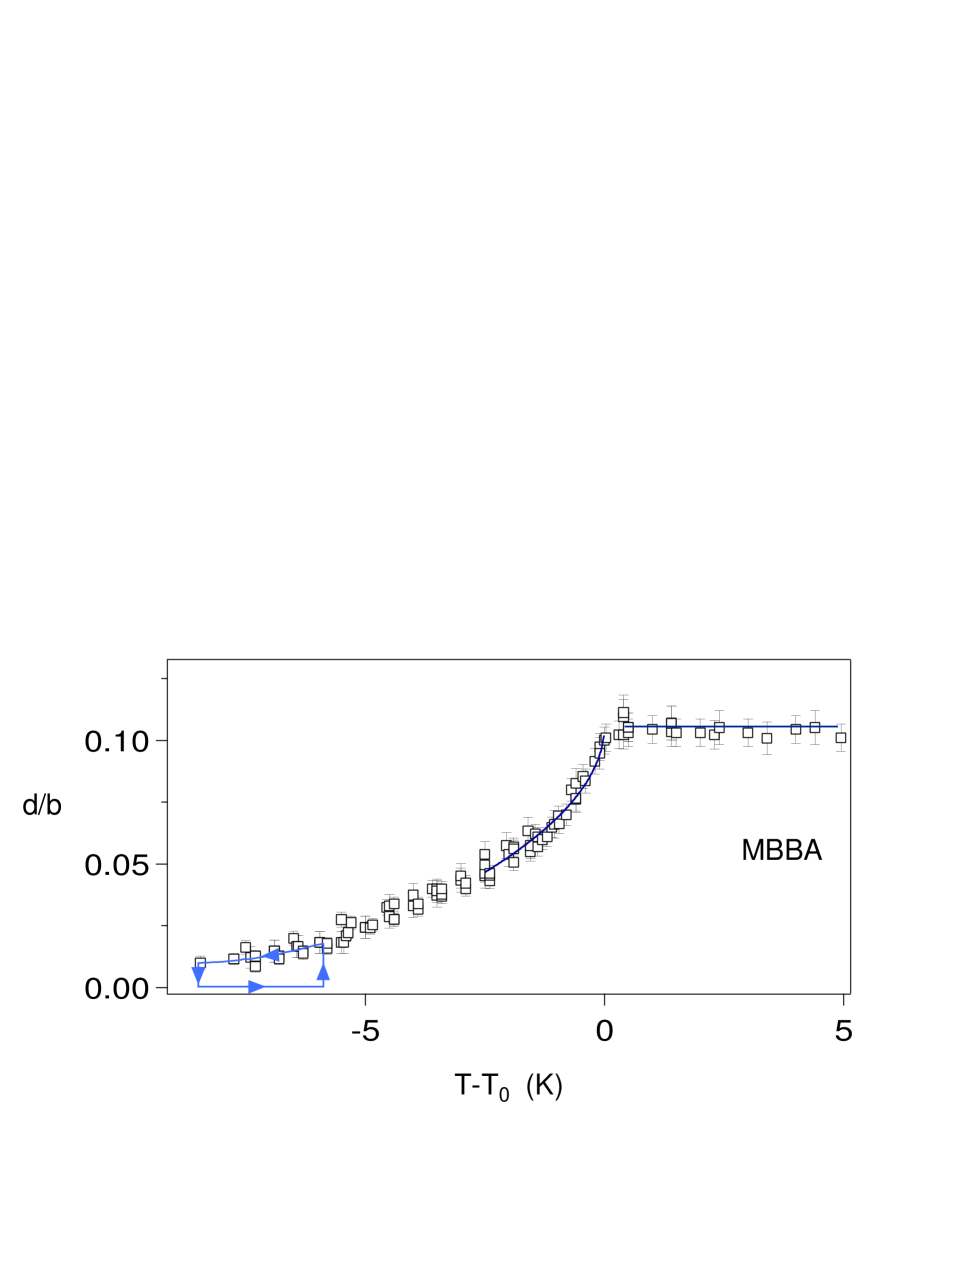
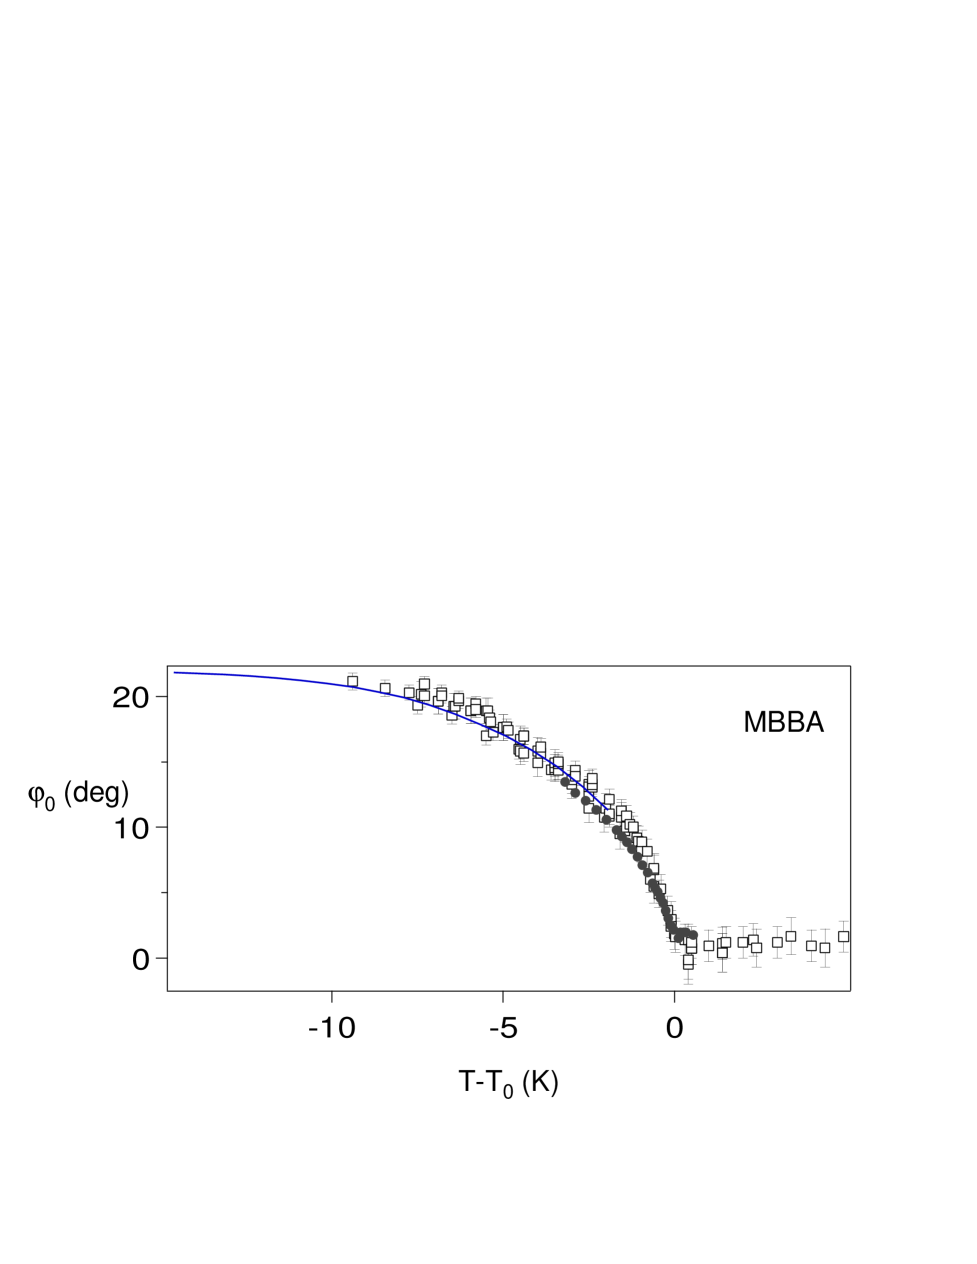
For MBBA, the distance from the disclination line to the N/air meniscus starts to decrease continuously as we lower the temperature below C. Just as with I52, no hysteresis is observed here. The transition temperature is slightly different for different samples, however, and it may depend on sample thickness, even though we have been unable to find any meaningful trend. Shifting the temperature axis with the value of for each experiment, and rescaling the position of the disclination line by effectively brings onto a single curve the data taken with different sample thicknesses (see Fig. 7) suggesting as well that we are always in the infinite anchoring regime.
Both for I52 and for MBBA, we see that the departure from the upper plateau is well-described by a continuous (or supercritical) bifurcation of the form , which is analogous to what has been observed elsewhere for anchoring-angle transitions [28]. Fitting such an analytical profile to our data, we can get a more precise estimate for the transition temperature, .
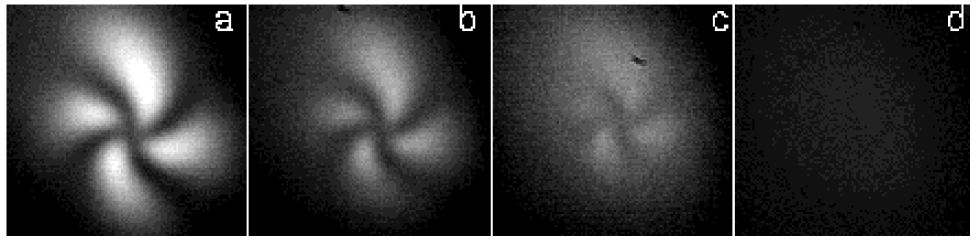
Note that, even though a second stable position for the disclination line is observed for I52, the line keeps approaching the meniscus as the MBBA samples are cooled to lower temperatures, until the disclination line finally collapses. As we describe below, there is hysteresis in this collapse, and the dynamics that leads to it is reminiscent of a first-order transition. Based on the observations reported above and on the results found in the literature, we would like to argue that the changes we see in the position of the disclination line when we vary the temperature of the samples can be accounted for by changes in the anchoring angle at the interface. The existence of an anchoring angle transition is easily demonstrated by observing between crossed polarizers a micro-droplet of the liquid crystal placed on a substrate that induces a homeotropic anchoring (see Fig. 8). For temperatures at which the disclination line is at the upper plateau in Fig. 7, we have observed no point defects in the droplets. As we vary the temperature entering the region where a transition in the position of the disclination is observed in Fig. 7, a characteristic point defect structure starts to become manifest, and the distortion in the director field increases in the temperature region where the disclination line is closest to the meniscus.
We have used our planar model for the structure of the director field near the N/air interface in order to relate the position of the disclination line to the anchoring angle (see Fig. 5). The numerical model considers a planar disclination line and a strong anchoring condition at the meniscus with an anchoring angle that can be different from the homeotropic orientation (). Note that our numerical model assumes . For MBBA, in the relevant temperature range (C), one finds in the literature that . The same information, however, is not available for I52. The fact that our planar model successfully predicts the position of the disclination line in the homeotropic anchoring situation is a good indication that the above approximation is valid. Moreover, in the vicinity of the continuous anchoring angle transition, the angular dependence of the surface energy may have its leading order term cancelled. Indeed, the surface energy in the vicinity of the second order anchoring angle transition can be expanded as
| (8) |
where and are two positive constants. The equilibrium angle is for and for (MBBA case). The torque originated by an anchoring at an angle at is
| (9) |
We see that, at , the leading order term vanishes. We will assume that the first non-vanishing term, still increases steeply when , so that the anchoring angle remains close to its value at equilibrium.
The numerical calculations show that the dependence of the ratio on the anchoring angle can be roughly approximated by a straight line, whose slope depends on the wetting angle of the meniscus on the glass plates (see Fig. 5). Using our numerical results, we have been able to transform the vs. data in Fig. 7 into vs. (see Fig. 9). Among other features, our vs. data maintains a continuous bifurcation compatible with , consistent with previous measurements by other groups. Our estimations for the dependence of the anchoring angle on temperature for MBBA are well in agreement with all the results reported in the literature, both at the onset of the bifurcation [28] and at much lower temperatures [27], extending almost C below the transition. We observe a homeotropic anchoring above and a steadily increasing anchoring angle whose saturation we are unable to observe as we enter a regime where the disclination line collapses. We see that, provided the anchoring angle is large enough () a configuration without a disclination line is possible. On the other hand, our estimates for I52 depart from the homeotropic anchoring configuration for above , with values for that are about 1.7 times lower than what was reported by Sonin et al. [28]. For well above , we find a stable configuration with tilted from the homeotropic orientation. The limited available information on the physical properties of I52 may account, at least partially, for these discrepancies, even though our only assumptions are strong anchoring and one-constant approximation for the elastic energy.
B Collapse of the disclination line in MBBA: a first-order transition
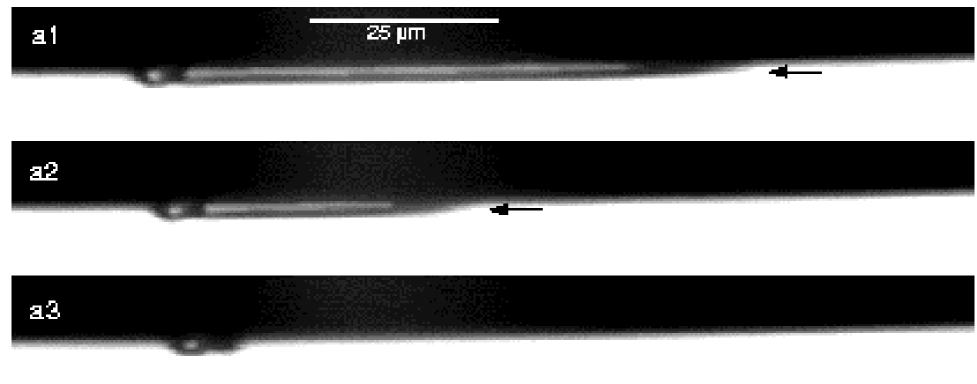
When the temperature is lowered below a thickness-dependent value (typically 10 degrees below ), regions where the disclination line has collapsed start to nucleate around dust particles on the meniscus (see Fig. 10). These collapsed regions propagate until they eventually extend along all the interface, and the equilibrium configuration has no disclination line. Before collapsing, the disclination line in the now metastable regions keeps approaching the meniscus as the temperature is lowered even further. We have already explained that, as long as the disclination line does not collapse, there is no hysteresis between heating and cooling cycles. Once the line has collapsed, however, heating the sample does not regenerate the line continuously. Instead, there is a heterogeneous nucleation process similar to the one that leads to the collapse of the line upon cooling, and the temperature at which the line is regenerated is well above the temperature at which the line started to collapse. The diagram in Fig. 7 illustrates this hysteresis cycle.
This dynamics suggests the coexistence of two possible configurations in the structure of the director field for MBBA, one presenting a disclination line and another with a continuous distortion of the director field. The observed nucleation mechanism for the collapse and regeneration of the disclination line shows that the transition between these two configuration is energy activated. A detailed study of this process would yield a good quantitative characterization of the energy associated with the core of the disclination line, which has yet to be done.
V Summary and Conclusions
In this article, we have studied the nucleation and the physical properties of a -1/2 wedge disclination line which forms near the open edge of a nematic liquid crystal sample confined between two glass plates that induce a homeotropic orientation of the nematic phase. The position of the disclination line, in particular its distance to the edge of the N/air meniscus is directly measurable, and we have related it to the physical properties of the liquid crystal with the help of a planar model for the structure of the director field in the presence of the N/air interface. Since the three-dimensional nature of the structure of the director field in the vicinity of the disclination line is experimentally evidenced, we have used a three-dimensional model to obtain a more accurate description of this structure. Indeed, we have observed a significant escaped component of the director field, even though the position of the disclination line that minimizes the total energy agrees with the predictions of the planar model, which we have therefore used since it allows to implement realistic boundary conditions in a simple way. We have performed different attempts at altering the position of the disclination line by changing the anchoring parameter . For large values of this parameter, the position of the disclination line is completely determined by the geometry of the problem, and therefore . By changing the sample thickness, we have tried to reduce the magnitude of so that the line aproaches the meniscus faster than the linear dependence on . Our attempts at observing this regime and extracting a value for this way have failed, most likely due to the experimental limitation in the smallest values for we have been able to use. Under usual experimental conditions, the disclination line will form and its position will agree with the predictions from the infinite anchoring approximation. Altering in a way that can affect the position of the disclination line has proven to be a difficult task. Given the fact that is an intrinsic property of the interface, one would need to consider different isotropic media or even chemically altering the anchoring. We have been unable to alter the nature of the anchoring strength in a stable and reproducible way. Another promising way to control the magnitude of is approaching the Nematic/Smectic-A phase transition temperature. The bend elastic constant, , can be made arbitrarily large by approaching that temperature. By placing our samples in a temperature gradient, we have been able to observe the collapse of the disclination line, which we see to start approaching the N/air meniscus when the temperature is less than a few hundred millikelvin above . From this experiment, we estimated in 8CB near . Nevertheless, this method has important experimental limitations (presence of a vertical temperature gradient in the samples, existence of a zig-zag instability of the disclination line at very small temperature gradient, bad knowledge of the elastic constants near the transition, etc.). Finally, our calculations show that a departure of the anchoring condition at the N/air meniscus from the homeotropic orientation will significantly alter the position of the disclination line. Indeed, we have been able to observe the disclination line to approach the meniscus when materials known to have a temperature-induced anchoring angle transition are used. Moreover, we have shown that a configuration without a disclination line is obtained for values of the anchoring angle above (a value that depends slightly on the material properties), even though energy considerations alone would suggest the possibility of the formation of a disclination line ( is large). We believe this is the situation we encounter in the vicinity of a nematic/isotropic liquid crystal front in directional growth experiments. Even though we are in a regime of infinite anchoring (large ), a large value of the anchoring angle (about ) guarantees that the disclination line will be virtual in those cases.
Acknowledgements.
This work was supported by the European Research Network Contract No. FMRX-CT96-0085 and the Barrande Contract No. 98010.REFERENCES
- [1] F. Frank, Disc. Faraday Soc. 25, 19 (1958).
- [2] I. Dzyaloshinskii, Sov. Phys. J.E.T.P. 36, 774 (1973).
- [3] S. Candau, P. Le Roy, and F. Debeauvais, Mol. Cryst. Liq. Cryst. 23, 283 (1973).
- [4] G. Volovik and O. Lavrentovich, Sov. Phys. JETP 58 (6), 1159 (1983).
- [5] G. Ryschenkow and M. J. Kléman, J. Chem. Phys. 64 (1976).
- [6] P. Drzaic, Mol. Cryst. Liq. Cryst. 154, 289 (1988).
- [7] J. W. Doane, in Liquid Crystals: Applications and uses, edited by B. Bahadar (World Scientific, Singapore, 1990), Chap. 14.
- [8] P. Cladis and M. J. Kléman, J. Phys. France 33, 591 (1972).
- [9] M. Mihaïlovic and P. Oswald, J. Phys. France 49, 1467 (1988).
- [10] P. Poulin, H. Stark, T. C. Lubensky, and D. A. Weitz, Science 275, 1770 (1997).
- [11] P. Oswald, J. Bechhoefer, and A. Libchaber, Phys. Rev. Lett. 58, 2318 (1987).
- [12] J. Bechhoefer, A. J. Simon, A. Libchaber, and P. Oswald, Phys. Rev. A 40, 2042 (1989).
- [13] J. M. A. Figueiredo, M. B. L. Santos, L. O. Ladeira, O. N. Mesquita, Phys. Rev. Lett. 71, 4397 (1993).
- [14] J. M. A. Figueiredo, O. N. Mesquita, Phys. Rev. E 53, 2423 (1996).
- [15] C. Misbah, A. Valance, Phys. Rev. E 51, 1282 (1995).
- [16] J. Bechhoefer, S. A. Langer, Phys. Rev. E 51, 2356 (1995).
- [17] J. Cognard, Mol. Cryst. Liq. Cryst. 78 supl. 1, 1 (1981).
- [18] O. D. Lavrentovich, Liquid Crystals 24, 117 (1998).
- [19] N. V. Madhusudana and R. Pratibha, Mol. Cryst. Liq. Cryst. 89, 249 (1982).
- [20] D. Davidov et al., Phys. Rev. B 19, 1657 (1979).
- [21] C. W. Garland and G. Nounesis, Phys. Rev. E 49, 2964 (1994).
- [22] J. Neyring and A. Saupe, J. Chem. Phys. 54, 337 (1971).
- [23] H. Yokoyama, Phys. Rev. E 57, 2938 (1997).
- [24] S. Faetti and V. Palleschi, Phys. Rev. A 30, 3241 (1984).
- [25] J. Baudry, S. Pirkl, and P. Oswald, Phys. Rev. E 57, 3038 (1998).
- [26] P. G. de Gennes and J. Prost, The Physics of Liquid Crystals, 2nd ed. (Cambridge University Press, Cambridge, MA, 1982).
- [27] M. A. Bouchiat and D. Langevin-Crouchon, Phys. Lett. 34A, 331 (1971).
- [28] A. A. Sonin, A. Yethiraj, J. Bechhoefer, and B. J. Frisken, Phys. Rev. E 52, 6260 (1995).