Transition from damage to fragmentation in collision of solids
Abstract
We investigate fracture and fragmentation of solids due to impact at low energies using a two-dimensional dynamical model of granular solids. Simulating collisions of two solid discs we show that, depending on the initial energy, the outcome of a collision process can be classified into two states: a damaged and a fragmented state with a sharp transition in between. We give numerical evidence that the transition point between the two states behaves as a critical point, and we discuss the possible mechanism of the transition.
pacs:
PACS number(s): 64.60.-i, 64.60.Ak, 46.30.NzI Introduction
Fragmentation, i.e. the breaking of particulate materials into smaller pieces is a ubiquitous process that underlies many natural phenomena and industrial processes. The length scales involved in it range from the collisional evolution of asteroids through the scale of geological phenomena down to the breakup of heavy nuclei [1, 2]. In most of the realizations of fragmentation processes the energy is imparted to the system by impact, i.e. typical experimental situations are shooting a projectile into a solid block, free fall impact with a massive plate and collision of particles of the same size [3, 4, 5, 6, 7, 8, 9, 10, 11]. The most striking observation about fragmentation is that the size distribution of fragments shows power law behavior independent on the microscopic interactions and on the relevant length scales, e.g. the charge distribution of small nuclei resulted from collisions of heavy ions exhibits the same power law behavior as the size distribution of asteroids [1, 2, 3, 4, 5, 6, 7, 8, 9, 10, 11]. Experiments revealed that the power law behavior of fragment sizes is valid for a broad interval of the imparted energy [3, 4, 5, 6, 7, 8, 9, 10, 11], which was also reproduced by computer simulation of sophisticated microscopic models [12, 13, 14, 15, 16, 17]. The observation of power law size distributions without control parameter initiated the idea of self-organized criticality [8, 9, 10, 11, 18, 19] in fragmentation and gave rise to numerous studies to understand the dynamic origin of the power law [12, 13, 14, 15, 16, 17, 18, 19, 20, 21, 22, 23, 24, 25]. Hence, during the past years much information has been accumulated about fragmentation processes in the imparted energy range where a power law size distribution occurs but the limiting case of low energies is still not explored.
Beside the general interest in fragmentation processes one can also mention other fields where fracture and fragmentation of solid particles due to impact play an important role. It is well known that in the flow of granular materials a large part of the kinetic energy of the grains is dissipated in the vicinity of their contact zone during the collisions. Beside the viscous and plastic effects, the dissipation by damaging is also an important source of energy loss in the flow. Collision of particles occurs also in the solar system in planetary rings. In this case the energy dissipation due to impact damage might also influence the large scale structure formation in the rings [26]. On larger length scale in the solar system, the so-called collisional evolution of asteroids due to subsequent collisions, and the formation of rubble piles in the asteroid belt is still a challenging problem [6]. Among industrial applications the breakup of agglomerates in chemical processes can be mentioned. Due to experimental difficulties, the computer simulation of microscopic models is an indispensable tool in the study of these impact phenomena [12, 13, 14, 15, 16, 17].
In the present paper we want to elaborate the impact fracture and fragmentation of solids at low imparted energy using a two-dimensional dynamical model of breakable granular solids. Simulating collisions of two solid discs we show that, depending on the imparted energy, the outcome of a collision process can be classified into two states: a damaged and a fragmented state with a sharp transition in between. Analyzing the energetics of the impact and the resulted fragment size distributions we give numerical evidence that the transition point between the damaged and fragmented states behaves as a critical point. The transition proved to be the lower bound for the occurrence of power law size distributions. The possible mechanism of the transition between the two states is discussed. In spite of the specific features of the system studied here, most of our results can be considered generally valid for impact phenomena mentioned above.
After giving a short summary of the main ingredients of our model in Sec. II., the numerical results concerning to the energetics of the collision process and to the size distribution of fragments will be presented in Secs. III. and IV., respectively. In Sec. V. we discuss the possible mechanism of the transition and some general consequences of our work for other types of fragmentation phenomena.
II The model
Recently, we have worked out a two-dimensional dynamical model of deformable, breakable granular solids, which enables us to perform molecular dynamics simulation of fracture and fragmentation of solids in various experimental situations [12, 13]. Our model is an extension of those models which are used to study the behavior of granular materials applying randomly shaped convex polygons to describe grains [27]. To capture the elastic behavior of solids we connect the unbreakable, undeformable polygons (grains) by elastic beams. The beams, modeling cohesive forces between grains, can be broken according to a physical breaking rule, which takes into account the stretching and bending of the connections. The breaking rule contains two parameters controlling the relative importance of the stretching and bending breaking modes, respectively. The energy stored in a beam just before breaking is released in the breakage giving rise to energy dissipation. The average value of the energy dissipated by the breakup of one contact defines the crack surface energy in the model solid as a function of the breaking parameters , and . At the broken beams along the surface of the polygons cracks are generated inside the solid and as a result of the successive beam breaking the solid falls apart. The fragments are defined as sets of polygons connected by remaining intact beams. In the framework of this discrete model one can introduce the notion of the binding energy as the energy released in the case of complete disintegration, i.e. in the case when all the fragments are single polygons. Hence,
| (1) |
where denotes the total number of grain-grain contacts in the solid. Note that is proportional to the volume of the sample and can be considered as a natural energy scale of the system.
The time evolution of the fragmenting solid is obtained by solving the equations of motion of the individual polygons until the entire system relaxes, i.e. there is no breaking of the beams during some hundreds consecutive time steps and there is no energy stored in deformation. For more details of the model’s definition see Refs. [12, 13].
We have applied the model to study shock fragmentation of solids in various experimental situations. Namely, simulations were performed to study the fragmentation of a solid disc caused by an explosion in the middle [12], the breaking of a rectangular block due to the impact with a projectile [12], and the collision of two macroscopic bodies (discs) [13]. The model proved to be successful in reproducing the experimentally observed subtleties of fragmenting systems, e.g. the power law mass distribution of fragments was found independent on the initial conditions, with an exponent in the vicinity of two, slightly depending on the initial energy [12, 13].
III Damage and fragmentation
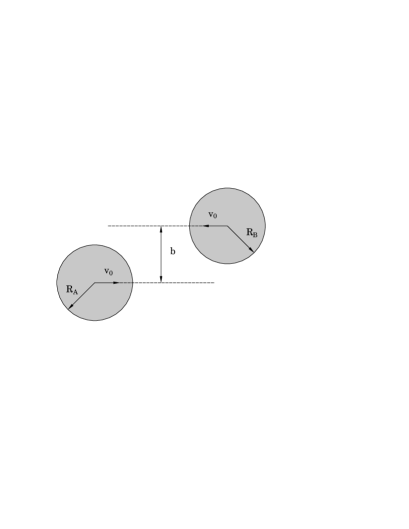
In the present paper we apply our model to explore the properties of impact fragmentation processes at low imparted energy. For this purpose we carried out molecular dynamics simulation of the collision of two solid discs of the same size, similar to Ref. [13]. The disc-shaped granular solid was obtained starting from the Voronoi-tessellation of a square [28, 29] and cutting out a circular window in the middle. This way of construction gives rise to a certain surface roughness of the particles. The schematic representation of the collision of two particles is depicted in Fig. 1. For simplicity, in the present studies only central collisions were considered, i.e. the value of the impact parameter was set to zero in all the simulations, and only the size of the particles and the surface energy were varied. In the simulations the energy-release by beam breaking is the only possible source of dissipation. The energy of the collision is defined as the total initial kinetic energy of the colliding bodies
| (2) |
where is the mass density and denotes the initial velocity of the particles. When is smaller than the so-called damage threshold , the collision results simply in elastic rebound without internal damage (without breaking of beams). To achieve damaging, has to surpass the damage threshold , which is determined by the surface energy of the model.
It is generally accepted that impact fragmentation phenomena exhibit so-called energy scaling, i.e. the result of the fragmentation process only depends on the value of the specific energy defined as the imparted energy divided by the total mass of the system. To characterize the collision events we introduce a dimensionless parameter with the definition
| (3) |
This choice of parameter has the advantage with respect to the specific energy that besides the dependence on the global size it includes also the specific material type through the surface energy . Since in the present study we focus on the evolution of damage with increasing impact energy, simulations were performed at fixed values of and varying in the range . Here corresponds to the damage threshold . Our results concerning to impact fragmentation at can be found in Ref. [13] including detailed analysis of the dynamics of the collision process and comparison to experiments. The values of the most important parameters of the present simulations are summarized in Table I.
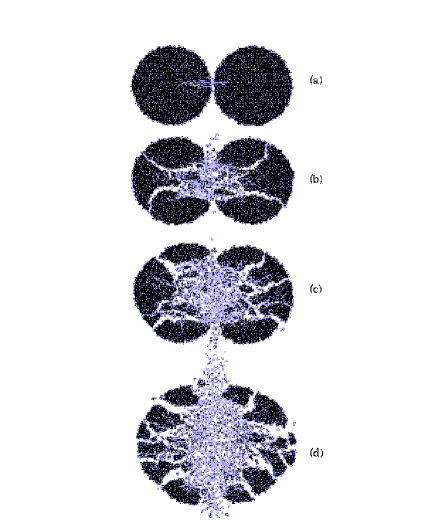
In Fig. 2 we present the final breaking scenarios (relaxed states) of the collision process obtained by simulations at four different values of . It can be observed that for (Fig. ) cracking by beam breaking mainly occurs in the vicinity of the contact surface of the two bodies and the bulk remains practically intact. Since this gentle collision does not cause size reduction of the two particles, this case can be considered as an inelastic impact of discs, where energy dissipation is solely due to internal damage. Increasing the impact energy , i.e. increasing , gives rise to more broken beams in Fig. and the solids break into pieces. Around the impact site of the bodies the fragments are smaller (single polygons, some pairs and triplets), and there are a few much larger fragments the size of which is still comparable to the original size of the bodies. Further increase of (Fig. mainly results in breakup of the large fragments into smaller ones giving rise to fragmentation of the entire solids. Based on the above qualitative picture, we classify the outcome of a collision into two states, i.e. damaged and fragmented states distinguished by the size of the largest remaining piece. The colliding bodies are considered to be damaged when the size of the largest piece is comparable to the original size of the bodies (see Fig. , while the fragmented state is characterized by the absence of such large pieces (Fig. . In the following we point out that the above qualitative picture is also supported by the quantitative analyzis of the energetics of the collision process and of the behaviour of the resulting size distribution of fragments. Namely, evaluating the energy released by the breaking of beams, and quantities related to the size distribution of fragments we will justify that the behaviour of the colliding system has two different regimes with a sharp transition in between.
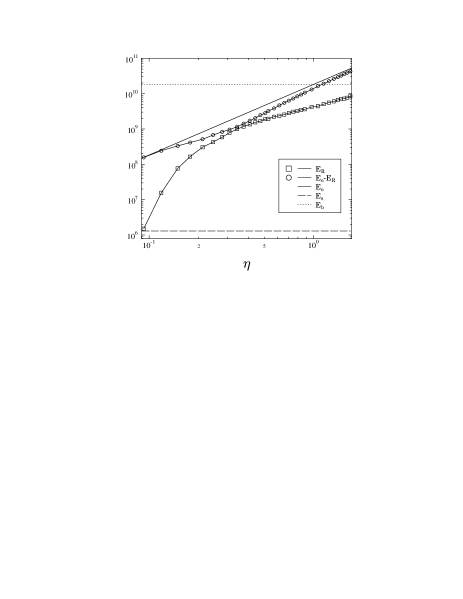
The energetics of the collision process corresponding to the samples of Fig. 2 is summarized on Figs. 3, and 4. Fig. 3 shows the energy released by beam breaking, together with the remaining kinetic energy stored in the motion of fragments as a function of . For the purpose of comparison, the surface energy of the model, the binding energy of the sample and the energy of the impact are also plotted in the figure. When the impact energy surpasses the damage threshold ( surpasses ) the released energy takes its smallest value, which is equal to the surface energy of the model (only one beam is broken). The largest possible value of is equal to the binding energy of the sample , which can only be reached in the case of complete disintegration. According to the simulations, this limiting case is hard to achieve, since on the surface of the colliding discs opposite to the impact site, small fragments comprising a few polygons can always escape. It can also be seen in the figure that the impact energy producing complete disintegration has to be much larger than the binding energy . Note that similar qualitative behaviour was found simulating free fall impact of a disc with a massive plate [16].
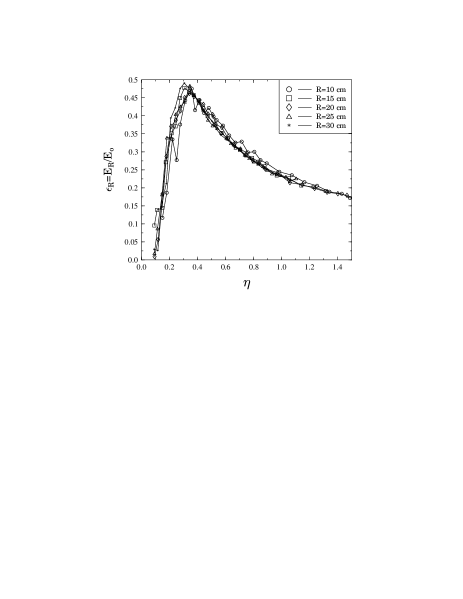
The most interesting observation of Fig. 3 is that the curve of versus is composed of two distinct parts, i.e. a rapidly increasing low energy part, and a slowly increasing high energy part. These two regimes are separated by a point where is practically equal to the remaining kinetic energy , which implies that at this point half of the total kinetic energy is released by cracking. The two regimes can be better observed in Fig. 4 where the ratio of and is plotted against . The curve of has a maximum, the value of which is in the vicinity of 0.5. This maximum separates a rapidly increasing and a slowly decreasing part, which we associate to the damaged and fragmented regimes introduced above, respectively. We identify the transition point between the two states with the position of the maximum called fragmentation threshold .
The separation of the two regimes and the identification of the transition point is also supported by the behaviour of the mass of the largest fragment as a function of . In Fig. 5 we present the sum of the mass of the largest fragments of the two bodies normalized by the total mass versus . The monotonically decreasing function has a distinct curvature change, the position of which coincides with the maximum of the energy release curve . This also confirms that the behaviour of the system sharply changes at a specific value of that we called fragmentation threshold .
To clarify the influence of the overall size of the colliding bodies on the behaviour of the fragmenting system, simulations were performed varying the radius of the particles between 10 and 30 cm. Note that the average size of the randomly shaped unbreakable polygons is 1cm. Fig. 6 shows as a function of for several values of . It can be observed that the qualitative behaviour of the curves is universal, it is independent on the system size, but the position of the transition point is slighly shifted downward with increasing .
IV The size distribution of fragments
To reveal the nature of the transition from the damaged to the fragmented state, the evolution of the fragment size distribution with varying impact energy is a crucial point. Since the dissipated energy is proportional to the total surface of cracks it is expected that the two regimes should clearly show up also in the type of disintegration of the solids, i.e. in the behaviour of the size distribution of fragments. In the present chapter we demonstrate that in the vicinity of the behaviour of the fragment size distribution shows strong similarities to that of the size distribution of clusters in systems undergoing second order phase transition. As an example, one can mention the behaviour of the cluster size distribution in percolation around the critical point , or the size distribution of droplets in the vicinity of the critical temperature in the case of the liquid-gas phase transition. Throughout this chapter we refer to percolation on finite lattices for the purpose of comparison.
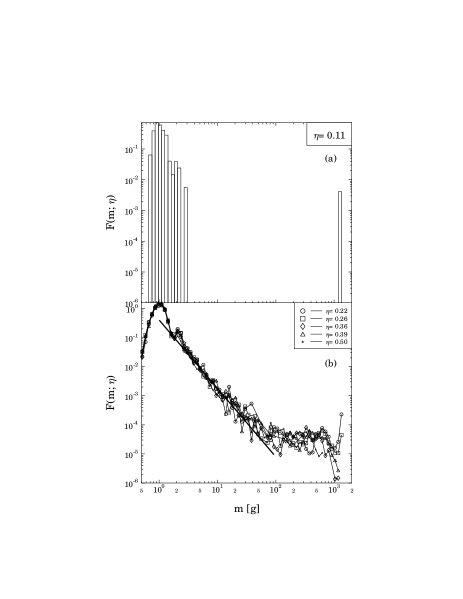
The fragment mass histograms corresponding to the colliding system of the preceding chapter are shown in Figs. for several values of below and above the transition point . Here denotes the number of fragments with mass divided by the total number of fragments, averaged over 10 collision events having the same . In order to obtain the same statistics of the distribution at all sizes a logarithmic bining was used, i.e. the bining is equidistant on logarithmic scale. The histograms have two cutoffs. The lower one is due to the existence of single unbreakable polygons while the upper one is determined by the finite size of the bodies.
In Fig. 2 we have shown that a collision at just above results in only a few small fragments and two big ones (with almost the same size) but no fragments are generated in the intermediate mass region. Hence, in Fig. the corresponding mass distribution has two peaks at small and at large mass with a large gap in between. Increasing in Fig. , the main difference compared to Fig. is that the peak of the large fragments gradually disappears, the large pieces break into smaller ones giving rise to fragments in the intermediate mass region. For the mass distribution in the intermediate region tends to a power law:
| (4) |
The value of the exponent obtained at is . Our former simulations showed (see Ref. [13]) that the power law behavior of remains valid for , but the value of the exponent is a decreasing function of , in agreement with most of the experimental observations [4, 5, 6, 7].
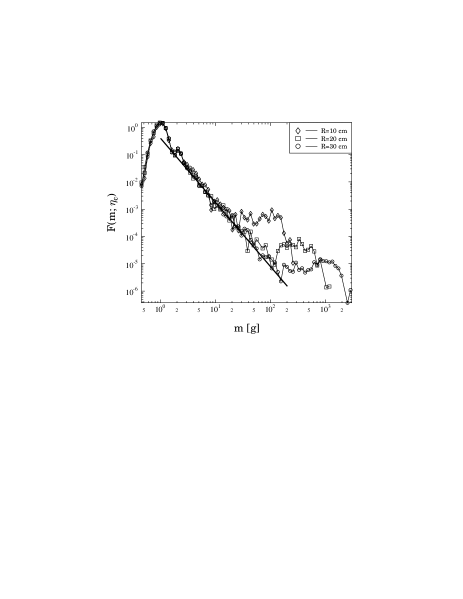
To clarify the effect of the overall size of the colliding bodies on the shape of the mass distribution and on the value of the exponent , in Fig. 8 we plotted the fragment size distributions at the transition point for three different values of . It can be seen that increasing the power law region of gets wider and the relative height of the hump at large fragments decreases, but the value of the exponent does not change. It is important to note that in the case of percolation on finite lattices the size distribution of clusters shows the same shape and dependence on the system size at the critical point [30].
More insight into the evolution of the shape of can be obtained by studying the moments of the distribution as a function of . The th moment of the histogram is defined as
| (5) |
In the case of critical phenomena like percolation or the liquid-gas transition the moments of the cluster size distribution with diverge at the critical point in the thermodynamic limit
| (6) |
where denotes the distance from the critical point, i.e. for percolation or for the liquid-gas transition. In a finite system the moments have a finite maximum at the transition point. Assuming gap scaling for [30]
| (7) |
the moment exponents can be expressed in terms of and
| (8) |
and the behavior of the system in the vicinity of the transition point can be characterized by only two independent exponents and .
To test whether our small systems exhibit some trace of this behavior we evaluated so-called single event moments defined as
| (9) |
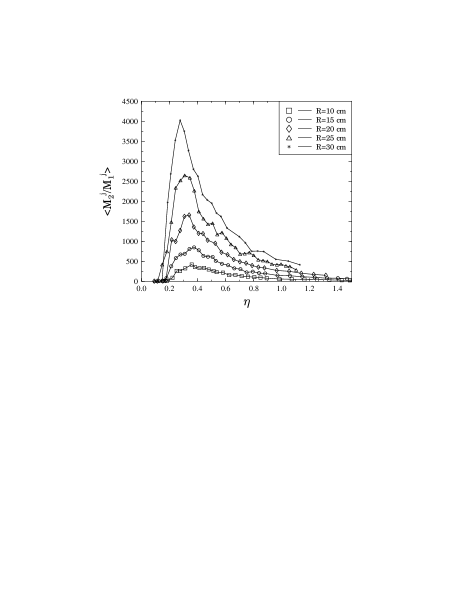
where the upper script refers to the th collision event, denotes the number of fragments with mass in event and the prime indicates that the sum runs over all the fragments excluding the largest ones of each of the two colliding bodies. The study of single event moments was first suggested by X. Campi to reveal properties of fragmentation processes with varying imparted energy [31, 32, 33]. As it was demonstrated in Refs. [31, 32, 33], the usage of single event moments defined by Eq. (9) instead of Eq. (5) has the advantage that part of the analysis, e.g. the study of the correlation of moments in scatter plots, can be carried out without ordering the collision events according to a parameter like in our case . Following Campi’s ideas, we evaluated the ratio of and
| (10) |
which is equal to the average fragment size in event . In Fig. 9 is plotted as a function of for several different values of the system size . The brackets denote that each data point was obtained as an average over 10 events having the same . One can observe that has a distinct maximum the position of which coincides with the maximum of the energy release curve in Fig. 6, within the precision of the calculations. It is very important to note that increasing the system size the peak of gets sharper, i.e. the height of the peak increases while the width of the peak decreases, which is also typical for a critical point like the percolation threshold occurring in finite size systems [30, 31, 34].
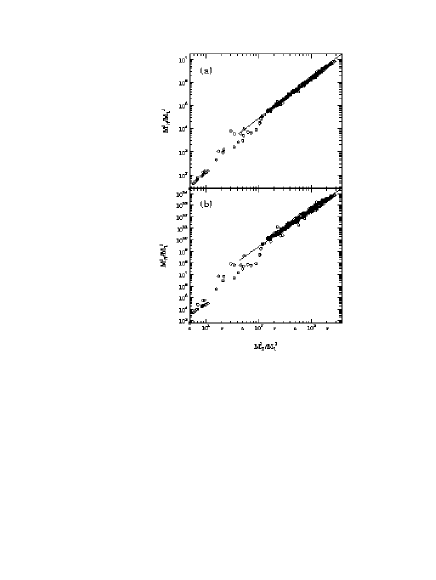
The validity of gap scaling Eq. (7) for the mass distribution can be easily tested by making scatter plots of moments , i.e. by plotting against with , then checking the correlation of the moments and the validity of the relation of the exponents Eq. (8). The scatter plot of two pairs of moments is shown in Fig. 10. For the purpose of normalization the moments with are divided by . In Fig. 10 the collision events close to the transition point are represented by points with the largest values of the moments. Events with far below or far above result in smaller values of , hence, the corresponding points in Fig. 10 fall closer to the origin. One of the most remarkable features of Fig. 10 is that the moments are strongly correlated in the region corresponding to the vicinity of the transition point and a power law seems to be a reasonable fit to the scattered points. By this fitting procedure one obtains numerically the ratio of the moment exponents and since
| (11) |
The value of the exponents obtained as the slope of the straight lines in Fig. 10 are and , which are in agreement with the corresponding predictions 2.36 and 5.11 substituting into Eq. (8).
Hence, we conclude that, within the limited precision available in our small system, the mass distribution of fragments fulfills the gap scaling relation Eq. (7), and the damage-fragmentation transition occurs as a continuous phase transition. The control parameter of the transition can be identified with the parameter , and the quantity characterizing the size reduction can be considered as the order parameter. To complete the characterization of our system around we determined numerically the value of the order parameter exponent defined as [35]
| (12) |
and the value of the exponent characterizing the average fragment size
| (13) |
The power law behavior given by Eq. (13) is valid on both sides of the critical point . (Note that .) Using the data presented in Fig. 5 we plotted versus for in Fig. 11. It can be seen that a power law with an exponent gives a reasonable fit to the data. In Fig. 12 belonging to the system size of Fig. 9 is depicted as a function of for . Again a power law with an exponent can be fitted with a reasonable quality. Since only two of the critical exponents are independent, we can check the consistency of our description by pairing the exponents and using the well known scaling laws [30, 35] of critical phenomena to obtain the value of the other exponents. It can be observed in Table II that the numerical values of the exponents obtained by starting from the three possible pairs agree well with each other within the error bars, which gives further justification of our phase transition picture.
V Discussion
In the present paper we applied our dynamical model of granular solids to study impact fragmentation phenomena at low values of the imparted energy. Analyzing the energetics of the fragmentation process and the resulting size distribution of fragments we identified two distinct final states of the impact process, i.e. damaged and fragmented states with a sharp transition in between. With a detailed study of the behavior of the fragment mass distribution in the vicinity of the transition point and its dependence on the finite particle size we gave numerical evidence that the transition point behaves as a critical point and the damage-fragmentation transition occurs as a continuous phase transition. The control parameter of the transition was chosen to be the dimensionless ratio of the energy of impact and the binding energy of the sample, and the order parameter was associated to the mass of the largest fragment divided by the total mass.
Based on the time evolution of the collision process obtained by the simulations, the following qualitative picture of the mechanism of the transition can be established: when two macroscopic solids collide damage first occurs in the surroundings of the contact zone of the bodies. After this contact damage a compressive elastic pulse expands radially through the bodies the amplitude of which strongly depends on the amount of primary damage occurred in the contact zone. The pulse reflects back from the free boundary and after reflection tensile forces arise in the solids resulting in cracks in the bulk. The amount of breaking in the bulk is mainly determined by the amplitude of the initial pulse remaining after contact damage. The fragmentation of the colliding solids occurs above a specific value of the impact energy where the amplitude of the remaining pulse will be sufficient to give rise to the complete break up of the bulk into pieces. At this specific energy value the behavior of the colliding system sharply changes as we demonstrated by analyzing the energetics and the size distribution of fragments.
The idea of the existence of a so-called fragmentation phase transition was first addressed in the field of nuclear physics where the fragmentation of heavy nuclei due to impact is extensively studied (for a recent review see Ref. [36]). Using percolation based ideas it was shown that the disassembly of excited nuclei possesses a continuous phase transition when the imparted energy is varied [31, 32, 33, 34]. The order parameter of the transition was associated to the size (charge) of the largest fragment.
Recently, the penetration of a steel ball into a solid plate with varying impact energy was studied experimentally [37]. It was reported that the so-called ballistic limit, i.e. the impact energy where the perforation of the plate occurs, behaves as a critical point, and the perforation occurs as a continuous phase transition the order parameter of which was chosen to be the mass of ejecta expelled from behind the target. It was argued that the mechanism of the phase transition is the coalescence and percolation of randomly nucleated microcracks.
In the analysis of the numerical results obtained by the computer simulation of our dynamical model, we referred to the theory of percolation on finite lattices just as an example of critical phenomena occurring in finite systems, without assuming percolation of microcracks. In this sense our analysis is free of model assumptions. In the snapshots of the final scenarios of collision processes it can be seen that the complicated elastic field arising due to propagation and interference of elastic waves gives rise to correlated crack growth. Hence, in our case the assumption of percolation of cracks cannot be valid, and the values of the exponents obtained numerically are different from the corresponding exponents of percolation.
An important feature of our model which can affect the result of a fragmentation process is the existence of elementary, non-breakable polygons, which hinders us from observing fragmentation on lower scales. In Ref. [15], using a discrete model of solids similar to ours, detailed tests of the effect of the polygon size on the shape of the mass distribution of fragments in impact fragmentation were performed. It was found that if the tessellation of a solid is fine enough to reproduce the macroscopic elastic behavior correctly, the effect of the existence of unbreakable polygons on the size distribution of fragments occurs solely in the vicinity of the cutoff size, and the overall shape of the distribution is not affected. This also implies that the phase transition behavior revealed by our simulations is not influenced globally by the element size, but it can be expected that the critical regime gets narrower when the element size decreases at a fixed value of the macroscopic size of the colliding bodies.
Studying kinetic models of fragmentation phenomena in Refs. [23, 38] it was pointed out that under certain circumstances a so-called shattering transition might occur, when a macroscopic amount of mass of the fragmenting system is transformed into a dusty phase, i.e. into single polygons in our case. Since in discrete dynamical models such a shattering transition can occur only at very high impact energies its investigation is not included in the present study.
The binary break-up of bond percolation clusters due to the removal of a single bond has also been studied in the context of fragmentation phenomena. The characteristic quantities describing the fragmentation of percolation clusters are the number of fragmenting bonds , i.e. the number of those bonds in the cluster of size whose removal results in two disconnected clusters, and the probability that the break-up of a cluster of size results in a daughter cluster of size [39]. and are of fundamental interest because they describe the connectivity of percolation clusters and they may also serve as an input for the rate equations describing fragmentation processes as a sequence of binary events [23, 38, 39]. At the critical point both and show interesting scaling behavior whose scaling exponents could be related to the critical exponents of percolation [39], but no phase transition was claimed in the break-up process. Although the form of as a function of the daughter mass and its dependence on the global size of the fragmenting object [39] is similar up to some extent to the behavior of our fragment mass distribution at the critical point (see Fig. 8), there is no direct analogy between the binary break-up of percolation clusters and our dynamic fragmentation process.
Up to our knowledge no systematic experimental study of the transition from damage to fragmentation in impact of solids has been performed so that we cannot confront the results of the simulations with experiments. For a deeper understanding of the transition predicted by our simulations further experimental and more analytical theoretical studies are needed.
VI Acknowledgment
We thank the referee for drawing our attention to the binary break-up of percolation clusters. F. Kun is very grateful to R. Englman, Z. Jäger and K. F. Pál for the valuable discussions and for sending him reprints of their works on fragmentation. F. Kun acknowledges financial support of the Alexander von Humboldt Foundation (Roman Herzog Fellowship) and that of the projects SFB381 and OTKA T-023844.
REFERENCES
- [1] Statistical Models for the Fracture of Disordered Media, edited by H. J. Herrmann and S. Roux (North Holland, Amsterdam, 1990).
- [2] Fragmentation Phenomena, edited by D. Beysens, X. Campi, and E. Pefferkorn (World Scientific, 1995).
- [3] D. L. Turcotte, J. of Geophys. Res. 91 B2, 1921 (1986).
- [4] N. Arbiter, C. C. Harris and G. A. Stamboltzis, Soc. of Min. Eng. 244, 119 (1969).
- [5] T. Matsui, T. Waza, K. Kani and S. Suzuki, J. of Geophys. Res. 87 B13, 10968 (1982).
- [6] A. Fujiwara and A. Tsukamoto, Icarus 44, 142 (1980).
- [7] A. Fujiwara at al., in Asteroid II, edited by R. P. Binzel, T. Gehrels, and M. S. Matthews (Univ. Arizona Press, Tucson, 1989).
- [8] L. Oddershede, P. Dimon, and J. Bohr, Phys. Rev. Lett. 71, 3107 (1993).
- [9] A. Meibom and I. Balslev, Phys. Rev. Lett. 76, 2492 (1996).
- [10] H. Inaoka, E. Toyosawa, and H. Takayasu, Phys. Rev. Lett. 78, 3455 (1997).
- [11] T. Kadono, Phys. Rev. Lett. 78, 1444 (1997).
- [12] F. Kun and H. J. Herrmann, Comput. Meth. Appl. Mech. Eng. 138, 3 (1996).
- [13] F. Kun and H. J. Herrmann, Int. Jour. Mod. Phys. C 7, 837 (1996).
- [14] A. V. Potapov, M. A. Hopkins and C. S. Campbell, Int. J. of Mod. Phys. C 6, 371 (1995).
- [15] A. V. Potapov, M. A. Hopkins and C. S. Campbell, Int. J. of Mod. Phys. C 6, 399 (1995).
- [16] C. Thornton, K. K. Yin and M. J. Adams, J. Phys. D Appl. Phys. 29, 424 (1996).
- [17] W. Benz and E. Asphaug, Icarus 107, 98 (1994).
- [18] S. Steacy and C. Sammis, Nature 353, 250 (1991).
- [19] H. Inaoka and H. Takayasu, Physica A 229, 1 (1996).
- [20] M. Marsili and Y. C. Zhang, Phys. Rev. Lett. 77, 3577 (1996).
- [21] J. Åström and J. Timonen, Phys. Rev. Lett. 78, 3677 (1997).
- [22] J. Åström, M. Kellomäki and J. Timonen, Phys. Rev. E 55, 4757 (1997).
- [23] R. Botet and M. Ploszajczak, Int. Jour. Mod. Phys. E 3, 1033 (1994).
- [24] R. Englman, J. Phys.: Condens. Matter 3, 1019 (1991).
- [25] G. Hernandez and H. J. Herrmann, Physica A 215, 420 (1995).
- [26] F. G. Bridges, A. Hatzes, and D. N. C. Lin, Nature 309, 333 (1984).
- [27] H. J. Tillemans and H. J. Herrmann, Physica A 217, 261 (1995).
- [28] C. Moukarzel and H. J. Herrmann, J. Stat. Phys. 68, 911 (1992).
- [29] K. B. Lauritsen, H. Puhl and H. J. Tillemans, Int. J. Mod. Phys. C 5, 909 (1994).
- [30] D. Stauffer and A. Aharony, Introduction to Percolation Theory (Taylor and Francis, London, 1992).
- [31] X. Campi, J. Phys. A 19, L917 (1986).
- [32] X. Campi, Phys. Lett. B 208, 351 (1988).
- [33] X. Campi and H. Krivine, Z. Phys. A 344, 81 (1992).
- [34] W. Bauer, Phys. Rev. C 38, 1297 (1988).
- [35] N. Goldenfeld, Lectures on Phase Transitions and the Renormalization Group, (Adison-Wesley, 1992).
- [36] J. S. Sá Martins and P. M. C. de Oliveira, Int. Jour. Mod. Phys. C 9, 881 (1998).
- [37] A. H. Mayer, Z. Jäger, and R. Englman, in the Proceedings of 15th International Symposium on Ballistics, Jerusalem, Israel 1995.
- [38] S. Redner, in Ref. [1].
- [39] M. F. Gyure and B. F. Edwards, Phys. Rev. Lett. 68, 2692 (1992); B. F. Edwards, M. F. Gyure, and M. Ferer, Phys. Rev. A 46, 6252 (1992); J.-M. Debierre, Phys. Rev. Lett. 78, 3145 (1997).
| Failure elongation of a beam | % | 3 | |
|---|---|---|---|
| Failure bending of a beam | 4 | ||
| Surface energy | |||
| Damage threshold | |||
| 1 | 0.08 | ||
| Range of velocities | 200 - 3500 |