Dynamics of Granular Stratification
Abstract
Spontaneous stratification in granular mixtures—i.e. the formation of alternating layers of small-rounded and large-faceted grains when one pours a random mixture of the two types of grains into a quasi-two dimensional vertical Hele-Shaw cell—has been recently reported by H. A. Makse et al. [Nature 386, 379 (1997)]. Here we study experimentally the dynamical processes leading to spontaneous stratification. We divide the process in three stages: (a) avalanche of grains and segregation in the rolling phase, (b) formation of the “kink”—an uphill wave at which grains are stopped—at the bottom substrate, and (c) uphill motion of the kink and formation of a pair of layers. Using a high-speed video camera, we study a rapid flow regime where the rolling grains size segregate during the avalanche due to the fact that small grains move downward in the rolling phase to form a sublayer of small rolling grains underneath a sublayer of large rolling grains. This dynamical segregation process—known as “kinematic sieving”, “free surface segregation” or simple “percolation”— contributes to the spontaneous stratification of grains in the case of thick flows. We characterize the dynamical process of stratification by measuring all relevant quantities: the velocity of the rolling grains, the velocity of the kink, and the wavelength of the layers. We also measure other phenomenological constants such as the rate of collision between rolling and static grains, and all the angles of repose characterizing the mixture. The wavelength of the layers behaves linearly with the thickness of the layer of rolling grains (i.e., with the flow rate), in agreement with theoretical predictions. The velocity profile of the grains in the rolling phase is a linear function of the position of the grains along the moving layer, which implies a linear relation between the mean velocity and the thickness of the rolling phase. We also find that the speed of the upward-moving kink has the same value as the mean speed of the downward-moving grains. We measure the shape and size of the kink, as well as the profiles of the rolling and static phases of grains, and find agreement with recent theoretical predictions.
I Introduction
Size segregation of granular mixtures [1, 2, 3, 4, 5, 6, 7] is known to occur when mixtures are exposed to external periodic perturbations. A much-studied size segregation phenomenon is known as the “Brazil nut effect” [8, 9, 10, 11, 12] and occurs when, upon vibration, larger grains rise on a bed of finer grains. Axial size segregation in alternating bands consisting of small and large grains occurs when a mixture of grains is placed in a horizontal rotating cylinder [13, 14, 15, 16]. It is also known that even in the absence of external perturbations mixtures of grains of different sizes can spontaneously segregate. For example, when a mixture of spherical grains of different sizes is poured onto a heap, the large grains are more likely to be found near the base, while the small grains are more likely to be near the top [17, 18, 19, 20, 21, 22, 23, 24, 25, 26].
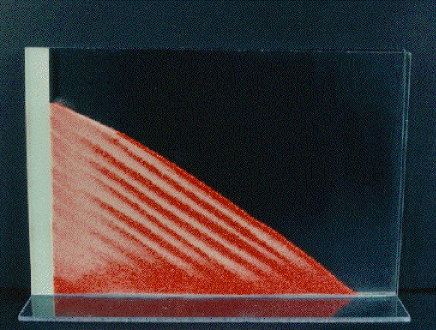
Another type of segregation, called spontaneous stratification, arises when the grains composing the mixture differ not only in size but also in shape (or friction properties). When a mixture of large grains that are more faceted and small grains that are less faceted is poured in a “granular Hele-Shaw cell” (two vertical slabs separated by a gap of typically 5–10 mm), the mixture spontaneously stratifies into alternating layers of larger faceted grains and smaller rounded grains [27]. Figure 1a shows an example of such stratification. A mixture of large cubic sugar grains (typical diameter 0.8 mm) and smaller spherical glass beads (diameter 0.19 mm) is poured in the cell. We notice the striped pattern with approximately constant wavelength.
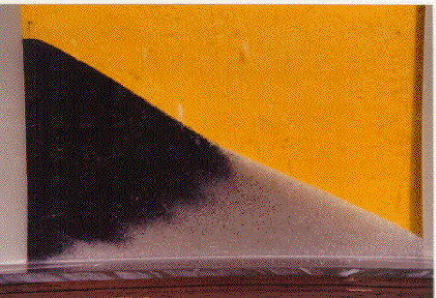
In contrast, when the mixture is composed of larger less faceted grains and smaller more faceted grains, the mixture only segregates—i.e., the small more-faceted grains are found preferentially at the top of the cell, while the large less-faceted grains are found near the bottom [27]. Figure 1b shows an example of such segregation, when a mixture of small faceted sand grains (typical size 0.3 mm) and large spherical glass beads (typical size 0.8 mm) is poured in the cell.
The dynamical process leading to spontaneous stratification was recently studied theoretically [28, 29, 30, 31] using discrete models, and a set of continuum equations for surfaces flows of granular mixtures developed in Refs. [32, 33, 34, 35]. In this theoretical formalism, the grains are considered to belong to one of two phases: a static or bulk phase if the grain is part of the solid sandpile, and a rolling or liquid phase if the grain is not part of the sandpile but rolls downward on top of the static phase. In Ref. [28] the dynamics of spontaneous stratification was found to be governed by the existence of a “kink” at which the grains are stopped during an avalanche.
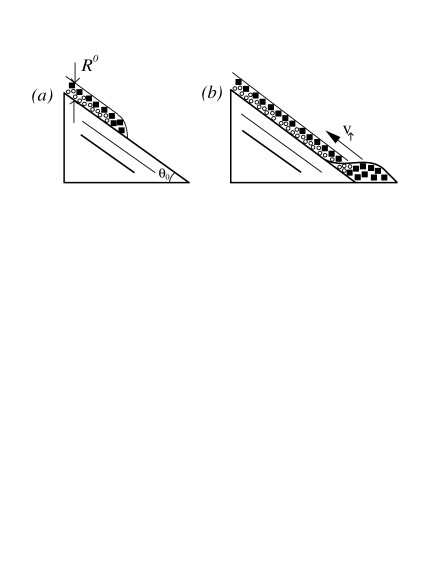
In this paper, we study experimentally the dynamical processes leading to spontaneous stratification. Using a high speed video camera to study the motion of the grains in great detail, we divide the dynamical process of stratification into three stages (see Fig. 2):
-
(a)
The avalanche of grains down the slope, and size segregation of grains in the rolling phase due to “percolation”.
-
(b)
The formation of the “kink”—an uphill wave at which grains are stopped.
-
(c)
The uphill motion of the kink and formation of a pair of layers.
(a)
(b)
We study a well-developed flow regime where the rolling grains segregate during the flow. In this regime the thickness of the layer of rolling grains is larger than the typical size of a grain (typically 5), and the smaller rolling grains are found to percolate downward in the rolling phase to form a sublayer of smaller rolling grains underneath the sublayer of larger rolling grains. This dynamical size segregation process, known as “percolation” or “kinematic sieving” [20, 21, 23, 24, 25], contributes to the stratification of grains.
Stratification is an instability developed due to a competition between size segregation and shape segregation [29]. In the case of thin flows, size segregation occurs since the smaller grains are captured more easily than larger grains. In the case of thick flow regimes study here, the kinematic sieving in the rolling phase is mainly responsible for the size segregation of the grains. Since the larger grains are on top of the rolling phase, they are convected further down than the smaller grains, producing the size segregation effect, which together with the segregation due to different shape of the grains, gives rise to the instability leading the system to spontaneously stratify [29]. It is important to note that percolation in the rolling phase is not sufficient condition to obtain stratification. For thick flows and when the large grains are smoother, segregation in the rolling phase still occurs, and yet we do not get stratification but only the sharp segregation pattern of Fig. 1b.
A large difference in size is also a condition for the percolation effect to take place— usually , where is the ratio of the size of the large grains to the size of the small grains. We performed a series of experiments with mixtures of glass beads and sand with and found continuos segregation patterns (as opposed to the sharp segregation pattern with a separation zone of a few centimeters of Fig. 1b obtained for ) no matter the shape of the grains. This is because, when the effect of size segregation is very weak.
The limiting case in which both species of grains are spherical was first studied by Williams [19, 36, 37]; his results (showing segregation plus a hint of stratification) differ from our results for this case (showing only segregation). We believe that the reason is that the grains used by Williams were not quite spherical, inducing some shape segregation as well. According to the above interpretation, we note that experiments with mixtures of perfect spherical beads differing only in size should not show stratification since the shape segregation effect is not present and size segregation alone (even due to percolation) is not able to produce stratification— and our work confirms these expectations. However some oscillations might still be present around the stable segregation profile, as seen in previous experiments using mixtures of spherical beads [37].
Here we focus on the regime where segregation in the rolling phase takes place. We characterize the kinematic percolation process, and measure the velocity gradient of the grains during the avalanche. We find a linear velocity profile of the rolling grains, and that the mean velocity of the rolling grains is the same as the velocity of the kink. We also study the shape and size of the kink—and thereby measure the wavelength of the layers. We find that the wavelength increases linearly with the flux of grains, a result in agreement with recent theoretical predictions [28]. We also measure the profiles of the rolling grains and static phases of the pile, and the values of several phenomenological coefficients which appear in the theory for surface flows of granular mixtures. Our results are valid for flow rates of the order of gr/sec (which gives rise to a rolling phase less than 1 cm thick). We also comment on the applicability of our results, and on the deviations that may occur for smaller and larger flow regimes.

II Experimental setup
Our experimental setup consists of a granular Hele-Shaw cell: a vertical “quasi-two-dimensional” cell with a narrow gap separating two transparent plates (made of plexiglass, or of glass). The cell measures cm of lateral size and cm high, and the gap is cm. We close the left edge of the cell. We clean the walls of the cell with an antistatic cleaner in order to avoid the effects of electrostatic interaction between the grains and the wall.
In this study, we focus on spontaneous stratification. In all our experiments, we use a mixture of grains composed of two species differing in size and shape: smaller glass beads of average diameter mm, spherical shape ( sphericity), angle of repose (we call these type 1 grains), and larger faceted sugar grains of typical size mm, approximate cubic shape and angle of repose (type 2 grains).
The typical size of the sugar grains obtained by measuring the volume of the cubic grains and calculating the typical size as the cubic root averaged over 20 different grains. We obtain the value of the angle of repose of the species by pouring the pure species in the Hele-Shaw cell and measuring the resulting angle of the pile, averaging over 5 realizations of the sandpile. The angle thus measured is not the actual angle of repose corresponding to a conical pile, since the presence of the wall induces extra friction that slightly increases the equilibrium angle of the pile [38]. However, we are interested in the angle of repose for this specific geometry since our experiments on stratification are done in the cell.
We fill the cell at different rates of adding grains (flux). We use a Kodak Ektapro 1000 digital high speed camera to film the motion of individual grains during the formation of the layers. The camera produces 1000 digital frames per second with a resolution of 238 191 pixels. We record images during 1.6 sec, and achieve longer recording times by lowering the frame rate. The digital images we download to a workstation for further image processing.
III The angle of repose of the pure species
Since stratification is related to the different angles of repose of the pure species, we first study how the angle of repose depends on the size and shape of the grains. We measure the angle of repose of different sets of spherical glass beads of different size, and find the same value within errors bars (see Fig. 3). The angle of repose does not depend on the size of the grains, since a simple isotropic rescaling of the pile coordinates transforms a pile of smaller spherical grains into a pile of large spherical grains, while leaving invariant the angle of the pile.

The value of the angle of repose we find for the spherical glass beads is smaller than the value we find for the cubic sugar grains. In general, we find that the angle of repose does not depend on the size of the grains, and is a function of the shape of the grains: the rougher the shape of the grains the larger the angle of repose—because for more faceted grains the packing of grains is less dense than for more rounded grains.
A particular case is found when the size of the grains is of the order of microns. Spherical beads of size m have a larger angle of repose than the same spherical beads but of size of the order of mm (see Fig. 3)—because adhesion forces become important, increasing the angle of repose of the species. The scale of microns is the lower limit of applicability of our results, since at the submicron scale particles undergo Brownian motion [7] and our analysis of collisions and transport at zero temperature ceases to be valid.
IV The Kink Mechanism
A physical mechanism has been proposed for the formation of the layers which is related to the existence of a “kink” [27, 28, 30]. Suppose, e.g., that a pair of static layers is formed with the layer of larger grains on top of the layer of smaller grains. When an incoming mass of grains avalanches down the slope, the larger grains reach the base of the pile first, due to the fact that large grains do not tend to get trapped (in local minima of the sandpile profile) as easily as small grains. Additionally, in the case of rapid flows, the smaller grains also size segregate to the bottom of the rolling phase due to percolation so that the larger grains, being at the top of the rolling phase, tend to travel further since they do not interact with the bulk phase.
During the avalanche of grains, some small grains are captured in the static layer of large grains, smoothing the surface and thereby allowing more small grains to fall downward and eventually reach the bottom of the pile. When the flow reaches the base of the pile, we see that the grains develop a profile characterized by a well-defined “kink” at which the grains are stopped. This kink moves in the direction opposite to the flow of grains, conserving its profile until it reaches the top of the pile.
In the process of falling down the slope, grains (small and large) stop at the kink. We see that the smaller grains stop first (since the small grains are already segregated in the rolling phase) so a pair of layers forms, with the smaller grains underneath the large grains (see Fig. 1b). When the kink profile reaches the top of the sandpile, the pair of layers is completed. Then this process is repeated: a new avalanche occurs, some larger grains reach the bottom of the pile, the kink is developed, and a new pair of layers is formed.
The size of a pair of layers is determined by the thickness of the layer of rolling grains during an avalanche, , which in turn is determined by the flux of adding grains. The volume of rolling grains that reaches the kink during a time interval and in a differential is
| (1) |
where is the velocity of the rolling grains at a distance from the pile surface of static grains, is the upward velocity of the kink which is constant, and is the gap between the plates of the cell. The first term in (1) is the volume of grains falling down the slope, and the second term represents the volume of grains from the rolling phase that the kink encounters when it advances uphill at velocity —i.e., is the velocity of the rolling grains in the co-moving frame of the kink.
The volume of grains in a well-formed kink is
| (2) |
Then if all the grains are stopped at the kink, the number of rolling grains falling down, , where is the density of the fluid phase (the number of rolling grains per unit volume) should scale as the volume of grains in the kink , where is the density of the bulk phase. Hence
| (3) |
The mean value of the downward velocity of the grains averaged over the rolling phase is
| (4) |
| (5) |
The analytical shape of the kink has been obtained in [28, 30]. We introduce four different generalized angles of repose , corresponding to the interactions between a rolling grain of type and a static grain of type :
-
corresponds to the angle of repose of the pure large-cubic species,
-
is the repose angle of the pure small-rounded species (), and
-
correspond to the interaction between a large cubic rolling grain and small-rounded static grains, and
-
correspond to the interaction between a small-rounded rolling grain and large cubic static grains.
Since the kink is a traveling wave solution, we can write [28, 30]
| (7) |
where , is the angle of the pile after a pair of layers is formed, and is the height of the static phase (Fig. 2c). The solution for the lower layer of small grains is [28]
| (8) |
where
| (9) |
, and (units of 1/sec) is the rate of collisions between static and rolling grains. Since we have a pile made of two different species, the angle of the layers is not necessarily either nor . However, since the top layer of the stripes is made of large-cubic grains, the resulting angle is closer to than to .
The solution for the profile of the upper layer of the kink is [28]
| (10) |
where
| (11) |
We will compare this solution with the profile of the kink measured experimentally. Figure 2c shows a sketch of the kink. The angle of the layers is , which is an angle between and , so that solutions (8) and (10) exist. The lower part of the kink is made of small-rounded grains and therefore has an angle close to . At the center of the kink, the larger grains are captured on top of smaller grains, therefore the angle decreases toward the cross-angle of repose . Then the angle of the profile of the kink approaches .
Dimensional analysis of Eq. (8) indicates that the upward velocity of the kink is proportional to the flux of arriving grains, i.e. proportional to [28],
| (12) |
Here is a numerical constant that does not depend on or , but may depend on the angles of repose and other features of the grains.
Below, we will show that the velocity of the rolling grains in an avalanche increases linearly with the height of the grains in the rolling phase, implying that the mean value of the velocity is proportional to the thickness of the rolling phase. The coefficient is again proportional to by dimensional analysis,
| (13) |
where is also a numerical constant that does not depend on or , but may depend on the angles of repose.
From Eqs. (5), (12) and (13) we obtain the dependence of the wavelength on
| (14) |
where , is a constant independent of . Thus, the wavelength increases linearly with the flux of grains. We will test Eqs. (8)-(14) experimentally.

V Dynamics of stratification
To test the above mechanism, we perform a series of six experiments where we study in detail the dynamics of stratification by measuring all the quantities involved in the process. We use a Kodak Ektapro 1000 high-speed video camera system to record the motion of the grains. In order to study the profile of the kink and the effects of percolation in the rolling phase, we measure the profile of the static and rolling phases and compare with analytical predictions. We measure the velocity of the rolling grains, the velocity of the kink, the wavelength of the layers, and also other phenomenological constants such as , and all four angles of repose characterizing the mixture .
According to the picture discussed in Sec. IV, we study the dynamical process of stratification by dividing the process in three stages (Fig. 2):
(a) 
(b) 
A Avalanche of grains and percolation effect
In all six experiments, we use the same mixture and cell, but different fluxes—i.e., different (see Table I). We focus our study on a small window of observation of typically 3 cm 2 cm size located in the center of the pile. Using the high speed video camera at a frame rate of 1000 frames per second, we are able to track the motion of each individual grain in a downhill avalanche during 1.6s of recording time. The rolling grains take only 0.1s to cross the window of observation. However, we continue recording after this time elapses, so that we can record in the same shot of 1.6s the grains flowing down and the profile of the kink moving up. By tracking the motion of each individual grain, we are able to measure the velocity profile of the grains along the layer of moving grains.
The thickness of the layer of rolling grains in all our experiments ranges from cm to cm. Thus the layer of rolling grains is thick enough that it is possible to observe the size segregation of the grains in the rolling phase. For a well-developed flow of grains down an inclined plane, the grains segregate in the moving layer, with the small grains at the bottom of the moving layer, and the large grains at the top. This effect is called “free surface segregation”, “percolation” or “kinematic sieving” [20, 21, 23, 24, 25], and occurs because the smaller grains percolate downward through the gaps left by the motion of larger grains in the rolling phase. In our experiments, the flux of grains is sufficiently high that the layer of rolling grains is large enough that the percolation effect can be observed in the rolling phase. Figure 4 shows the trajectories of several grains for Experiment (Table I) in a window of 2.82 cm by 2.26 cm, plotted every two frames (ms). We find that the large grains occupy the top part of the moving layer, and the small grains are located at the bottom of the moving layer.

To measure the velocity profile of the grains in the rolling phase, the position of every rolling grain is spotted on the screen of the video camera. We follow the trajectory of the grain during a period of time where the rolling grain is well distinguished from the other grains in the moving phase. We stop the image every 2ms (2 frames) and record the () position in pixels of the screen. The position thus measured is manually entered in a data file, giving the () position of the grain as a function of time. We study the motion of the grains in the center of the pile, where the grains have achieved a constant velocity along the direction of the pile surface (the viscous friction force has balanced the gravitational driving force on the grain). Figure 5 shows the and coordinates of the grains of Fig. 4 as a function of time. The velocity of the grains we calculate from the slope of such curves. Indeed, we observe that the motion of the grains in the center of the pile is overdamped; the velocity is constant as a function of time.
Due to the percolation effect, the layer of rolling grains is actually made of two equal size sublayers (since we use an equal volume mixture of two species) of smaller and larger grains. However, the velocity profile of the grains is continuous along the thickness of the moving layer. Figure 6 shows the velocity of the grains for the six experiments listed in Table I as a function of , the height of the rolling grain to the top of the static phase. The velocity profile is linear in . Using the data from the experiments listed in Table I we find
| (15) |
The coefficient of the linear relation (15) is independent of , implying that the mean value of the velocity of the grains (4) is proportional to
| (16) |
By comparing with Eq. (13) and assuming that the coefficient is of the order of one, we obtain an estimate of the rate /sec. Similar velocity profiles have been found in Ref. [40], although these results (which were obtained for single-species grains falling down inclined planes at different angles above the angle of repose) do not apply to our system, since we are interested in the velocity profile of the grains avalanching on a surface composed of large grains at the angle of the layers, as occurs in the stratification experiment.
B Formation of the kink
The formation of the kink is determined by the interaction of the grains at the bottom of the pile. When the grains reach the substrate, we find that the larger grains arrive first and then the smaller grains arrive (Fig. 7a), because the larger grains roll down more easily than the smaller grains, since they are at the top of the rolling phase due to percolation. They have larger velocity than the small grains since they are at the top of the rolling layer (Fig. 7a). The large grains are stopped at the substrate, and they develop the profile shown in Fig. 7b.
The condition for the formation of the kink seems to be the existence of two species, not one. In fact, when we pour single-species grains in a open cell, we do not observe the stationary kink, but we observe that the height of the pile and the profile of the rolling phase acquire a steady state (without oscillations) where the profiles are conserved in time. In the case of two species, the larger grains reaching the bottom before the smaller grains act as a “wall” or “incipient kink” where the smaller grains are stopped (Fig. 7b). Thus, when the small grains arrive near the substrate, they find some large grains already there. They are stopped in this way, and the kink emerges from this interaction. When the kink is developed it starts to move uphill with constant velocity and conserving its profile.
de Gennes [7] has shown that when a flow of single-species grains flowing down a plane at the angle of repose reaches a vertical wall, the grains develop an uphill wave of constant velocity . Although this uphill wave is not stationary as found for the kink in our experiment, the solution found by de Gennes shows that it is possible for the smaller grains to be stopped by a moving “wall” of large grains and thereby give rise to a kink. The existence of uphill waves (although not stationary as the kink solution) was also noticed in Refs. [32, 33].
C Uphill motion of the kink and formation of a pair of layers
By using the video camera at a frame rate of 1000 frames/sec, we can distinguish the fraction of grains which is in the rolling phase and the fraction of grains which is strictly immobile, the fundamental ingredient of the theories of Refs. [32, 33, 34, 35, 28, 30, 29]. Thus we identify the time behavior of the boundary between the rolling phase and the static phase, and the profile of the kink.
Since the contrast between the rolling and static grains is not very good, we must identify this boundary “manually.” We play the movie 5 frames back and then 5 frames forward and identify which grains are moving and which grains are static. We repeat these measurements every 0.05s, and record the coordinates of the bulk/fluid interface [41].
Figure 8a shows the profile of the kink as a function of plotted every 0.05 sec in a window of 2.82 cm by 2.26 cm (Experiment #5), and one sees the profile of the kink moving upward with constant velocity . Notice that the profile of the kink is stationary. Figure 8b shows the angle of the kink profile
| (17) |
where is the profile of the kink obtained from Fig. 8a, as a function of measured at different times. We fit the analytical solution of the shape of the kink (8), (10) obtained in [28] to the experimental profile of the kink and find good agreement (Fig. 8a). We find the best fit for values /sec, cm/sec, cm/sec, cm, , and .
(a)

(b)

The solution (8) and (10) is valid only for the lower and upper part of the kink, so the center of the kink, where small and large grains are mixed, cannot be reproduced. The values we use to fit the analytical solution are somehow different from the values we measure. However, we note that the exact shape of the kink depends on the type of interaction term used in the equation of motion to describe the rolling/static grains interaction. In particular, the interaction term used in [28] does not include nonlinear terms that might be important when the flux of grains becomes large (we comment on this point in Sec. VI). However, the fair agreement between experiment and theory indicates that some features of the interaction have been captured by this approach.
We also focus on the different collision processes between rolling grains in contact with the solid surface and the static grains. We find that amplification process (i.e. when a rolling grain removes a static grain via a collision) do not happen very often. The percolation effect forbids the larger grains to interact with the surface, thus prohibiting cross-amplification processes of the type of a larger rolling grain amplifying a smaller static grain. The main interaction seems to be the capture of rolling grains at the surface—when a rolling grain is converted to the static phase. However, we emphasize that it is difficult to clearly determine the nature of the interaction at the surface (capture versus amplification) because the smaller grains are the only interacting grains in the region of observation and they are difficult to track.
We measure the velocity of the kink as a function of (see Table I). Figure 9a shows the results which can be fit to a straight line. We find
| (18) |
where is typically 5 cm. The velocity of the kink is approximately the same as the mean velocity of the rolling grains (). Comparing with Eq. (12), we obtain a second estimate of the rate /sec.
Figure 9b shows the wavelength of the layers as a function of the thickness of the rolling phase for the six experiments of Table I. The data can be fit to a straight line, and we find
| (19) |
which agrees with the prediction of Eq. (14). Comparing with Eq. (14), we obtain . Using (16) and (18) we obtain , so that , corresponding to the fact that the fluid phase is less dense than the bulk.
VI Phenomenology
Table II shows the values of the phenomenological constants measured for the equal volume mixture of quasi-spherical glass beads of mean diameter mm and cubic-shaped sugar grains of typical size mm. The mean value of the velocity of the grains falling down the slope and the velocity of the kink range from cm/sec to cm/sec. As noted above, /sec and cm.
(a)
(b) 
According to Eq. (8), the lower part of the kink has the angle of the small-rounded grains , and near the layer of large grains there are logarithmic corrections. The angle of the kink decreases towards the center of the kink; it is equal to at the position where the larger grains start to be captured (Fig. 2c) Thus, measuring the minimum of the angle of the profile of the kink at the transition from the layer of smaller grains to the layer of larger grains provides a method to measure the value of the crossover angle of repose . Then, assuming that [28], the critical angle can be obtained too.
We measured for the angle of repose of the pure species
| (20) |
Figure 8b shows the angle of the pile near the kink at different times. From these curves we measure the angle of the layers
| (21) |
and the remaining angle of repose of larger grains on smaller grains
| (22) |
The constant represents the distance at which a rolling grain stops in a pile at an angle different from the angle of repose [34]—i.e., represents the distance at which a rolling grain is stopped at the kink. The constant cm is small compared to the system size cm—i.e., scales with the size of the grains and not with , as expected [34]. Notice also that cm—where —is the size of the region of mixing in the center of the pile observed in the case of segregation of the mixtures of smaller cubic grains and large rounded grains (Fig. 1b) [29]. This region of the mixture is observed to be small in comparison with the systems size.
Finally, we comment on the application of the theoretical calculation of the model developed in [28, 30, 29] to the problem of stratification when percolation effects are acting. The dependence of the repose angle on the composition of the surface proposed in [28, 30, 29] is analogous to the effect of percolation. Due to percolation, only the smaller grains interact with the surface, causing the larger ones to be convected further. The models of [28, 30] use the fact that the repose angle of the smaller grains is always larger than the repose angle of the larger grains for a given composition of the surface (i.e., , and ), then the smaller grains are always the first to be trapped, and the large ones are always convected down as it occurs due to the percolation effect. Moreover, capture of larger grains is forbidden on top of smaller grains since the capture function of the large grains is zero around the angle of repose of the small grains [29].
A simple extension to explicitly include percolation effects in the formalism of [28, 30] shows only small corrections to the profiles of the rolling and static grains, which provides evidence for the possible applicability of the results of [28, 30] to the case where percolation effects take place in the rolling phase. However, caution must be taken in the definition of the fluid/bulk interaction in the theoretical formalism. We take the interaction term to be proportional to the thickness of the rolling phase, an approximation valid for thin flows [7, 34]. Although this approximation might be still valid in the case of thick flows [30]— since the interaction might be proportional to the preassure exerted by the fluid phase [13], which in turn is proportional to for a fluid— nonlinear terms might be also necessary to completely describe the flow, especially because the interaction among the rolling grains (which is neglected in the theoretical formalism) becomes important.
The dependence of the velocity of the rolling grains on the position of the grain in the rolling phase is another fact not included in the theory, which considers a uniform velocity for all the grains in the rolling phase. For a comparison with the theory, we have replaced the velocity of the grains in the theory by the mean value of the velocity of the rolling grains measured experimentally.
VII Other Limits
We notice that the dependence on the plate separation , although present in Eqs. (1) and (2), has disappeared in Eq. (14), and the relevant length scale that determines the wavelength is . However, a change in the flux of adding grains, or a change in the gap , changes the wavelength since . Thus, e.g., by keeping the flux constant and increasing the gap , we find a decrease in , and we find that the wavelength decreases according to (14)
| (23) |
For the moderate fluxes used in this study (of the order of 1 gr/sec), the role of the flow rate is to determine the wavelength according to Eq. (14). For larger fluxes, Eq. (5) is still valid as long as the kink mechanism works. However, deviations from the linear dependence of Eq. (14) might occur since the velocity of the kink and the velocity profile of the rolling grains might deviate from the linear regime. The densities of the bulk and fluid phase might also change with the flux of grains, giving rise to nonlinear relation between and . For sufficiently large flow rates, the kink mechanism required to form layers cannot occur (especially the appearance of the first kink at the onset of the instability [29]), since the grains acquire large momentum, and avalanches that terminate by an upward moving kink before the next avalanche begins cannot occur. In this case, the kink is not able to stop the arriving rolling grains anymore; the grains ride over the kink so that no segregation at the kink is possible. Therefore, for this limit, the stratification pattern disappears when the flux is sufficiently large. Such effect was recently observed in [44] where the flux was increased by factor of 100.
Another deviation from Eq. (14) might occur at very low flow rate. Here the percolation effect disappears and the grains segregate due to size, because the larger grains do not find large enough holes in the surface so they roll easier than smaller grains. In this case, the rolling phase is thin, so that it behaves as a homogeneous phase with a constant velocity for all the grains in the fluid phase. In this case, from Eq. (5) we obtain
| (24) |
Thus when
| (25) |
where is a small constant of the order of the grain size. This lower limit might indicate the crossover from a percolation regime to a non-percolation regime at low flow rates.
VIII Discussion
In summary, we tested experimentally the main assumptions of the theory of surface flows of granular materials. We measured the profile of the static and rolling phases, in order to study the profile of the kink and the effects of percolation in the rolling phase and compared with analytical predictions. We characterized the dynamical process of stratification by measuring all the relevant quantities. We measured the velocity of the rolling grains, the velocity of the kink, the wavelength of the layers, and also the rate of collisions , and all four angles of repose characterizing the mixture. The velocity of the kink and the wavelength of the layers both vary linearly with the grain flux. The velocity profile of the grains in the rolling phase is a linear function of the position of the grains along the moving layer, which implies a linear relation between the mean velocity and the thickness of the rolling phase. We find the mean velocity of the rolling grains is the same as the velocity of the kink.
Our results apply to the moderate flow rates used in this work of the order of 1 gr/sec. For sufficiently larger or smaller flow rates, deviations might appear as discussed in the text. For larger fluxes, nonlinear terms may modify Eq. (14). For even larger fluxes the kink may not support the incoming grains turning stratification into the mixing of grains or to weak segregation. For smaller fluxes than the ones used in this study, the percolation effect does not take place. However, when the size ratio is large enough— — strong segregation occurs anyway at the shear surface between the fluid and solid phase: the large grains are not trapped in the holes of the surface, and they are convected further. Thus stratification is also observed for small fluxes, but the size segregation mechanism is different from the one studied here. The sharp segregation profiles with a separation zone of a few cm observed in the experiment shown in Fig. 1b is also a consequence of strong segregation effects. When , size segregation has a weak effect, resulting in a weak continuos segregation of the mixture no matter the shapes of the grains. Theoretically the case is treated in [45], and the case in [28, 29, 30].
Our results might be also applicable to other systems. Size and shape segregation in rotating drums may be analized in analogy to the regimes found here. Further experimental results may include qualitative studies of the other flows regimes mentioned above. It would be also appropriate to have an estimation of the angles of repose of the grains independently of the theoretical calculations used here. For instance, by gluing grains of one species to an inclined plane and pouring grains of the other species is a way to obtain a direct estimation of the cross angles of repose.
REFERENCES
- [1] R. A. Bagnold, The Physics of Blown Sand and Desert Dunes (Chapman and Hall, London 1941).
- [2] J. L. Borges, The Book of Sand (Emece, Buenos Aires, 1977).
- [3] J. M. Jaeger, and S. R. Nagel, Science 255, 1523 (1992).
- [4] H. J. Herrmann, in Disorder and Granular Media, edited by D. Bideaux and A. Hansen (North-Holland, Amsterdam, 1993), p. 305.
- [5] S. F. Edwards, in Granular Matter: An Interdisciplinary Approach, edited by A. Mehta (Springer-Verlag, New York, 1994), p. 121.
- [6] D. E. Wolf, in Computational Physics: Selected Methods – Simple Exercises – Serious Applications, edited by K. H. Hoffmann and M. Schreiber (Springer-Verlag, Heidelberg, 1996).
- [7] P.-G. de Gennes, in The Physics of Complex Systems [Proc. Int’l School of Physics “Enrico Fermi” Course CXXXIV], edited by F. Mallamace and H. E. Stanley (IOS Press, Amsterdam, 1997).
- [8] J. C. Williams, Powder Technol. 15, 245 (1976).
- [9] A. Rosato, K. J. Strandburg, F. Prinz, R. H. Swendsen, Phys. Rev. Lett. 58, 1038 (1987).
- [10] J. A. C. Gallas, H. J. Herrmann and S. Sokolowski, Phys. Rev. Lett. 69, 1371 (1992).
- [11] J. B. Knight, H. M. Jaeger and S. R. Nagel, Phys. Rev. Lett. 70, 3728 (1993).
- [12] W. Cooke, S. Warr, J. M. Huntley and R. C. Ball, Phys. Rev. E 53, 2812 (1996).
- [13] O. Zik, D. Levine, S. G. Lipson, S. Shtrikman, and J. Stavans, Phys. Rev. Lett. 73, 644 (1994).
- [14] K. M. Hill and J. Kakalios, Phys. Rev. E 49, R3610 (1994).
- [15] E. Clément, J. Rajchenbach, and J. Duran, Europhys. Lett. 30, 7 (1995).
- [16] F. Cantelaube and D. Bideau, Europhys. Lett. 30, 133 (1995).
- [17] R. L. Brown, J. Inst. Fuel 13, 15 (1939).
- [18] R. A. Bagnold, Proc. R. Soc. London A 225, 49 (1954).
- [19] J. C. Williams, Univ. Sheffield Fuel Soc. J. 14, 29 (1963).
- [20] J. A. Drahun and J. Bridgwater, Powder Technol. 36, 39 (1983).
- [21] J. A. Drahun and J. Bridgwater, Instn. Chem. Engrs. Symposium Series 65, S4/Q/1 (1981); Powder Technol. 36, 39 (1983).
- [22] M. E. Fayed and L. Otten (eds.), Handbook of Powder Science and Technology (Van Nostrand Reinhold, 1984), p. 428.
- [23] S. B. Savage, in Developments in Engineering Mechanics, edited by A. P. S. Selvadurai (Elsevier, Amsterdam, 1987), p. 347.
- [24] S. B. Savage and C. K. K. Lun, J. Fluid Mech. 189, 311 (1988).
- [25] S. B. Savage, in Theoretical and Applied Mechanics, edited by P. Germain, M. Piau and D. Caillerie (Elsevier, IUTAM, 1989), p. 241.
- [26] P. Meakin, Physica A 163, 733 (1990).
- [27] H. A. Makse, S. Havlin, P. R. King, and H. E. Stanley, Nature 386, 379 (1997).
- [28] H. A. Makse, P. Cizeau, and H. E. Stanley, Phys. Rev. Lett. 78, 3298 (1997).
- [29] H. A. Makse, Phys. Rev. E 56, 7008 (1997).
- [30] P. Cizeau, H. A. Makse, and H. E. Stanley (submitted to PRE).
- [31] H. A. Makse and H. J. Herrmann, Europhys. Lett. 43, 1-6 (1998).
- [32] J.-P. Bouchaud, M. E. Cates, J. R. Prakash, and S. F. Edwards, Phys. Rev. Lett. 74, 1982 (1995).
- [33] J.-P. Bouchaud, M. E. Cates, J. R. Prakash, and S. F. Edwards, J. Phys. I France 4, 1383 (1994).
- [34] P.-G de Gennes, C. R. Acad. Sci. (Paris) 321, 501 (1995).
- [35] T. Boutreux and P.-G. de Gennes, J. Phys. I France 6, 1295 (1996).
- [36] J. C. Williams, Powder Technol. 2, 13 (1968).
- [37] J. R. L. Allen, Sedimentary Structures: their Character and Physical Basis (Elsevier, Amsterdam, 1982).
- [38] Y. Grasselli and H. J. Herrmann (submitted).
- [39] For the segregation observed in Fig. 1b, we have [28, 30].
- [40] S. B. Savage, Adv. Appl. Mech. 24, 289 (1984).
- [41] Since we are considering the limit of high flux, the percolation effect takes place, so the interaction between rolling and static grains (at least in the center of the pile where we measure the profiles) is almost entirely between small grains. This fact makes difficult the identification of the boundary since small grains are difficult to track at the resolution of the video camera. Nevertheless we are able to identify the two phases.
- [42] J. Koeppe, M. Enz, and J. Kakalios, in Powders and Grains, edited by R. Behringer and J. Jenkins (Duke University Press, Raleigh, 1997), p. 443.
- [43] Y. Grasselli and H. J. Herrmann (submitted to J. Granular Matter).
- [44] J. Baxter, U. Tüzün, D. Heyes, I. Hayati, and P. Fredlund, Nature 391, 136 (1998). The experiments reported by Baxter et al. were done in a rather special situation. Instead of using a bimodal distribution of grains size differing also in shape as reported in [27], they used a continuos distribution of size of the grains and they colored half of them to distinguish from the other half. Under these circumstances the shape of both “species” should be the same and no stratification should occur, since there is no competition between size and shape segregation. However, due to this special way of preparing a “two species” system, some shape or surface-properties induced segregation might appear as well leading to an irregular stratification pattern. An increase in the flux then destroy the weak kink formed in such conditions.
- [45] T. Boutreux, H. A. Makse, and P.-G. de Gennes (submitted to Eur. Phys. J.-B).
ACKNOWLEDGEMENTS. We thank T. Boutreux, P. Cizeau, S. Havlin, H. Herrmann, P. R. King, and S. Tomassone for stimulating discussions. HAM and HES acknowledge support from BP and NSF.
| Experiment # | (cm) | (cm) | (cm/sec) | (cm/sec) |
|---|---|---|---|---|
| 1 | 0.31 | 0.63 | 6.7 | 7.1 |
| 2 | 0.38 | 0.64 | 8.5 | 8.7 |
| 3 | 0.48 | 0.90 | 13.0 | 11.0 |
| 4 | 0.64 | 1.13 | 13.2 | 14.7 |
| 5 | 0.65 | 1.16 | 14.8 | 14.9 |
| 6 | 0.72 | 1.25 | 17.8 | 16.6 |
| (1/sec) | (cm/sec) | (cm/sec) | (cm) | ||||
|---|---|---|---|---|---|---|---|
| 23 | 7-18 | 7-17 | 0.3-0.8 |