[
to appear in Phys. Rev. B
Current-voltage scaling of chiral and gauge glass models of two-dimensional superconductors.
Abstract
The scaling behavior of the current-voltage characteristics of chiral and gauge glass models of disordered superconductors, are studied numerically, in two dimensions. For both models , the linear resistance is nonzero at finite temperatures and the scaling analysis of the nonlinear resistivity is consistent with a phase transition at temperature characterized by a diverging correlation length and thermal critical exponent . The values of , however, are found to be different for the chiral and gauge glass models, suggesting different universality classes, in contrast to the result obtained recently in three dimensions.
pacs:
74.40.+k, 74.60.-w, 75.40.Mg]
Considerable attention has been paid recently to the nature of the glass phase and the universality class of the possible glass transitions in ceramic or granular high- superconductors. In the presence of an applied magnetic field, a vortex-glass phase transition with vanishing linear resistance in the low temperature phase has been predicted in three dimensions [1, 2] while, in two dimensions, the linear resistance is nonzero at finite temperatures but there is, nevertheless, a zero-temperature transition [3] with a divergent correlation length and critical exponent which determines the behavior of the current-voltage characteristics. The absence of a finite-temperature vortex-glass transition and current-voltage scaling has been verified in some two-dimensional superconducting films [4] with a critical exponent in agreement with theory. In the theoretical studies, a gauge glass model has been widely used which is believed to be in the same universality class as the vortex glass. In zero external field, however, only the standard superconducting transition takes place. In contrast, in d-wave superconductors materials containing ” ” junctions [5] a chiral-glass phase has been predicted even at zero external field in three dimensions based on numerical studies of the chiral glass model [6, 7], or alternatively, and XY spin glass [8]. The chiral-glass order parameter is the chirality, which represents the direction of local current loops introduced by frustration effects. As for the gauge glass, in two dimensions, the chiral-glass transition only occurs at zero temperature [6, 9, 10]. It is well known that the chiral glass model has an additional reflection symmetry which gives rise to quenched in vortices in the proposed chiral glass phase [8]. In spite of this, a recent study of the current-voltage characteristics of the chiral and gauge glass models in the vortex representation [11] found that they exhibit, within the numerical accuracy, the same critical exponents in three dimensions, suggesting a common universality class. This would imply that resistivity measurements alone are not able to distinguish between chiral and vortex glass states. However, in two dimensions the problem has not yet been analyzed in detail although several studies have already shown that the zero-temperature chiral glass transition is characterized by two different divergent correlation lengths [6, 9, 12], and , with different critical exponents, and , describing chiral glass (or vortex glass order) and phase glass order, respectively. In particular the value of for the chiral glass turns out to agree with the exponent for the gauge glass model [13]. The question then arises as to what correlation length is actually probed by nonlinear resistance measurements since this will determine the current-voltage scaling and the resulting behavior could be either consistent with , the same as the gauge glass model, or which could serve to identify the zero-temperature chiral glass transition.
In this work we present a numerical study of the current-voltage characteristics of chiral and gauge glass models, in two dimensions, in a representation in terms of the phases of the local superconducting order parameter. For both models, we find that the linear resistance is nonzero at finite temperatures and a scaling analysis of the nonlinear resistance is consistent with a phase transition at temperature characterized by a diverging correlation length and thermal critical exponent , in agreement with previous work. The values of , however, are found to be different for the chiral and gauge glass models, suggesting that measurements of nonlinear resistance probe mainly the phase correlation length and the models are in different universality classes, in contrast to the result obtained in three dimensions in the vortex representation [11]. Thus, in two dimensions, measurements of nonlinear resistance could, in principle, be used to identify a possible chiral glass in two-dimensional ceramic superconductors.
The chiral glass and gauge glass models can be described by the same Hamiltonian
| (1) |
where is the phase of the superconducting order parameter of a ”grain ”at site of a regular lattice, is a constant Josephson coupling and screening effects have been ignored . In the gauge-glass model [13, 11], represents a quenched line-integral of the vector potential which is taken to be uniformly distributed in the interval , representing the combined effect of disorder and the external magnetic field , while in the chiral-glass model [6] has a binary distribution, or , with equal probability, which may represent the phase shift across Josephson junctions in models of d-wave ceramic superconductors even the absence of magnetic field[14]. Alternatively, the chiral glass model is just another representation of the XY spin glass [8, 7, 9, 10] with random couplings .
To study the current-voltage characteristics of disordered superconductors described by the Hamiltonian of Eq. (1), we assume a resistively shunted Josephson-junction (RSJ) model for the current flow between grains [15] and use an overdamped Langevin dynamics [16] to simulate the nonequilibrium behavior. The Langevin equations can be written as
| (3) | |||||
where is the external current, represents Gaussian thermal fluctuations satisfying
| (4) | |||||
| (5) |
and a capacitance to the ground is allowed, in addition to the shunt resistance , in order to facilitate the numerical integration [16]. We use units where , , and set the parameter in the simulations, corresponding to the overdamped regime. The above equations were integrated numerically using, typically, a time step (), time averages computed with time steps and the results averaged over different realizations of the disorder. To determine the nonlinear resistivity (or resistance in two dimensions), , an external current is injected uniformly with density along one edge of a square lattice of size and extracted at the opposite one, with periodic boundary conditions in the transverse direction. The average voltage drop across the system is computed as
| (6) |
and the average electric field by . We have also computed the linear resistance, , without finite current effects, directly from the long-time equilibrium fluctuations of the phase difference across the system as
| (7) |
which can be obtained from Kubo formula of equilibrium voltage-voltage fluctuations, , using the Josephson relation . Lattices of sizes , and were used in the simulations with the main results obtained for the largest system size.
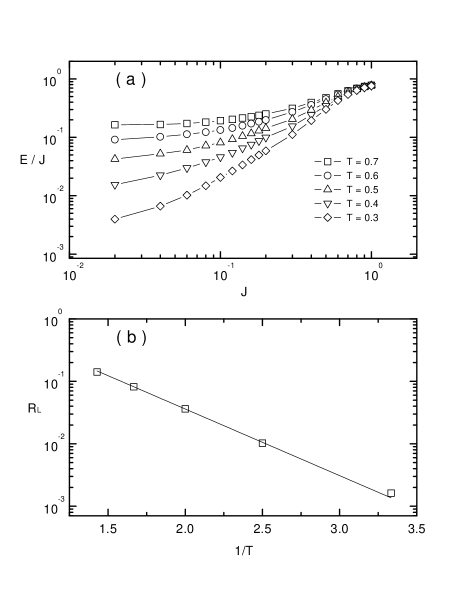
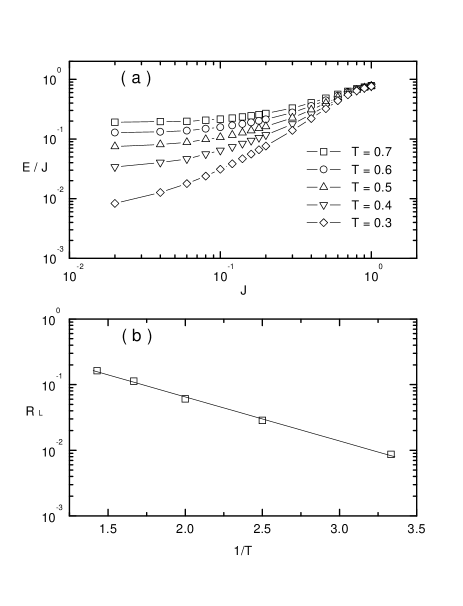
The nonlinear resistance as a function of current density and temperature for the gauge glass is shown in Fig. 1a and an Arrhenius plot of the linear resistance in Fig.1b. They are consistent with previous results obtained in smaller systems [3]. The corresponding results for the chiral glass are shown Figs. 2a and 2b . The data for both models show the expected behavior for a superconducting transition [2, 3]. In Figs. 1a and 2a, the ratio tends to a finite value for small , corresponding to the linear resistance which depends strongly on the temperature. This is confirmed in Figs. 1b and 2b where the linear resistance obtained at from Eq. (7) is consistent with an exponential decrease with temperature indicating a finite energy barrier for vortex motion. For increasing , there is a smooth crossover to nonlinear behavior that appears at smaller currents for decreasing temperatures. If one assumes a transition with a power-law divergent correlation length and since the external current density introduces and additional length scale the behavior of the nonlinear resistivity normalized to can be cast into the scaling form [2, 3]
| (8) |
where is a scaling function and which contains a single parameter, the critical thermal exponent . This scaling form implies that the characteristics current density at which nonlinear behavior is expected to set in decreases with temperature as a power law .
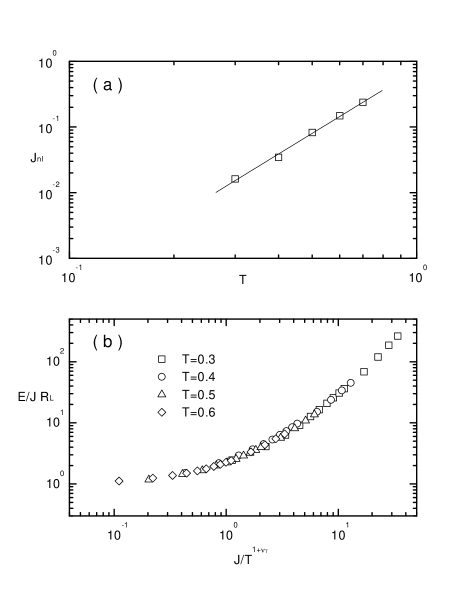
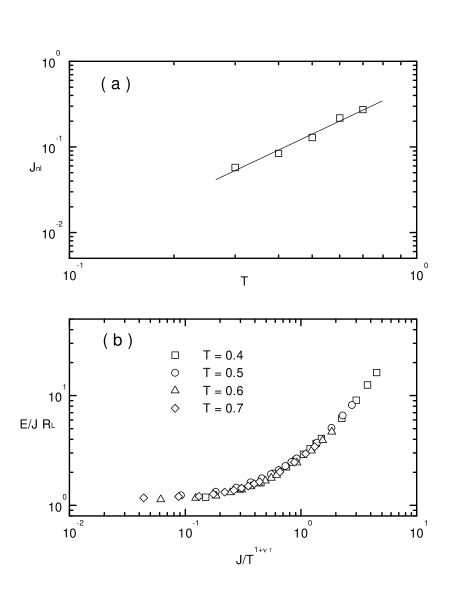
We now proceed to verify the scaling hypothesis and obtain a numerical estimate of the critical exponent for the gauge and chiral glass models. Fig. 3a shows the temperature dependence of for the gauge glass, defined as the value of where starts to deviate from a fixed value, chosen to be . The behavior is consistent with a power-law behavior and the slope of the loglog plot provides a direct estimate of . A scaling plot according to Eq. (8) for the gauge glass is shown Fig. 3b obtained by adjusting the parameter so that a best data collapse is obtained. The data collapse supports the scaling behavior of Eq. (8) and provides an independent estimate of . From the two independent estimates we finally get , a result consistent with a similar analysis of the nonlinear resistivity obtained from the coulomb-gas representation of the gauge glass model [3]. Following the same procedure for the chiral glass model, we obtain from the loglog plot in Fig. 4a and for the best data collapse in Fig. 4b, giving a final estimate .
The values of for the gauge glass and chiral glass models obtained from the above analysis are quite different from each other suggesting different universality classes for the transition. This is consistent with the additional reflection symmetry property of the chiral glass [8, 6], where changing leaves the Hamiltonian of Eq. (1) unchanged, whereas for the gauge glass there is only a continuous symmetry. In fact, other studies of the chiral glass [6, 9, 10] find that the transition is characterized by two different correlation lengths with different critical exponents, describing chiral glass order and describing phase glass (or alternatively, XY spin glass) order with the estimates and . Since the relevant length scale for phase slippage, which leads to voltage fluctuations, at finite temperatures is given by we expect that the nonlinear resistivity scaling can be described by Eq. (8) with which agrees with our numerical result for . A more complicated scaling analysis is also possible involving two correlation lengths but since at low temperatures, should dominate the resistive behavior and a scaling analysis with a single length scale is a reasonable approximation.
The distinct critical exponents found for the chiral and gauge glass models in two dimensions is in sharp contrast with the result obtained for the same models in three dimensions by Wengel and Young [11] where the critical exponents at the finite temperature transition agree within errors suggesting a common universality class. This implies that in three dimensions, resistivity measurement alone cannot distinguish between chiral and gauge glass states. However, our results suggest that, at least in two dimensions, measurements of nonlinear resistivity probe mainly the phase correlation length which has different critical exponents for the chiral and gauge glass and could, in principle, be used to identify, as has been done for the vortex glass [4], a possible chiral glass in two-dimensional ceramic superconductors.
This work was supported by FAPESP (Proc. 97/07250-8). Allocation of computer time at the Plasma Group (LAP/INPE) is gratefully acknowledged.
REFERENCES
- [1] M.P.A. Fisher, Phys. Rev. Lett. 62, 1415 (1989).
- [2] D.S. Fisher, M.P.A. Fisher, and D.A. Huse, Phys. Rev. B 43, 130 (1991).
- [3] R.A. Hyman, M. Wallin, M.P.A. Fisher, S.M. Girvin, and A.P. Young, Phys. Rev. B 51, 15304 (1995).
- [4] C. Dekker, P.J.M. Wöltgens, R.H. Koch, B.W. Hussey, and A. Gupta, Phys. Rev. Lett. 69, 2717 (1992).
- [5] M. Sigrist and T.M. Rice, Rev. Mod. Phys. 67, 503 (1995).
- [6] H. Kawamura, J. Phys. Soc. Jpn, 64, 711 (1995).
- [7] H. Kawamura and M.S. Li, Phys. Rev. Lett. 78, 1556 (1997).
- [8] J. Villain, J. Phys. C10, 4793 (1977).
- [9] P. Ray and M.A. Moore, Phys. Rev. B 45, 5361 (1992).
- [10] H.S. Bokil and A.P. Young, J. Phys. A 26, L89 (1996).
- [11] C. Wengel and A.P. Young, Phys. Rev. B 56, 5918 (1997).
- [12] Different correlation lengths have also been found in the vortex-glass phase of diluted Josephson-junction arrays (M. Benakli, E. Granato, S.R. Shenoy and M. Gabay, Phys. Rev. B 57, 10314 (1998) ). Here also, it should be interesting to know what is the relevant correlation length for nonlinear resistivity measurements.
- [13] M.P.A. Fisher, T.A. Tokuyasu, and A.P. Young, Phys. Rev. Lett. 66, 2931 (1991).
- [14] D. Doninguez, E.A. Jagla, and C.A. Balseiro, Phys. Rev. Lett. 72 , 2773 (1994).
- [15] S.R. Shenoy, J. Phys. C 18, 5163 (1985).
- [16] F. Falo, A.R. Bishop, and P.S. Londahl, Phys. Rev. B 41, 10983 (1990).