The optical response of Ba1-xKxBiO3: Evidence for an unusual coupling mechanism of superconductivity?
Abstract
We have analysed optical reflectivity data for Ba1-xKxBiO3 in the far–infrared region using Migdal–Eliashberg theory and found it inconsistent with standard electron–phonon coupling: Whereas the superconducting state data could be explained using moderate coupling, , the normal state properties indicate . We have found that such behaviour could be understood using a simple model consisting of weak standard electron–phonon coupling plus weak coupling to an unspecified high energy excitation near V. This model is found to be in general agreement with the reflectivity data, except for the predicted superconducting gap size. The additional high energy excitation suggests that the dominant coupling mechanism in Ba1-xKxBiO3 is not standard electron–phonon.
pacs:
74.20.-z, 74.25.Gz, 74.20.Mn, 74.72.YgThe high– oxide superconductor Ba1-xKxBiO3 (BKBO) has attracted much attention in recent years. Its relatively high ( K), cubic structure in the superconducting phase, and availability in thin film form has made it an attractive candidate for microwave and tunnel junction devices.
From a theoretical point of view BKBO is interesting because it shows features of both the classical superconductors and the cuprates. Its parent compound BaBiO3 has the perovskite structure. It is a charge–density–wave insulator, similar to the undoped cuprates which are antiferromagnetic insulators.[2] BKBO shares with the cuprates an asymmetric background in tunnelling conductance,[3] the overall behaviour of the reflectivity and energy loss function,[4] and a very high ratio of to the density of states at the Fermi level . The latter is an extremely unfavourable situation for phonon–mediated superconductivity. On the other hand, BKBO has no layered structure, its parent compound is diamagnetic,[5] and the charge carriers are electrons.[6, 7] It has a well–defined gap feature in the optical [8, 9] and tunnelling data [10, 11, 12] and shows a sizable isotope effect [13]. These latter properties suggest that BKBO is a classical electron–phonon s–wave superconductor.
Within this standard mechanism moderate to strong coupling, , is required to account for critical temperatures of K. The observations of the gap size yield values for between and , allowing weak to strong electron–phonon coupling. Marsiglio et al [[14]] have analysed the imaginary part of the optical conductivity of BKBO from Ref. [[9]]. They find that the electron–phonon coupling must be weak, , to explain the data. Recent density functional calculations for BKBO yield an average value .[15] This could imply that standard electron–phonon coupling is not the dominant coupling mechanism in BKBO.
In this paper we have studied the far–infrared (FIR) reflectivity data for Ba0.6K0.4BiO3 from Puchkov et al directly. Analysing the data in the framework of standard Migdal–Eliashberg (ME) theory,[16, 17] we tried to find the simplest model that explains the observed data. We found that the reflectivity in the superconducting state can be accounted for assuming moderate electron–phonon coupling, . However, in order to describe the normal state data, was required, in agreement with Marsiglio et al. A simple model that describes both normal and superconducting states, was found by introducing an additional coupling to a high energy excitation near V.
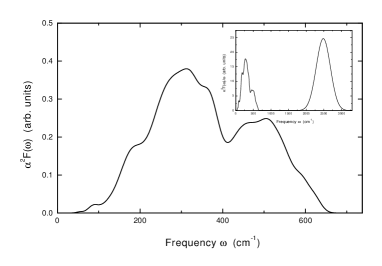
The standard framework for describing the optical response of high– superconductors is ME theory. Disregarding vertex corrections, expressions for the optical conductivity are well established in this strong coupling extension of BCS theory and can be found elsewhere.[18, 19, 20] They require the solution of the Eliashberg equations. Subsequently, the optical conductivity can be calculated in the local limit using the standard theory of the electromagnetic response function. This approach can describe the overall behaviour of the optical response of high– compounds in the normal state.[21] To explain their optical response above and below in detail temperature dependent mid–infrared (MIR) bands should be included, as we have recently shown for La2-xSrxCuO4 (LSCO).[22] The measured reflectivity from Ref. [[9]] shows notable temperature dependence only in the FIR region. A simple model can therefore consist of two components: a) a free carrier contribution treated within ME theory and b) a temperature independent MIR band. The latter was mainly included for completeness here since we tried to explain the observed temperature dependence in the FIR region. We modelled the MIR band by a simple Lorentzian dielectric function. To model the standard electron–phonon interaction we used an Eliashberg–function derived from tunnelling data [12], which is shown in Fig. 1. Similar results were obtained by several groups of investigators and there is good agreement with measured phonon density of states for BKBO.[23] Measurements of the Hall number [24] and the DC resistivity [25] suggest a free carriers plasma frequency cm-1 and an impurity scattering rate cm-1. The latter is close to cm-1 which is the value derived from a simple Drude fit of the optical data. Here we used cm-1 and treated the plasma frequency as a fit parameter. The electron–phonon coupling constant
| (1) |
should be adjusted to yield the correct value for the superconducting transition temperature K.
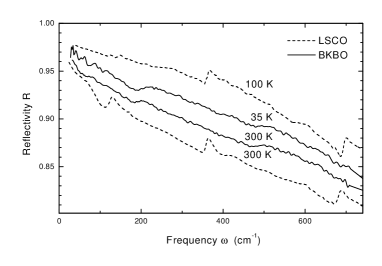
However, is directly linked to the temperature dependence of the FIR spectra: Strong temperature dependence of the FIR reflectivity indicates large and vice versa. It is important to note that this correlation is an intrinsic property of ME theory which is not affected by the choice of and . Figure 2 compares normal state reflectivity curves for BKBO [9] and LSCO [26] at different temperatures. Transition temperature, plasma frequency and impurity scattering rate are comparable in these materials. Although the overall behaviour of the reflectivity is qualitatively similar for these two compounds, there is a quantitative difference in their temperature dependence. The normal state optical response of LSCO could be accounted for using ,[22] but the temperature dependence of the BKBO data is far weaker, suggesting .
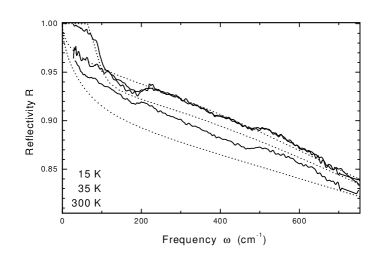
The superconducting state of BKBO, on the other hand, is well described using moderate electron–phonon coupling, . This value yields the correct for the Eliashberg function shown in Fig. 1, assuming that the Coulomb pseudo–potential vanishes, , and it is in good agreement with far–infrared (FIR) transmission measurements at low temperatures.[27] Figure 3 shows the calculated FIR reflectivity for these parameters, using a plasma frequency cm-1 and , and compares them to the measured curves. There is good agreement between model and experiment at K and K, but at room temperature the model underestimates the measured reflectivity.
Therefore, the temperature dependence of the normal state data suggest weak electron–phonon coupling, whereas a fit of the low–temperature data can be achieved assuming moderate coupling. A possible explanation for such behaviour could be a strongly temperature dependent coupling constant in the Eliashberg function . In an early Raman study on Ba0.6K0.4BiO3, McCarty et al [[28]] found a phonon peak at cm-1 which developed a distinctive Fano line shape upon cooling, which could support this picture. Different effective coupling strength above and below can arise if the electron–phonon interaction depends strongly on momentum. In this case the normal state can be described by , where the are Legendre components. In the superconducting state the gap function and renormalisation factor are determined by , whereas only enters into the expression for vertex corrections. In the simplest approach, neglecting vertex corrections, this notion results in different coupling constants above and below . However, we found that this model can only account for the experimental curves if one also allows for different plasma frequencies and different MIR bands above and below . Whereas the difference in could arise from neglecting vertex corrections below , it is difficult to see how this could effect the MIR band. We therefore rule out strong momentum dependence of the electron–phonon interaction as an explanation of the observed behaviour, at least in the simplest approximation. A full treatment, including vertex corrections, is beyond the scope of the present paper.
Another way to reconcile weak electron–phonon interaction with the observed would be the existence of an additional effective electron–electron interaction. For the cuprates such an approach was proposed very early on [29] but to date no conclusive evidence has been produced in its favour. If the energy of the additional coupling mode lies in the region of phonon frequencies it cannot be distinguished from standard phonon modes. It would have to be strongly coupled to the electrons to account for the observed and should be visible in tunnelling spectra. Thus, if an additional contribution exists it must be at energies well above the maximum phonon frequency cm-1. In the ME approach using only standard electron–phonon interactions such a high–energy mechanism would result in a negative Coulomb pseudo–potential. For BKBO we found that the normal state reflectivity and can indeed be reproduced assuming , , cm-1, and . These parameters are in good agreement with the results of Ref. [[14]]. Weak standard electron–phonon coupling is also in agreement with the observed isotope effect in BKBO. For weak to moderate coupling strength one can use the phenomenological equation [30]
| (2) |
which is based on McMillan’s approximate formula for . Loong et al report . Moderate coupling, , would then require , which yields a critical temperature of only K, whereas weak coupling, , suggests or a substantial negative Coulomb pseudo–potential, , indicating again the presence of a high–energy contribution. For and , Eq. (2) predicts , which is well within the error margins of Ref. [[13]].
We have studied a model consisting of two distinct contributions in the Eliashberg function : The standard phonon spectrum shown in Fig. 1 plus a high energy excitation centred at frequency , modelled by a Gaussian peak of width cm-1. The electron–phonon coupling was fixed to
| (3) |
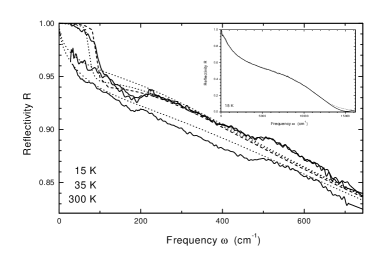
and for simplicity we chose . The respective coupling strengths of the standard phonon spectrum and the high energy contribution can be observed in the inset of Fig. 1 where is plotted for a typical case. To derive from the calculated optical conductivity in this model, we calculated the London penetration depth ,
| (4) |
and extrapolated for . We found that the normal state reflectivity is unaffected by the existence of the high energy mode as long as the total coupling is weak, . This puts a lower limit to , cm-1. Keeping fixed, we varied between cm-1 and cm-1. The superconducting state was little influenced by the position of the high energy peak. The calculated gap size was unchanged whereas the filling of the gap at decreased slightly with increasing . For cm-1 the gap size started to decrease. There is therefore some ambiguity in the position of the high energy excitation. For simplicity we tried to keep small. Figure 4 compares the calculated reflectivity for cm-1 to the experimental curves. The other parameters were , cm-1, and . There is fair agreement between model and experiment in the normal state whereas in the superconducting state the calculated gap size is somewhat too small. We found that for all the gap size is closer to the BCS limit, than to the measured value, . This discrepancy is consistent with the fact that the overall coupling in our approach was still weak, . Even including a high energy excitation in the model requires to reproduce the measured gap size. The superconducting gaps reported in the literature vary from to . A possible explanation for the large gap observed in the reflectivity could be found in the notorious inhomogeneity of BKBO in terms of potassium content and structural defects at a microscopic scale. i. e., the probed locally in the optical experiment could be somewhat higher than the bulk value. Also shown in Fig. 4 is the calculated reflectivity at K assuming stronger coupling, , which corresponds to K. Here, the observed gap size is accounted for. We note that due to the presence of the high energy contribution in only small changes in are required for notable changes in . Generally, we found that in the superconducting state this model behaves like a standard weak coupling electron–phonon superconductor, albeit with a high . The critical temperature agrees remarkably well with the prediction of the phenomenological McMillan formula,[30]
| (5) |
where
| (6) |
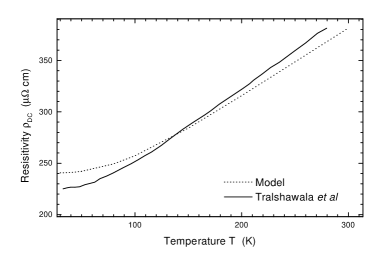
is a characteristic frequency in . The penetration depth follows the phenomenological behaviour, and for we found Å, in good agreement with literature values of Å.[31, 32] The calculated dielectric loss function was proportional to at low frequencies and had a (first) peak at V, in agreement with the results of Ref. [[4]]. In Fig 5 the calculated DC resistivity () is compared to the results from Ref. [[33]] for a BKBO sample with gap value mV. Both curves show the same overall behaviour, indicating that the model discussed here is in general agreement with independent measurements.
Thus, the optical reflectivity of BKBO measured in Ref. [[9]] cannot be explained by standard electron–phonon coupling ME theory but suggests that the dominant mechanism is coupling to a high energy mode. It would be very interesting to perform more FIR measurements on BKBO to confirm these findings and to analyse them in more detail. The nature of the high energy excitation in our model is so far unclear. A magnetic mechanism, widely favoured in the cuprates, must be ruled out for BKBO since there are no local moments on any of the ions involved. One possible candidate might be structural fluctuations: superconductivity occurs in BKBO just above the metal–insulator (MI) transition () which practically coincides with the orthorhombic (Ibmm) to cubic (Pm3̄m) phase transition. At low temperatures, structural fluctuations could prevail in the cubic phase and couple to the electrons. If these fluctuations involve large clusters of ions they could have very high excitation energies. This picture would explain why the maximum value of is observed right after the MI transition and subsequently decreases upon doping and it conforms with the discrepancy between the measured and calculated gap size.
In summary, we have studied the optical reflectivity of BKBO from Ref. [[9]] in the ME approach. We found that whereas the low–temperature data suggested moderate electron–phonon coupling, , the normal state data cannot be explained unless . To account for such behaviour, we used a model consisting of weak standard electron–phonon coupling plus weak coupling to a high energy excitation near V. We found that this model behaves like a standard weak coupling electron–phonon superconductor, albeit with unusually high critical temperature. In contrast to the measured reflectivity, the predicted superconducting gap size is BCS–like. The model is in general agreement with independent measurements of the isotope effect, penetration depth, dielectric loss function, and DC resistivity in BKBO.
The authors would like to thank A. V. Puchkov for kindly providing his reflectivity data. They are also grateful to S. Shulga for providing his program for these calculations.
REFERENCES
- [1] current address: Eberhardt-Karls Universität Tübingen, Institut für Theoretische Physik, Auf der Morgenstelle 14, D-72076 Tübingen, Germany
- [2] S. Pei, J. D. Jorgensen, B. Dabrowski, D. G. Hinks, D. R. Richards, A. W. Mitchell, Phys. Rev. B 41, 4126 (1990)
- [3] F. Shafiri, A. N. Pargellis, R. C. Dynes, Phys. Rev. Lett. 67, 509 (1991)
- [4] I. Bozovic, J. H. Kim, J. J. Harris Jr. E. S. Hellman, E. H. Hartford, P. K. Chan, Phys. Rev. B 46, 1182 (1992)
- [5] R. J. Cavas, B. Batlogg, Mater. Sci. Res. Bull. 14(1), 49 (1989)
- [6] H. Sato, S. Tajima, H. Takagi, S. Uchida, Nature 338, 241 (1989)
- [7] M. Affronte, J. Marcus, C. Escribe–Filippini, Solid State Commun. 85, 501 (1993)
- [8] Z. Schlesinger, R. T. Collins, J. A. Calise, D. G. Hinks, A. W. Mitchell, Y. Zheng, B. Dabrowski, N. E. Bickers, D. J. Scalapino, Phys. Rev. B 40, 6862 (1989)
- [9] A. V. Puchkov, T. Timusk, W. D. Mosley, R. N. Shelton, Phys. Rev. B 50, 4144 (1994)
- [10] F. Shafiri, A. N. Pargellis, R. C. Dynes, B. Miller, E. S. Hellman, J. Rosamilia, E. H. Hartford, Jr. , Phys. Rev. B 44, 12521 (1991)
- [11] H. Sato, H. Takagi, S. Uchida, Physica C 169, 391 (1990)
- [12] P. Samuely, N. L. Boborov, A. G. N. Jansen, P. Wyder, S. N. Barilo, S. V. Shiryaev, Phys. Rev. B 48, 13904 (1993)
- [13] C. K. Loong, D. G. Hinks, P. Vashishta, W. Jin, R. K. Kalia, M. H. Degani, D. L. Price, J. D. Jorgensen, B. Dabrowski, A. W. Mitchell, D. R. Richards, Y. Zheng, Phys. Rev. Lett. 66, 3217 (1991)
- [14] F. Marsiglio, J. P. Carbotte, A. Puchkov, T. Timusk, phys. Rev. B 53, 9433 (1996)
- [15] V. Meregalli, S. Savrasov, preprint
- [16] A. B. Migdal, Zh. Eksp. Teor. Fiz. 34, 1438 (1958); Sov. Phys. — JETP 34 996 (1958)
- [17] G. M. Eliashberg, Zh. Eksp. Teor. Fiz. 38, 966 (1960); Sov. Phys. — JETP 11, 696 (1960)
- [18] S. B. Nam, Phys. Rev. 156, 470 and 487 (1967)
- [19] W. Lee, D. Rainer, and W. Zimmermann, Physica C 159, 535 (1989)
- [20] O. V. Dolgov, A. A. Golubov, and S. V. Shulga, Phys. Lett. A 147, 317 (1990)
- [21] H. J. Kaufmann, E. G. Maksimov, E. K. H. Salje, preprint
- [22] O. V. Dolgov, H. J. Kaufmann, E. K. H. Salje, and Y. Yagil Physica C 279, 113 (1997)
- [23] Q. Huang, J. F. Zasadzinski, N. Tralshawala, K. E. Gray, D. G. Hinks, J. L. Peng, R. L. Greene, Nature, 347, 369 (1990)
- [24] S. F. Lee, J. Y. T. Wei, H. Y. Tang, T. R. Chien, M. K. Wu, W. Y. Guan, Physica C 209, 141 (1993)
- [25] E. S. Hellman, E. H. Hartford, Phys. Rev. B 47, 11346 (1993)
- [26] F. Gao, D. B. Romero, and D. B. Tanner, Phys. Rev. B 47, 1036 (1993)
- [27] F. J. Dunmore, H. D. Drew, E. J. Nicol, E. S. Hellman, E. H. Hartford, Phys. Rev. B 50, 643 (1994)
- [28] K. F. McCarty, H. B. Radousky, D. G. Hinks, Y. Zheng, A. W. Mitchell, T. J. Folkerts, R. N. Shelton, Phys. Rev. B 40, 2662 (1989)
- [29] F. Marsiglio, R. Akis, J. P. Carbotte, Solid State Commun. 64, 905 (1987)
- [30] J. P. Carbotte, Rev. Mod. Phys. 62, 1027 (1990)
- [31] B. A. Baumert, Journal of Superconductivity 8, 175 (1995)
- [32] M. S. Pambianchi, S. M. Anlage, E. S. Hellman, E. H. Hartford, Jr., M. Bruns, S. Y. Lee, Appl. Phys. Lett. 64, 244 (1994)
- [33] N. Tralshawala, J. F. Zasadzinski, L. Coffey, W. Gai, M. Romalis, Q. Huang, R. Vaglio, K. E. Gray, Phys. Rev. B 51, 3812 (1995)