Transport, optical and electronic properties of the half metal CrO2
Abstract
The electronic structure of CrO2 is critically discussed in terms of the relation of existing experimental data and well converged LSDA and GGA calculations of the electronic structure and transport properties of this half metal magnet, with a particular emphasis on optical properties. We find only moderate manifestations of many body effects. Renormalization of the density of states is not large and is in the typical for transition metals range. We find substantial deviations from Drude behavior in the far-infrared optical conductivity. These appear because of the unusually low energy of interband optical transitions. The calculated mass renormalization is found to be rather sensitive to the exchange-correlation functional used and varies from 10% (LSDA) to 90% (GGA), using the latest specific heat data. We also find that dressing of the electrons by spin fluctuations, because of their high energy, renormalizes the interband optical transition at as high as 4 eV by about 20%. Although we find no clear indications of strong correlations of the Hubbard type, strong electron-magnon scattering related to the half metallic band structure is present and this leads to a nontrivial temperature dependence of the resistivity and some renormalization of the electron spectra.
CrO2 has been attracting substantial theoretical[1, 2, 3, 4, 5, 6, 7] and experimental[8, 9, 10, 11] interest in recent years, in part because of its practical importance in magnetic recording, and in part due to fundamental interest in its half-metallic electronic structure and the implications of this. In half metals, one spin channel is metallic and the other is semiconducting. This results in unusual transport properties, including anomalously large, but still metallic, resistivities at high temperature[10], coupled with high mobilities at low temperature. Another consequence of the half metal behavior is nontrivial magnetoresistance due to spin-dependent tunneling[12, 13], with various potential applications.
Despite a large number of published band structure calculations, no full potential, all-electron calculations have been reported for CrO2 except for calculations of Sorantin and Schwarz[14], done in a study in chemical bonding of the rutile structure oxides. The calculations of Refs. [1, 2, 3, 5, 7] used atomic sphere approximations for the crystal potential, while those of Ref. [4] used a muffin-tin approximation. Note that nonspherical part of the potential is of particular significance for a material with low site symmetries like rutile CrO2. The only nonspherical calculations reported so far are those of Lewis et al [6], however the accuracy of these calculations was limited by the use of a pseudopotential based method.
As was observed early on[2], the exchange splitting is very sensitive to computational details, hence the necessity of well-converged, all-electron, and full-potential, state-of-the-art band structure calculations to establish the predictions of the LSDA which may then be compared with experiment to clarify the possible role of many body effects beyond the mean field. Currently even such a basic quantity as density of states at the Fermi level, , varies among different calculations from 0.69 states/Ry f.u. (Ref. [6]) to 2.34 states/f.u.(Ref. [2]). Given that the reported experimental low temperature specific heat coefficients range from 2.5 mJ/K2(Ref.[9]) to 7 mJ/K2 (Ref.[15]), such a situation creates confusion about the physical nature of this compound, including speculations that strong correlations may lead to unusual renormalizations in CrO2.
As mentioned, here we report well converged full-potential all-electron band structure calculations along with an analysis of the latest experimental data. Our conclusion is that the existing experimental data are reconcilable with the calculated LSDA electronic structure without additional strong correlation effects, but that strong electron-magnon scattering (as expected in half metals) is presents and renormalizes the electron bands. With such renormalization the LSDA electronic structure suffice to understand reasonably well the body of experimental results.
The calculations were performed using the general potential linearized augmented plane wave method (LAPW), which is described in detail elsewhere[16, 17]. Local orbital extensions were used to relax linearization errors and to treat semicore states. Well converged basis sets of over 600 functions for the six atom unit cell were used. The radii of the muffin-tin spheres were 2 a.u. for Cr and 1.55 a.u. for O. The Hedin-Lundquist exchange-correlation potential was used for most calculations (but see below). The Brillouin zone averages during the iterations to self consistency were performed with 105 inequivalent k-points, while the zone integrals for calculating transport and related properties utilized the tetrahedron method with at least 770 inequivalent k-points. Convergence was carefully checked.
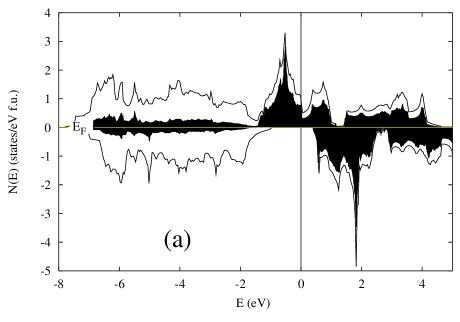
The resulting band structure and electronic density of states (DOS) are shown in Fig.1 and 2. The DOS agrees well with that reported by Sorantin and Schwarz[14]. First of all, let us note that the LSDA bandwidth is of the order of 10 eV. This is to be compared with the Hubbard repulsion eV from constrained LSDA calculations[7]. The ratio of is much smaller than in strongly correlated oxides of Ni, Fe or Cu. One can expect at best a moderate effect of electron-electron correlations beyond the mean-field LSDA result[18].
In this connection, it is instructive to look at the recent LSDA+U calculations of Korotin et al[7]. They compared their results with an earlier LSDA band structure[1], and found some differences, mostly amounting to an upward shift of the unoccupied -states by eV. However the reported LSDA calculations deviate among themselves by a comparable amount, and it worth trying to sort out the differences genuinely related with the Hubbard from those related to the computational details.
The results of Korotin et al [7] mainly differ from those of Schwarz[1] in the position of the unoccupied spin-down Cr- band. Compared to the present LSDA results (Figs. 1,2) this band is pushed up by about 1.4 eV (more than twice less than , due to the Cr-O hybridization[19]). Thus the Fermi level appears to be somewhat lower than in the middle of the gap, while in the LAPW calculations reported here, as well as in Ref.[1], it is closer to the top of the gap. The question is to what extent this difference reflects real physics, that is, renormalization of the bands due to electron-electron correlations beyond LSDA, and to what extent it reflects the difference in the computational technique and associated approximations. If the latter dominates, full potential calculations are preferred over Atomic Sphere Approximation (ASA) calculations as in Ref. [7]. On the other hand, if the correlations beyond the LSDA are very strong, the LDA+U calculations may be superior regardless of the spherical approximation. It is worth noting that although the statement of Korotin et al[7], that LSDA+U “is superior to LSDA since it can indeed yield a gap if the local Coulomb interaction is large enough”, is often true, it is not so clear when the local interaction is small compared to the band width, and the material is actually a metal. In fact, when as in CrO2, one expects the crude way in which LSDA+U includes correlations to be not better (if not worse) than the LSDA which includes them roughly in a mean-field manner (and in any case the ASA then is a serious issue).
Recent photoemission investigations of Tsujioka et al[9] found large splittings of 5 eV between the main peaks in the occupied and empty Cr- densities of states. The authors compared that number with the corresponding splitting in Ref. [1] ( eV) and in Ref. [7] ( eV), and interpreted that as an indication of strong, important Coulomb correlations. However, this large difference is not entirely due to the Coulomb correlations. An immediate observation that can be made from comparison of the results of Korotin it et al[7] and Schwarz[1] is that the Ref. [7] has not only the unoccupied -band shifted up, but also the weight inside the band redistributed. The latter effect can hardly result from the Coulomb effect, because it is present also in our LAPW LSDA density of states (Fig. 2; note that splitting here is about 2.5 eV).
In order to understand the remaining difference, and also to explore the sensitivity of the exchange splitting to the technical details, we performed a series of LMTO-ASA calculations, using first the automatic maximum space filling atomic sphere radii, calculated from the Hartree potential distribution by the Stuttgart LMTO ASA package[20]. Our experience of working with this package is that this choice nearly always provides much better space filling and much smoother crystal potentials than simple heuristics. In the case of CrO2 this yielded and a.u. Unlike the setup used in Ref. [7] and other ASA calculations[1, 2, 21], there were 4 empty spheres of the 1st kind and 2 empty spheres of the 2nd kind per CrO The setup in Ref.[7] generated too large sphere overlaps, which according to the modern understanding of the LMTO[20, 22] are above the maximum limit recommended for a second generation LMTO. However we ran the program with that setup as well for the purpose of comparison. The results are shown in Table I. We find that this setup consistently overestimates the exchange splitting by 0.2 eV. Another 1 eV then comes from , which may be considered as an estimate of correlation effects beyond the LSDA in this system. It is worth noting that the Generalized Gradient Approximation, discussed in more detail later in paper, takes correlations into account in a more sophisticated, but still mean-field manner, and leads to an exchange splitting about 0.3 eV larger than in LSDA, closer to LSDA+U. The gap in the spin-down channel, however, is the same in the GGA as in the LSDA, unlike LSDA+U.
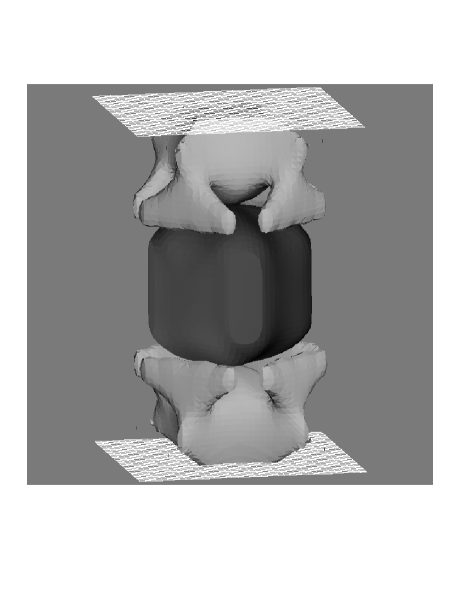
Let us now look at the electronic structure of the spin-up subband at the Fermi level. Fig. 3 shows the calculated Fermi surface. The three bands form a number of pockets; the main motif is a chain of alternating hole and electron pockets extending along direction. The electron pocket (“pseudocube”) is centered around and it touches a hole pocket at the point k These hole pockets extend all the way up to the Z point where they touch the same pocket in the next Brillouin zone. There are 0.12 electrons per formula unit, and the compensating amount of holes. Interestingly, while the -pocket is quasi-isotropic, this hole pocket looks more like a pseudosphere with “tentacles” directed towards the center of the XMXZRAR prism[23], that is towards the point ( The tentacle has a complex shape and extends from the above mentioned point along (11̄0) direction hugging the pseudocube. The whole pocket resembles a hammerhead shark with one belly, four heads, and no tails. The main contribution to the DOS comes from the “heads”. Two additional small concentric electron pockets occur between A and M. These two Fermi surfaces are degenerate on the XMAR face of the Brillouin zone. The reason for that is the existence of a twofold screw axis in the rutile structure; as was shown by Herring[24], due to the time reversal symmetry, this leads to degeneracy of electronic bands on the plane perpendicular to the screw axis. This degeneracy, generally speaking, is lifted linearly in , and the momentum matrix elements between the bands are finite. This leads, in principle, to a finite static interband conductivity[25], . Since the length of the line where these two pockets touch is small, this contribution is small, but still calls for additional caution when analyzing experimental infrared conductivity in terms of a Drude model.
The calculated DOS, as shown on Fig.2, has a minimum (“pseudogap”), but the Fermi level is not exactly at the minimum; the calculated states/eV cell corresponds to a linear specific heat coefficient mJ/K2 mole. This value is sensitive to the zone sampling and care was taken to ensure its convergence. Tsujioka et al[9] have measured specific heat at low temperature and fitted their data to the following expression: the last term being a magnon contribution. It is worth noting that this curve, due to the square root term, meets the origin with infinite slope, and already at K, for the parameters given in Ref. [9], mJ/K This at least in part may explain the disagreement between various authors about this value. The calculated is in close agreement with the experiment, which is surprising (one expects substantial renormalization from electron-magnon interactions), but less surprising than the anomalous renormalization calculated by Lewis et al[6]. The number given by Tsujioka et al[9] may be an underestimate, given the sharp change of near We, however, think that this number is more realistic than the 2–3 times larger values quoted in Refs. [15, 26]. On the other hand, the above mentioned minimum in occurs at only 30 meV above the Fermi level. The strong variation in this region and high sensitivity of the exchange splitting to the computational parameters together lead to an extraordinary sensitivity of the calculated to the exchange-correlation potential (particularly, to gradient correction). In fact, in GGA calculations the Fermi level falls exactly at the minimum and the calculated DOS is only 0.95 states/eV cell, half of the LSDA value. Depending on the exchange-correlation functional used, the calculated bare electron specific heat coefficient can be anything from 1.1 to 2.3 mJ/K2 mole, and correspondingly the needed mass renormalization anything from 2.5 to 1.1 .
The pseudogap in the DOS also leads to a minimum in the plasma frequency as a function of the Fermi energy position. At the actual position of the Fermi level, the plasma frequency is calculated to be 2.1 eV[27]. This is smaller than the value (3.35 eV) derived by Basov et al[11] by integrating the measured optical conductivity up to 12 000 cm-1 (1.49 eV). The reason is that, as mentioned above, there are interband transitions with vanishing energy in this system, and a large part of the spectral weight integrated up to 1.5 eV comes from these interband transitions. Note that (Fig.2) the plasma frequency is much less sensitive to the position of the Fermi level than the DOS — changes in the value of are compensated by the opposite changes in the Fermi velocity. In the above mentioned GGA calculations, despite a drastic change in , was only 5 and 7% smaller for the and components, respectively, than in LSDA.
Combined with the small residual resistivity (20 cm in static measurements[10] and 10 cm or less when extrapolating the optical conductivity to zero[11]), the calculated calls for an unusually long relaxation time at low temperature: to 100 cm-1 (the first number is based on DC resistivity and the second on the optical data). Basov et al[11] fitted their low-frequency data ( cm by a Drude formula with eV and cm So the LSDA calculations again fall within the range of the the different experiments.
Another characteristic that can be extracted from the calculations is the average Fermi velocity. Note that one cannot reliably extract this number from the optical experiments, since the required effective mass is unknown. Although the ratio of squared plasma frequency and the DOS, formally speaking, gives the average squared Fermi velocity, this procedure becomes misleading when the effective mass is rapidly changing over the Fermi surface: it overweights heavy-mass parts of the FS and reduces the calculated while the actual transport is dominated by the lighter carriers with higher velocity. However, even for the lightest band at the Fermi level the calculations give 108 cm/s. The estimation of Ref.[11] (0.6-0.9108 cm/s) is substantially higher; we ascribe this partially to the neglect of the effect of interband transitions and the deviation of the carrier mass from the free electron mass (and indeed 108 cm/s is an unusually large number for a -band metal). Correspondingly, their estimate for the mean free path at K should be reduced from 1500 to 300 Å, which is not extraordinary large. The former number is hard to explain by freezing out of spin-flip impurity scattering (due to the half-metallic character of CrO2), as it is hard to imagine that all charge defects are absent and the only possible scattering channels are associated with the spin flip.
On the contrary, the temperature dependence of the resistivity indicates a significant role played by spin scattering at finite temperature. As shown in Ref. [10], the resistivity below the room temperature can be fitted by a quadratic dependence, or slightly better with a power law with an exponent Various models for the scattering by spin fluctuations give exponents between 2 and 3.5, but in any event much larger that one. Interestingly, for CrO2 looks very similar to that of other so-called “bad metals”. A typical example is SrRuO3, with closely reminding in CrO2, including the change of the slope at the Curie temperature[28]. Interestingly, in Ref. [28] the observed resistivity was argued to be not related to magnon scattering because the prefactor of seemed too large ( cm/K compared to the corresponding term for elemental ferromagnets ( cm/K As we discussed elsewhere[29], the origin is coupling of magnetism and covalent bonding via O Stoner factor. The physics of CrO2, despite its being also a bad metal, is very different. What these two materials (and probably other bad metals as well) have in common is that in both metals changing magnetic order has strong qualitative effects on the band structure, and because of that electrons are scattered anomalously strongly by spin fluctuations (in this case electron-magnon interaction is due to what can be called “magneto-covalent” coupling). Note that the prefactor in CrO2 is of the same order as in SrRuO3 (about three times smaller).
Optical spectra of CrO2 reveal a number of interesting features[11]. Two features observed in the high-energy part of the spectrum are a peak at eV, easily identifiable with transitions across the spin-minority gap, first pointed out by Uspenski et al.[21], and a weaker peak (essentially, a shoulder) at eV. This latter feature coincides both in position and relative strength with a peak calculated in Ref.[21] in the polarization E coming from the spin-majority band (this feature is weaker in the other polarization[30]). The third observed feature is a broad maximum between 500 and 10000 cm-1 (0.06 to 1.2 eV), interpreted in Ref.[11] as intraband conductivity shaped in a non-Drude way by a frequency-dependent relaxation time. However, a closer examination of the results of Uspenski et al.[21] reveal an interband feature starting at about 0.1 eV and continuing to 0.9-1 eV, at least in the E polarization. The relative strength of these three features in the calculations may be questioned, particularly the excessive weight in the lowest one. We should keep in mind that a substantially greater error is expected in the calculation of the matrix elements within LMTO-ASA technique, than in the calculations of the band structure itself[31]. Besides, there is the substantial polarization dependence revealed by the calculations. This introduces additional uncertainty in the Kramers-Kronig procedure[32].
Uspenski et al.[21] did not discuss the low frequency ( cm region in detail. However, following the work of Basov et al[11], one may look at this region more closely. This requires knowledge of the band structure near the Fermi level with a better accuracy than that provided by the LMTO-ASA method. Besides, LMTO-ASA introduces uncontrollable errors into optical matrix elements, hence the need for full potential optical calculations. We have performed such calculations using the Wien LAPW code with the optical extension, described elsewhere[33]. The band structure calculated with this code differs from the one calculated using the LAPW code[17] used in the transport calculations by less than 1 mRy.
As mentioned, CrO2 is special in the sense that it has non-zero interband conductivity at To demonstrate this, we show in Fig.4 the calculated joint density of states (JDOS), defined as
| (1) |
which is proportional to the optical conductivity due to the interband transitions in the constant matrix element approximation:
| (2) |
Here is the volume of the unit cell, and is the dipole matrix element for given polarization. As one can see from Fig.4, there is indeed a linear in component. A closer look uncovers that there is also a quadratic in component in JDOS. This comes from the transitions around the point (0,0,0.4 where two bands touch (the “pseudocube” and the belly of the “shark”). Even more interesting is the steep increase of the JDOS above 700 cm This is the threshold for the transitions from the “hammers” into the “pseudocube”. The weak dispersion in one direction of the band forming the “hammers” provides a large phase space for this transition.
The calculated optical conductivity including matrix elements is shown in Fig.5. In the following discussion we shall concentrate at the low energy ( eV) region, studied in Ref.[11]. This region is blown up on Fig.6, where we also show the experimental data from Fig. 2 of the Ref.[11]. We have added a Drude part corresponding to the ( cm)-1 and the calculated plasma frequency of 2.1 eV. First of all, we observe that all essential features visible in the experiment are reproduced: a narrow intraband peak with no deviation from Drude shape, interband transitions within the manifold, starting from and extending up to 1.5 eV (1.3 in the experiment), followed by a wide absorption band between 2 and 4.8 eV (between 1.7 and 4.5 in the experiment), which is associated with transitions between the bonding and antibonding bands. The manifold includes some dispersionless bands (which are understood in the tight binding model described in Ref.[7]). These in turn result in an absorption peak near 2.5 eV. It is tempting to associate this peak with a shoulder at 2 eV, found in the experiment, although by doing so we risk indulging in overinterpretation. Nonetheless, in this case the broad hump in the experimental curve, centered at 3 eV, may be associated with the feature in the calculated at 3.5-4 eV. It is notable that the experimental features systematically occur at frequencies 10-20% lower than the corresponding calculated ones. This must be due to many body renormalization effects. Contrary to the assumption of Refs.[7] and [9], these renormalizations seem to be related with the exchange of virtual magnons rather than with the Hubbard repulsion, as this would force apart occupied and unoccupied states and would shift optical transitions to higher energies. (cf. Eliashberg renormalization due to electron-phonon interaction; however, because of the high frequency of the spin excitations, this effect is seen even far away from the Fermi level). Again, one should exercise caution here, because the crystalline anisotropy, barely noticeable in the intraband conductivity, increases with frequencies (as one can see from Fig.6). First of all, we do not know with which weights the two polarizations appear in the experimental curve. Second of all, even if we knew that, and would have averaged the two curves in Fig.6, this procedure would not have produced the same results as averaging two reflectivities and restoring the conductivity from the average reflectivity (which would correspond to the experimental procedure). To illustrate that, we compare the average calculated reflectivity (assuming 1:1 weighting of and , that is, an orientation preferential for polarization) with the reflectivity calculated from the average dielectric function (Fig. 7). While in general the curves are similar, the latter overemphasizes the feature at 1.3 eV, right below the screened plasma edge at 1.6 eV. Indeed, we observe from Fig.6 that the structure in the experimental curve in this energy region is substantially weaker than in the calculated one.
The last note regarding comparison with the experiments regards the low-temperature conductivity displayed in Fig. 4 of the Ref.[11]. As we have noted before, the Fermiology of CrO2 is unusually sensitive to the approximations used for the exchange-correlation functional. In particularly, the above mentioned smaller density of states in GGA is due to the fact that the hammerheads of the hole pockets entirely disappear when the Fermi level is raised by 30 meV. So, one should take the calculation in the far infrared ( cm meV) region with a grain of salt. With this in mind, the agreement between the frequency of the threshold (700 cm seen in Fig.4 and the frequency cm where the experimentally determined low temperature optical conductivity starts to deviate from the Drude law, is very reasonable. Note that the original interpretation of Basov et al was in terms of intraband transitions and a strongly frequency-dependent relaxation time. They assumed a threshold in the relaxation time around 500 cm-1 and ascribed this threshold to the minimum energy for spin-flip scattering. If the main scattering mechanism is by magnetic impurities, then indeed it is easy to show that in the constant scattering amplitude approximation the relaxation time depends on frequency as
| (3) |
and obviously is zero below the spin-flip transition threshold. However this interpretation relies on a threshold of 500, or at most 1000 cm while our LSDA calculations give at least 0.25 eV, that is 2000 cm This number is defined by the exchange splitting and the many body correlation effects neglected in the LSDA are likely to increase it even further (cf. Ref.[7]). Interpretation in terms of interband transitions fits the experimental picture much better.
The level of agreement between the observed low-frequency plasma energy, 1.7 eV, and the calculated value of 2.1 eV is satisfactory. It is tempting to ascribe overestimation of the plasma frequency to many body effects (cf. high- cuprates where the LSDA underestimates by a factor of two). However, one should be very cautious about such an analogy, because renormalization in cuprates affects the quasiparticle velocity but not the area of the Fermi surface, so that the DOS ( is underestimated by about as much as ( is overestimated. Here, however, both and seem to be overestimated, suggesting that it is the total area of the Fermi surface that is overestimated. Unlike the high cuprates, the Luttinger theorem does not fix the size of the Fermi surface because both electron and hole sections are present in CrO2. The most natural explanation of the overestimated plasma frequency in the LSDA is thus not a failure of the one-electron picture, but inaccuracy of the density functional approximation used in the calculations. The fact that GGA calculations yield smaller (substantially) and (somewhat) illustrates this point. We should emphasize that we do not claim the GGA is necessarily a better approximation than LSDA for CrO2; it does give larger separation between the occupied and unoccupied states, both in the spin-flip and in the same spin channels, thus being closer to LDA+U than LDA is. We are, however, sceptical about superiority of LDA+U in case of CrO2, and indeed the optical data suggest that the LSDA bands should be corrected in the direction opposite to LDA+U or GGA, that is, the band widths should be smaller, as well as the separation between occupied and unoccupied bands.
Finally, an interesting question arises about the evolution of the optical and transport properties above the Curie temperature. One may expect that at sufficiently high temperatures the optical response would be determined by the paramagnetic bands structure rather than by the ferromagnetic one, but this temperature may be much higher than Curie temperature. In fact, local moment systems, e.g. Fe, retain magnetic splitting at the atomic level well above the Curie temperature where the spins lose their long range order. One way to detect such a situation in zero temperature calculations is to compare ferro- and antiferromagnetic energies and moment. If the difference between the two (set by the interatomic exchange energy) is small compared to the intraatomic exchange (Hund energy) taken as the difference between a magnetic and the nonmagnetic state, and the moments are not sensitive to the local order, one has a local moment system.
CrO2 is an intermediate case: the antiferromagnetic structure appears higher in energy than the ferromagnetic by about a quarter of an eV/cell (which corresponds to K, in accord with the experiment), while the one without spin polarization is higher again in energy than the antiferromagnetic one by about the same amount[34]. On the other hand, the antiferromagnetic CrO2 is metallic (not a half-metal), but the magnetic moment inside the Cr atomic sphere is only weakly changed (1.56 vs. 1.97 ).
To summarize, we present the first all-electron and full potential LSDA band structure and optical coefficients calculations for CrO2. We show that apart from anomalously strong electron-magnon scattering, which naturally follows from its half-metallic band structure, the experimental observations may be interpretable in terms of quasi-one-electron band theory. Thus there is no experimental smoking gun in regard to strong correlations related exotic phenomena in CrO2. Contrary to some conclusions deduced from less accurate band structure calculations, we find very modest specific heat renormalization, and the optical plasma frequency in reasonable agreement with the low temperature far infrared optical experiments, and interband transitions starting from zero frequency. The latter explains the non-Drude shape of the observed optical conductivity in the range of 500 to 4000 cm-1.
The authors are grateful to D.N. Basov for numerous stimulating discussions and for making the results of Ref.[11] available prior to publication. This work was supported in part by the Office of Naval Research.
REFERENCES
- [1] K.-H. Schwarz, J. Phys. F: Met. Phys. 16, L211 (1986).
- [2] E. Kulatov and I.I. Mazin: J.Phys.: Cond.Matt. 2, 343 (1990).
- [3] S. Matar et al, J. Phys. (Paris) 2, 315 (1992).
- [4] A.V. Nikolaev and B.V. Andreev, Phys. Sol. State 35, 603 (1993).
- [5] H. van Leuken and R.A. de Groot, Phys. Rev. B 51, 7176 (1995).
- [6] S. P. Lewis, P.B. Allen, and T. Sazaki, Phys. Rev. B 55, 10 253 (1997).
- [7] M.A. Korotin, V.I. Anisimov, D.I. Khomskii, and G.A. Sawatzky, cond-mat/9705091.
- [8] H.Y. Hwang, S.W. Cheong, Science 278, 1607 (1997).
- [9] T. Tsujioka, T. Mizokawa, J. Okamoto, A. Fujimori, M. Nohara, H. Takagi, K. Yamaura, and M. Takano, Phys. Rev. B 56, R15 509 (1997).
- [10] L. Ranno, A. Barry, and J.M.D. Coey, J. Appl. Phys. 81, 5774 (1997).
- [11] D.N. Basov, E.J. Singley, C.P. Weber, A. Barry, and J.M.D. Coey, preprint.
- [12] A.M. Bratkovsky, Appl. Phys. Lett., 72, 2334 (1998).
- [13] J. M. D. Coey, A. E. Berkowitz, Ll. Balcells, F. F. Putris , and A. Barry, Phys. Rev. Lett. 80, 3815 (1998).
- [14] P. Sorantin and K. Schwarz, Inorg. Chem. 31, 567 (1992).
- [15] N. Schubert and E. Wassermann (unpublished); data quoted in H. Brändle, D. Weller, S. S. P. Parkin, J. C. Scott, P. Fumagalli, W. Reim, R. J. Gambino, R. Ruf, and G. Güntherodt, Phys. Rev. B 46, 13 889 (1992).
- [16] O.K. Andersen, Phys. Rev. B12, 3060 (1975).
- [17] D.J. Singh, Planewaves, Pseudopotentials and the LAPW Method, Kluwer, Boston (1994).
- [18] In Ref.[9] a value and eV was deduced by comparing the distance between the maxima in photoemission and in BIS spectra ( eV) with the distance between the maxima in occupied and unoccupied DOS in LSDA calculations of Ref. [1] ( eV) . Since the splitting between occupied and empty -states is mostly due to exchange and crystal field, this procedure is somewhat uncertain, however.
- [19] See Ref. [7] for detailed discussion of the hybridization-induced reduction of effect in CrO2.
- [20] G. Krier, O. Jepsen, A. Burkhardt, and O.K. Andersen, The TB-LMTO-ASA Program, preprint
- [21] Yu.A. Uspenskii, E.T. Kulatov, and S.V. Halilov, Phys. Rev. B 54, 474 (1996).
- [22] O.K. Andersen, A.V. Postnikov, and S. Yu. Savrasov, Mat. Res. Symp. Proc. 253, 37 (1992).
- [23] We use the standard tetragonal symmetry notations; the points , Z, X, M, A and R have coordinates, in units of , (000),(001),(100),(110), (101) and (111), respectively.
- [24] C. Herring, Phys. Rev. 52, 365 (1937).
- [25] S.N.Rashkeev, Y.A.Uspenski, and I.I.Mazin, Soviet Physics - JETP, 61, 1004 (1985).
- [26] A. Barry, J.M.D. Coey, L. Ranno, and K. Ounadjela, unpublished; data quoted in Ref. [11].
- [27] Although CrO2 is tetragonal with its electronic structure is quasi-isotropic, with Surprisingly, the pseudopotential calculations of Lewis et al[6] yielded an opposite anisotropy of 1.13. Since they do not show their band structure we cannot comment on this discrepancy, but emphasize that in our calculations as a function of the Fermi energy was less than one for the whole valence band in either spin channel. Anisotropy even increases away from the Fermi level, because states there are mainly of oxygen and/or Cr character. The bands that cross the Fermi level are predominantly states of symmetry (as first noted by Korotin et al [7]), and they are highly dispersive in all three directions. (We find all these bands to be predominantly of Cr character, with strong admixture of the oxygen character; in Ref.[7] one of these bands was identified as a predominantly oxygen band, probably due to a larger oxygen AS radius.)
- [28] L. Klein, J.S. Dodge, C.H. Ahn, G.J. Snyder, T.H. Geballe, M.R. Beasley and A. Kapitulnik, Phys. Rev. Lett. 77, 2774 (1996).
- [29] I. I. Mazin and D. J. Singh, Phys. Rev. B56, 2556 (1997).
- [30] In the experiment reported in Ref. [11] this polarization was likely to be overweighted in the reflectivity (D.N. Basov, private communication).
- [31] Y.A.Uspenski, E.G.Maksimov, S.N.Rashkeev, and I.I.Mazin, Z. Phys., B53, 263 (1983). Note that calculations of Uspenski et al [21] were performed without combined corrections to the matrix elements.
- [32] Applying quasiisotropic Kramers-Kronig analysis to optically anisotropic polycrystalline samples may even create artificial peaks in the optical conductivity, see e.g. I.I.Mazin, E.G.Maksimov, S.N.Rashkeev, S.Y.Savrasov, and Y.A.Uspenski: Soviet Physics - JETP Lett., 47, 94 (1988).
- [33] P. Blaha, K. Schwarz, and J. Luitz, Vienna University of Technology (1997). (Improved and updated Unix version of the WIEN code, published by P. Blaha, K. Schwarz, P. Sorantin and S. B. Trickey, Comp. Phys. Commun., 59, 399 (1990).)
- [34] From LMTO calculations. We did not perform LAPW calculations for the antiferromagnetic ordering.


| LAPW (HL) | LAPW (PW91) | LMTO (vBH) | LMTO (VWN) | LMTO (LM) | LMTO(PW91) | LMTO (VWN)a | LMTO(PW91)a |
|---|---|---|---|---|---|---|---|
| 0.31 | 0.69 | 0.24 | 0.31 | 0.42 | 0.55 | 0.50 | 0.62 |
aUsing setup from Ref.[7].