[
Doping Dependent Density of States and Pseudogap Behavior in La2-xSrxCuO4
Abstract
We have made a high-resolution photoemission study of La2-xSrxCuO4 in a wide hole concentration () range from a heavily overdoped metal to an undoped insulator. As decreases, the spectral density of states at the chemical potential () is suppressed with an -dependence similar to the suppression of the electronic specific heat coefficient. In the underdoped region, the spectra show a pseudogap structure on the energy scale of 0.1 eV. The width of the pseudogap increases with decreasing following the -dependence of the characteristic temperatures of the magnetic susceptibility and the Hall coefficient.
pacs:
PACS numbers: 71.30.+h, 74.72.Dn, 74.25.Jb, 79.60.Bm]
In order to understand the mechanism of high-temperature superconductivity in doped cuprates, a central issue has been the evolution of the electronic structure with hole doping near the filling-control metal-insulator transition (MIT). In spite of extensive photoemission studies, it still remains unclear how the electronic structure evolves, especially, between underdoped metal and antiferromagnetic insulator. For a systematic study of the doping dependence near the MIT, La2-xSrxCuO4 (LSCO) is a suitable system. It has the simplest crystal structure with single CuO2 layers and the hole concentration in the CuO2 plane is well controlled over a wide range and uniquely determined by the Sr concentration (and small oxygen non-stoichiometry). So far photoemission studies of high- cuprates were concentrated on Bi2Sr2CaCu2O8 (BSCCO) and YBa2Cu3O7-y (YBCO) systems. With the LSCO system, one can investigate the electronic structure of the CuO2 plane continuously from the heavily overdoped limit () to the undoped insulator () in a single system.
Recently, in underdoped cuprates a “normal-state gap” behavior above has been observed by angle-resolved photoemission spectroscopy (ARPES) in BSCCO [3] and a “spin-gap behavior” by NMR in YBCO [4]. The magnitude of the normal-state gap is of the same order as the superconducting gap at optimal doping. Meanwhile, underdoped cuprates have characteristic temperatures which are considerably higher than in the uniform magnetic susceptibility [5], the electronic specific heat [6], the Hall coefficient [7] and the electrical resistivity [5]. All these characteristic temperatures show similar behaviors in LSCO: they increase from 300 K at optimal doping to 600 K at for the LSCO system, suggesting a pseudogap-type electronic structure. In addition, it can be reconciled only if a pseudogap is opened at the chemical potential that both the electronic specific heat coefficient [6, 8] and the chemical potential shift with doping [9] are suppressed towards the MIT. To obtain a full picture of the evolution of those “gaps,” it is also necessary to know the total density of state (DOS), which is most directly observed by angle-integrated photoemission spectroscopy (AIPES). In the present study, we have performed high-resolution AIPES measurements and made a systematic study of the doping dependence of the electronic structure of the LSCO system, focusing on the evolution of a pseudogap, in a wide hole concentration range from (undoped) to (heavily overdoped).
High-quality single crystals of LSCO were grown by the traveling-solvent floating-zone method. The samples had ’s of 18, 34, 32, 21 and 0 K for and 0.30, respectively, with transition widths of about 0.5 K. All the samples were annealed to make the oxygen content stoichiometric. The sample was annealed in a reducing atmosphere (100 Torr O2 at 800∘C) and confirmed that the Néel temperature was higher than 250 K, meaning that the hole concentration was less than 0.004 [10]. Photoemission measurements were carried out using the He I line ( eV) with an overall energy resolution of meV. The base pressure in the spectrometer was in the Torr range. Clean surfaces were obtained by in situ scraping with a diamond file in every 40 minutes. In order to minimize the degradation of sample surfaces, the measurements were performed at K. Only sample was measured at K to avoid charging effect, but still a slight charging effect (at most meV) could not be eliminated. Energies were carefully calibrated using Au evaporated on each sample so that its uncertainty was about 1 meV. The spectra were corrected for the He I∗ satellite assuming that He I∗/He I ratio is constant in all the spectra.
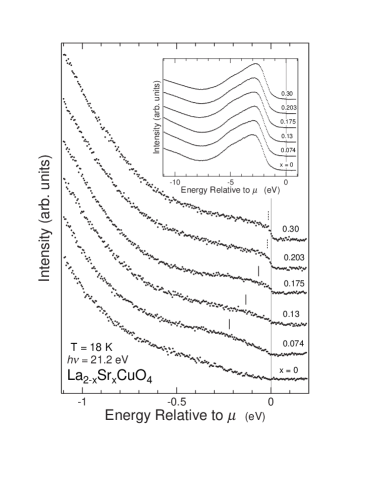
Figure 1 shows photoemission spectra for various compositions. The whole valence-band spectra given in the inset show no trace of a hump at eV, indicating the high sample quality and the cleanliness of the sample surfaces. The spectra have been normalized to the maximum intensity of the valence band since the area of the valence band was hard to determine accurately due to the experimentally ambiguous background. As decreases, the intensity at the chemical potential decreases and disappears in the insulating phase (). While in the overdoped region () the spectra show an ordinary metallic Fermi edge, in the underdoped region () the spectra show a pseudogap-type lineshape around in the sense that the spectral intensity gradually diminishes towards from somewhat below as marked by vertical bars in Fig. 1. Here the vertical bars indicate the points of maximum curvature. It appears that a rather large pseudogap develops with decreasing , with its width and depth increasing towards . Note that the energy scale of the DOS suppression is as large as the order of eV (“high-energy pseudogap”) and therefore that it does not correspond to the “normal-state gap” which has a magnitude similar to the superconducting gap ( meV for BSCCO) and has been observed in the ARPES spectra of underdoped BSCCO (“low-energy pseudogap”) [3]. In view of the energy scale, the marked feature in the AIPES spectra may rather correspond to the broad feature at (,0) in the ARPES spectra of underdoped BSCCO [11]. Unfortunately, since the present spectra were taken at a low temperature ( K), one cannot judge whether the low-energy normal-state gap is opened or not in the underdoped LSCO.
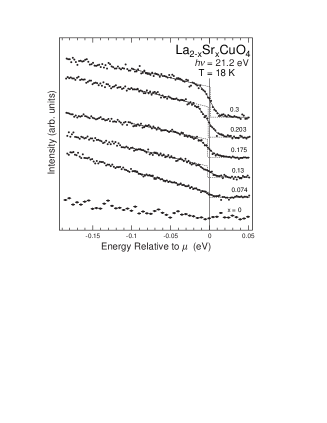
In order to determine the spectral DOS at , , and the precise position of the leading edge, the spectra near ( eV) have been fitted to a linear DOS multiplied by the Fermi-Dirac distribution function convoluted with a Gaussian of the instrumental resolution, as shown in Fig. 2. The obtained are shown in Fig. 3 (a), where error bars include uncertainties in the normalization procedure due to subtle changes in the valence-band lineshape. In Fig. 3 (a), is compared with the specific heat coefficient [8] and the Pauli-paramagnetic component of the spin susceptibility [5]. The three quantities, , and , show quite similar -dependences: for , with decreasing they slowly increase or remain nearly constant, take a maximum around and then decrease towards for . A similar behavior was predicted by Hubbard-model calculations [12] although the absolute value of the calculated was much higher than the observed one. Using the quasiparticle (QP) density at , , obtained from [], and the unrenormalized DOS at , , calculated by band theory [13], one can deduce the mass enhancement factor and the renormalization factor as shown in Fig. 3 (b). Figures 3 (a) and (b) imply that the decrease in is driven by the decrease in associated with the development of the high-energy pseudogap. The renormalization factor (or equivalently the QP spectral weight) also decreases towards , but it is not clear whether goes to zero or remains finite as because of experimental uncertainties. It should be noted that the QP mass is enhanced as decreases for , i.e., in the region where the pseudogap is absent. The behavior for is similar to that of the typical Mott MIT system La1-xSrxTiO3, which shows a QP mass () enhancement with decreasing until the boundary of the antiferromagnetic (AF) phase is reached [14].
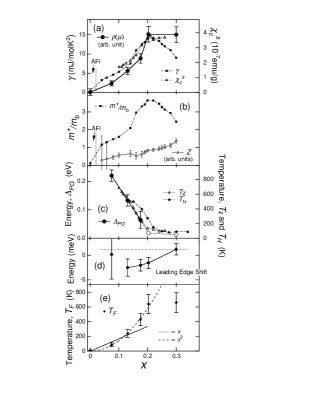
The energy of the high-energy pseudogap was defined by the binding energy of the point of maximum curvature determined by taking the second derivatives (as marked by the vertical bars in Fig. 1). The values are plotted in Fig. 3 (c), which shows that follows the -dependence of the characteristic temperatures [5] and [7]. Here and are temperatures at which the magnetic susceptibility takes a maximum and below which the Hall coefficient increases, respectively. It has also been reported that the temperature below which the electrical resistivity deviates downward from the linear- behavior follows and [5]. The similar -dependences of , , and imply that these temperatures are closely related to the development of the high-energy pseudogap. We may therefore refer to those characteristic temperatures as the “pseudogap temperature” . We then find , indicating the interaction is in the strong coupling regime.
In the low-energy region, the position of the leading-edge midpoint obtained from the fitting is shown in Fig. 3 (d). In going from the overdoped region to the optimum doping, the edge is shifted downward by meV. If we attribute the shift to the opening of a superconducting gap, we obtain the ratio , which is smaller than the typical value () deduced from ARPES of BSCCO and YBCO [15]. However, if the superconducting gap is anisotropic as in -wave pairing, it is understandable that the angle-integrated spectra fitted to the simple step function give a smaller leading-edge shift than the ARPES data.
In the underdoped regime, since is small and the slope of DOS at , , is steep, the Fermi edge is obscured at high temperatures and the Fermi-Dirac distribution lose its meaning. The crossover temperature for such a disappearance of the Fermi edge is thus given by [Fig. 3 (e)] and may be called the “coherence temperature” of the doped holes. may also be understood as the “Fermi temperature” of the doped holes because if one linearly extrapolates the DOS beyond , then a hole pocket has the Fermi energy of . For such a hole pocket, transport at high temperatures would be dominated by the incoherent charge dynamics of the doped holes [16]. Figure 3 (e) shows that becomes very low (K) in the underdoped regime, indicating that the thermodynamic and transport properties behave as those in “incoherent metals.” Note that is considerably lower than and even lower than in the underdoped region. Under such a condition, the kinetic energy gain of the doped holes alone may be insufficient to destroy the AF order, and alternatively the disappearance of the long-range order may be attributed to strong quantum fluctuations characteristic of two-dimensional systems. Figure 3 (e) also suggests that for small , scales with rather than . According to the hyperscaling hypothesis of MIT [17], the critical behavior of and chemical potential shift near MIT is given by and , where is the dynamical exponent of the MIT and is the spatial dimension (). Thus the present result () implies and is consistent with the observed suppression of the chemical potential shift () in underdoped LSCO [9]. This value is distinctly different from that of an ordinary metal-to-band insulator transitions, where .
Finally, let us discuss the microscopic origin of the pseudogap behavior. Since the energy scale of the present pseudogap is of the order of the super-exchange energy eV, it is tempting to associate the pseudogap with the development of AF correlations or short-range AF order in the underdoped region [18, 19]. In this scenario, when the temperature is lowered below , the AF correlation length increases and consequently the DOS shows a pseudogap reminiscent of the AF band gap [20]. The observed pseudogap may also be related with the short-range stripe order because it also originates from AF correlations. It has been stressed that LSCO is close to the instability of stripe order even in the metallic phase [21, 22]. Since in the underdoped region, the system cannot be regarded as a normal Fermi liquid which is weakly perturbed by AF correlation but rather as an AF state perturbed by the motion of doped holes. As an alternative scenario, a pseudogap may be produced by preformed Cooper pairs, which lose their coherence above but still keep local pairing, [23, 24, 25], or by spinon pairing which already occurs above [26]. However, interactions which lead to such pairing would have only small energies; that is, the energy scale of such a pseudogap should be of the same order as that of the superconducting gap ( meV) at least in the slightly underdoped region. Probably, such a low-energy pseudogap corresponds to the spin gap in NMR of YBCO, the normal-state gap in ARPES of BSCCO and the gap observed by tunneling spectroscopy and is related with the drop in the electric resistivity just above [27]. On the other hand, the high-energy pseudogap observed in the present work corresponds to the anomalies in the magnetic susceptibility, the Hall effect and the specific heat. Then the question may arise whether the high-energy pseudogap and the low-energy normal-state gap or spin gap are interrelated or not. Further studies are necessary to resolve this interesting issue, which is directly related to the mechanism of superconductivity in the doped cuprates.
In conclusion, we have found a large pseudogap on the energy scale of 0.1 eV in the DOS of La2-xSrxCuO4 by AIPES. The presented spectra have given us a clear view of the evolution of the pseudogap from the overdoped metal to the undoped insulator. Its evolution with decreasing is represented by the increase of the pseudogap energy and the suppression of the spectral DOS as well as the QP density at near the AF insulating phase. Consequently, the coherence temperature is much smaller than in the underdoped region, suggesting that an incoherent metallic state may dominate the thermodynamic and transport properties of the underdoped cuprates. The origin of the present large pseudogap is most likely due to AF correlations or short-range AF order, while its relation to the smaller “normal-state gap” or “spin gap” remains an open question and should be addressed in future studies.
We would like to thank M. Imada and Z.-X. Shen for helpful discussions. This work is supported by a Grant-in-Aid for Scientific Research from the Ministry of Education, Science, Sports and Culture, the New Energy and Industrial Technology Development Organization (NEDO) and Special Promotion Funds of the Science and Technology Agency, Japan.
REFERENCES
- [1] Present address: Joint Research Center for Atom Technology, National Institute for Advanced Interdisciplinary Research, 1-1-4 Higashi, Tsukuba, Ibaraki 305, Japan.
- [2] Present address: The Institute of Physical and Chemical Research (RIKEN), SPring-8, Kamigori-cho, Hyogo 678-12, Japan.
- [3] D. S. Marshall et al., Phys. Rev. Lett. 76, 4841 (1996); H. Ding et al., Nature (London) 382, 51 (1996).
- [4] H. Yasuoka, T. Imai, and T. Shimizu, in Strong Correlation and Superconductivity edited by H. Fukuyama, S. Maekawa, and A. P. Malozemof (Springer-Verlag, Berlin, 1989) p. 254; M. Takigawa et al., Phys. Rev. B 43, 247 (1991).
- [5] T. Nakano et al., Phys. Rev. B 49, 16000 (1994).
- [6] J. W. Loram et al., Physica (Amsterdam) 235C, 134 (1994)
- [7] H. Y. Hwang et al., Phys. Rev. Lett. 72, 2636 (1994); T. Nishikawa, J. Takeda, and M. Sato, J. Phys. Soc. Jpn. 63, 1441 (1994).
- [8] N. Momono et al., Physica (Amsterdam) 233C, 395 (1994).
- [9] A. Ino et al., Phys. Rev. Lett. 79, 2101 (1997).
- [10] C. Y. Chen et al., Phys. Rev. B 43, 392 (1991).
- [11] Z.-X. Shen and J. R. Schrieffer, Phys. Rev. Lett. 78, 1771 (1997).
- [12] D. Duffy et al., Phys. Rev. B 56, 5597 (1997).
- [13] L. F. Mattheiss, Phys. Rev. Lett. 58, 1028 (1987).
- [14] Y. Tokura et al., Phys. Rev. Lett. 70, 2126 (1993).
- [15] Z.-X. Shen et al., Phys. Rev. Lett. 70, 1553 (1993).
- [16] J. Jaklič and P. Prelovšek, Phys. Rev. B 52, 6903 (1995).
- [17] M. Imada, J. Phys. Soc. Jpn. 64, 2954 (1995).
- [18] J. R. Schrieffer and A. P. Kampf, J. Phys. Chem. Solids 56, 1673 (1995)
- [19] J. Schmalian, D. Pines and B. Stojkovic, Phys. Rev. Lett. 80, 3839 (1998).
- [20] R. Preuss et al., Phys. Rev. Lett. 79, 1122 (1997).
- [21] M. I. Salkola, V. J. Emery, and S. A. Kivelson, Phys. Rev. Lett. 77, 155 (1996).
- [22] J. M. Tranquada et al., Nature (London) 375 561 (1995).
- [23] S. Doniach and M. Inui, Phys. Rev. B 41, 6668 (1990); N. Trivedi and M. Randeria, Phys. Rev. Lett. 75, 312 (1995).
- [24] V. J. Emery and S. A. Kivelson, Nature (London) 374, 434 (1995).
- [25] M. Imada, J. Phys. Soc. Jpn 62, 1105 (1993).
- [26] T. Tanamoto, H. Kohno, and H. Fukuyama, J. Phys. Soc. Jpn. 61, 1886 (1992).
- [27] N. Momono et al., J. Phys. Chem. Solids, in press.