Manifestation of spin–charge separation in the dynamic dielectric response of one–dimensional Sr2CuO3
Abstract
We have determined the dynamical dielectric response of a one–dimensional, correlated insulator by carrying out electron energy–loss spectroscopy on Sr2CuO3 single crystals. The observed momentum and energy dependence of the low–energy features, which correspond to collective transitions across the gap, are well described by an extended one–band Hubbard model with moderate nearest neighbor Coulomb interaction strength. An exciton–like peak appears with increasing momentum transfer. These observations provide experimental evidence for spin–charge separation in the relevant excitations of this compound, as theoretically expected for the one–dimensional Hubbard model.
pacs:
PACS numbers: 71.27.+a, 71.45.Gm, 71.10.FdLow dimensional, correlated systems have attracted much attention in recent years not only because of the discovery of high-temperature superconductivity for the two-dimensional (2D) case of copper-oxide planes, but in general due to a large variety of unconventional magnetic and electronic properties directly connected with the reduced dimensionality and/or electronic correlations. In this context one–dimensional (1D) systems are of special interest, essentially stimulated by theoretical predictions like that of spin–charge separation for the Hubbard model [1, 2]. Quasi–1D materials based on cuprate compounds, of which Sr2CuO3 is the best example, have become new candidates for ideal model systems which allow the study of basic physical concepts in one–dimension and represent a touchstone for the theoretical models of high-Tc-cuprates. Magnetic susceptibility measurements have shown that Sr2CuO3 can be regarded as an almost ideal realization of the 1D spin- antiferromagnetic (AF) Heisenberg model[3, 4], which describes the magnetic excitations of a Mott–Hubbard insulator.
Information on the electronic structure and the dynamics of the charge carriers is highly desirable, especially against the background of spin–charge separation expected in 1D. Up to now angle resolved photoemission spectroscopy (ARPES) has been performed on the related compound SrCuO2 [5], which is composed of two neighboring, but at room temperature magnetically decoupled, copper-oxide chains. The ARPES data have been interpreted in terms of holon and spinon bands, with bandwidths related to the hopping term and the exchange constant , respectively. Beside the one–particle spectral function obtained by photoemission, the dielectric function is the most basic and important quantitiy reflecting the electronic structure of a solid. The dielectric response is accessible using optical spectroscopy for the special case of zero momentum transfer. Electron energy–loss spectroscopy (EELS) on the other hand, offers the possibility to study the momentum dependence of the electronic excitations, i.e. the dynamical dielectric response. EELS measurements for the 2D system Sr2CuO2Cl2 [6] have been interpreted in terms of a small exciton model, where it was assumed that the singlet excitons may propagate freely in the AF spin background, whereas single particle propagation is suppressed. In contrast, in our 1D case spin–charge separation naturally leads to no frustration of the kinetic energy of carriers excited across the gap, and therefore both continuum states as well as excitonic bound states play a role.
In this Letter we present the first investigations of the dynamical dielectric response of Sr2CuO3. We have carried out EELS measurements in transmission on single crystalline samples, which provides us with the energy and momentum dependent loss function Im. While for small momentum transfer we see a broad continuum of interband plasmons above the gap, on the way to the zone boundary a sharp peak develops. We show that the data can be understood within an extended effective one–band Hubbard model, and that both the spin–charge separation which occurs in 1D as well as excitonic effects are essential.
Single crystals of Sr2CuO3 were grown using a travelling solvent-zone technique [4]. For our EELS studies in transmission, films of about 1000 Å thickness were cut from the crystals using an ultramicrotome with a diamond knife. The measurements were performed at room temperature using a specially designed high resolution spectrometer [7] with a primary beam energy of 170 keV. The energy and momentum resolution were set to be 115 meV and 0.05 Å-1 for 0.5 Å-1, and 160 meV and 0.06 Å-1 for 0.5 Å-1 due to the necessity of increasing the electron beam intensity for large momentum transfer . The high quality and the orientation of the single crystalline films were carefully checked by in situ electron diffraction. For recording the loss function the momentum transfer was aligned along the chain direction ([010]). It is important to note that EELS in transmission is a not surface sensitive technique, in contrast to many other electron spectroscopies. The dielectric function, , and thus the optical conductivity was obtained from the loss function by a Kramers–Kronig analysis.
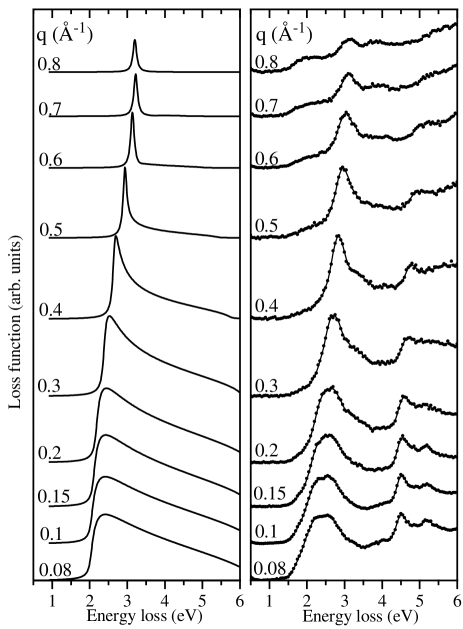
In the right panel of Fig. 1 we show the loss function of Sr2CuO3 for different momentum transfers parallel to the chain direction. The spectra are normalized to equal count rates in the energy range of 9.4-10.4 eV (not shown), where they are practically momentum independent. Due to contributions of the elastic line and surface losses it is not possible to measure at zero momentum transfer but very close to the optical limit (0.08 Å-1). With 0.8 Å-1 being the zone boundary, our measurements cover the complete Brillouin zone in the [010] direction. Peaks in the loss function in the low energy range discussed here arise from collective excitations (plasmons) related to interband transitions. In the spectrum for 0.08 Å-1, the first possible interband transitions across the gap form a broad continuum like absorption feature in the loss function around 2.4 eV. The spectral onset is found to be at 1.6 eV. Two further comparatively sharp maxima are observed at 4.5 eV and 5.2 eV, which are probably already connected with excitations not only within the CuO3 chain, but involving Sr orbitals. As a function of momentum transfer, the peak at 4.5 eV shifts towards higher energy, accompanied by a drop in intensity and an increasing spectral width. This mainly reflects the decreasing lifetime of the excited state and represents the usual behavior of an interband plasmon in EELS.
In the following we will focus on the loss function in the range of 1.6 eV to 4 eV since here the spectral features are expected to be exclusively due to transitions within the CuO3 chain and model calculations are believed to be of relevance. When comparing the momentum dependence of the loss function for this energy range with the higher lying features described above a completely different behavior is observed. The broad absorption continuum present near the zone center (Å-1) narrows with increasing momentum transfer, evolving into a single rather sharp peak centered at 2.8 eV for Å-1 with a width of only eV. At the same time, the integrated intensity stays almost constant indicating a transfer of spectral weight from the continuum to the sharp peak. The remainder of the continuum is visible as a shoulder at around 3.3 eV. Going into the second half of the Brillouin zone the peak gets slightly broader possibly due to an enhanced total background arising from multiple scattering for large . At the zone boundary (Å-1) the excitation is centered at 3.2 eV. Additionally, close to the zone boundary a second peak appears at 3.8 eV. The spectral weight at 2 eV which starts to be visible for Å-1 has its origin in double scattering processes (inelastic scattering plus phonon or impurity scattering with equal to that set by the spectrometer), leading to the appearance of the spectrum for in the curves at high momentum transfer [7].
The most unusual feature of the loss function described above is the anomalous narrowing of the low–energy peak with increasing momentum transfer. Although it is widely accepted that cuprates like Sr2CuO3 are charge transfer insulators, an effective one–band Hubbard model has been quite successful in describing many low–energy experimental features of related compounds [5, 8]. One is therefore led to ask whether or not this also holds here. Recently, two of us [9] studied the imaginary part of the zero temperature density response function
| (1) |
of the extended one–band Hubbard model,
| (3) | |||||
where , with Fourier transform , and is the ground state. The local Coulomb interaction of this model would correspond to the charge transfer energy of a multi–band charge transfer model. The loss function is proportional to the imaginary part of the response function shown in Eq. (1), if the long–range Coulomb interaction were also included in the model. We may, however, include this at an RPA-level of approximation by using the response function calculated for the short–range interaction model (3) as the “Lindhard function” within the RPA [10]:
| (4) |
Within this approach we find that the screening effects can be quite well described as a renormalization of the short–range interaction, so that a qualitatively correct picture is provided already with the short range model.
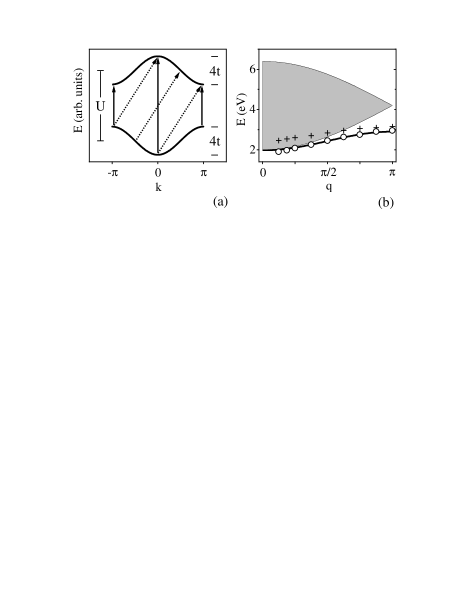
As a first step we therefore want to discuss our experimental data in a qualitative way making use of the result for the density response function of the model (3). It was shown in Ref. [9] that in the strong–coupling limit , the response function may be calculated within an effective –like model, where exactly one “hole” and one “double occupancy” are explicitly included in the states excited across the Mott–Hubbard gap. It was further shown that upon making use of the wave function factorization [2] which holds in this limit, to very good approximation the spin degrees of freedom decouple from the problem, which is due to the off-diagonal long range order of singlet pairs in the quantum spin chain[11]. We are then left with an effective (spinless) particle–hole model, with a nearest neighbor attraction between the double occupancy (doublon) and holon, with opposite signs of hopping matrix element for the two carriers, and with the band centers separated by . As sketched in Fig. 2, in the small limit one then expects an optical gap of , followed by a continuum of interband transitions up to an energy of . Going to higher momentum transfers the range of possible interband transitions decreases, leading to an excitation energy at the zone boundary. The inclusion of finite nearest-neighbor Coulomb repulsion leads to the possibility of the formation of an excitonic state. For the exciton lies within the continuum in the optical limit (), and is therefore not a well defined excitation there, but will appear at the zone boundary at energy , accounting for almost all of the spectral weight (Fig. 2 (b)) [9]. The narrowing of the low-energy feature in the EELS data with increasing can be explained within this scheme. Once again we stress that the effective band structure sketched in Fig. 2 (a) represents the holon–doublon dispersion relations, and not a band structure in the conventional sense. If there were significant coupling to spin excitations then the narrowing of the continuum would be counteracted by the possiblity of momentum transfer to spinons.
We would now like to make this discussion more quantitative. To account for the collective excitations excited in an EELS experiment, the effects of long range Coulomb interaction and interchain coupling must be included. As mentioned above, this may be done within RPA approximation by solving for the density response of the model (3), and then using the RPA form [10] to connect this screened response to the loss function which is proportional to Im, Eq. (4).
In Fig. 1 (left panel) we present the loss function calculated using the solution for given in Ref. [9] and Eq. (4). The curves shown here are obtained with the parameter set eV, eV, eV, and represent the best description of the experimental data. Although a quantitative error analysis is difficult, already a 10 percent deviation from these values leads to noticeably worse agreement with the measurements. Note that the momentum dependence of the lineshape provides a strong constraint on the parameters in addition to that given by the dispersion. Of course, the exact lineshape observed at low is not reproduced by our theory, but considering the simplifications inherent in our model the agreement with the measured loss function (right panel) is reasonable.
Our value for is consistent with eV obtained from the holon dispersion observed in SrCuO2 in Ref. [5], as well as eV extracted from band structure calculations [12]. Once again, we must emphasize that eV here represents the unscreened value, and that screening effects are treated in the RPA. For a Hamiltonian of the form (3) without long–range Coulomb interactions, a smaller screened value of is appropriate. In the present case eV used with Eqs. (1) and (3) leads to a similar correspondence to our EELS data, and should be used for model studies without long range interactions. In this context we note that a possible screening of U would be a higher order effect and thus would be unlikely to play a significant role.
To obtain more direct information about the interband transitions responsible for the collective excitations in the loss function we have also derived the optical conductivity from our measured data by a Kramers–Kronig analysis with . For small momentum transfer our result is consistent with optical measurements [13] of the conductivity, where no indications of excitonic states are observed, despite the much better energy resolution. This corroborates our interpretation of the peak at small momentum transfer being a continuum, and not for example as resulting from several overlapping peaks which are not resolved clearly. Regarding the dispersion, the peak position in the optical conductivity as obtained from our EELS data is in excellent agreement with the corresponding peaks of directly calculated within the above model and parameter set (heavy line in Fig. 2 (b)). In addition, the peak positions of the loss function (denoted by crosses) clearly show the expected plasmonic shift relative to those in .
While this work demonstrates the applicability of the effective one–band model for the low–energy electronic properties of the Cu-O chains, our treatment here is clearly semi–phenomenological in the sense that the model itself is microscopically non–trivial to justify. When one considers more complicated multi–band models which more obviously reflect the local chemistry of Sr2CuO3, excitations appear at higher energies which are not included within our present approach. In general some of the degrees of freedom included in multi–band models may lead to relevant additional excitations overlapping in energy range with those described by the simple one–band model. Calculations in the framework of a two-band model show additional “excitonic” features for large momentum transfers beyond the one obtained in the one–band model, but with very similar low–energy and small momentum transfer behavior to that discussed here [14]. The peak at 3.8 eV observed close to the zone boundary in EELS can probably be described within a two- or three-band model, although the results of Ref. [14] are quantitatively accurate only for parameters which are not realistic for Sr2CuO3, so this point remains open.
In conclusion, we have carried out EELS measurements of the one–dimensional correlated insulator Sr2CuO3. The momentum and energy dependence of the dielectric response at low energies can be well described within an extended one–band Hubbard model. The unusual narrowing of the lowest energy feature with increasing momentum transfer arises due to a combination of two effects: a) the band structure of the excited carriers in the effective model quite naturally leads to a kinematic narrowing of the interband continuum with increasing momentum; b) the presence of a moderately large Coulomb attraction between the excited holon–doublon pair leads to an excitonic bound state, which sharpens and lies below the continuum only for momentum transfers away from the Brillouin zone center. Due to the spin–charge factorization which holds for our 1D model, we are able to discuss in points a) and b) a model with no coupling of carriers to the spin background. Therefore the measurements presented here are also a manifestation of the charge–spin separation theoretically expected for the 1D Hubbard model.
We would like to acknowledge fruitful discussions with S.-L. Drechsler and H. Shiba. Financial support was provided by the German Bundesministerium für Bildung, Forschung und Technologie (BMBF) under Contract No. 13N6599/9, the Max Planck Gesellschaft, the Ministry of Education, Science and Culture, Japan (COE Grant), and the New Energy and Institute Technology Developement Organization (NEDO).
REFERENCES
- [1] J. Voit, Rep. Prog. Phys. 58, 977 (1995).
- [2] F. Woynarovich, J. Phys. C: Solid State Phys. 15, 97 (1982); M. Ogata and H. Shiba, Phys. Rev. B 41, 2326 (1990).
- [3] T. Ami et al., Phys. Rev. B 51, 5994 (1995).
- [4] N. Motoyama, H. Eisaki, S. Uchida, Phys. Rev. Lett. 76, 3212 (1996).
- [5] C. Kim et al., Phys. Rev. Lett. 77, 4054 (1996); C. Kim et al., Phys. Rev. B 56, 15589 (1997).
- [6] Y.Y. Wang et el., Phys. Rev. Lett. 77, 1809 (1996).
- [7] J. Fink, Adv. Electron. Electron Phys. 75, 121 (1989).
- [8] B.O. Wells et al., Phys. Rev. Lett. 74, 964 (1995).
- [9] W.Stephan, K. Penc, Phys. Rev. B 54, 17269 (1996).
- [10] See e.g. D. Pines, Elementary Excitations in Solids, (Addison-Wesley, 1963) Chap. 3-4.
- [11] J. C. Talstra, S. P. Strong and P. W. Anderson, Phys. Rev. Lett. 74, 5256 (1995).
- [12] H. Rosner et al., Phys. Rev. B 56, 3402 (1997).
- [13] K. Maiti et al., Europhys. Lett. 37, 359 (1997).
- [14] K. Penc, W. Stephan, submitted to Phys. Rev. Lett.