[
Signatures of Stripe Phases in Hole Doped La2NiO4
Abstract
We model nickelate-centered and oxygen-centered stripe phases in doped La2NiO4 materials. We use an inhomogeneous Hartree-Fock and random-phase approximation approach including both electron-electron and electron-lattice(e-l) coupling for a layer of La2NiO4. We find that whether the ground state after commensurate hole doping comprises Ni-centered or O-centered charge-localized stripes depends sensitively on the e-l interaction. With increasing e-l interaction strength, a continuous transition from an O-centered stripe phase to a Ni-centered one is found. Various low- and high-energy signatures of these two kinds of stripe phases are predicted, which can clearly distinguish them. These signatures reflect the strongly correlated spin-charge-lattice features in the vicinity of Ni-centered or O-centered stripe domains. The importance of e-l interaction for recent experiments on stripe phases is discussed.
pacs:
PACS numbers: 75.60.Ch, 71.38.+i, 74.25.Nf
]
I Introduction
The interplay of spin, charge and lattice degrees of freedom has been the focus of many classes of electronic materials recently, and results in numerous novel properties[1, 2, 3, 4, 5]. An important example lies in the growing appreciation for the presence and importance of charge localization(small polaron formation) and ordering tendencies in transition metal oxides. Stripe phases are suggested [6] in a variety of nickelates, cuprates and manganites, i.e, fine-scale domain walls separating spin, charge and lattice degrees of freedom into superlattice and long-period patterns. The likely importance of charge coupling to the lattice is becoming evident in determining the formation of stripes when doping into a background of antiferromagnetic order[7, 8, 9]: electron-lattice(e-l) interaction strongly assists localization of the holes through a positive feedback mechanism.
The possible existence of such hole-rich stripe phases has been proposed in the form of antiphase domain boundaries between antiferromagnetically ordered spins in the study of some high temperature superconducting oxides [10, 11, 12, 13, 14, 15] and colossal magnetoresistance manganites[16]. Stripes were first observed in nickelate oxides[17], and the Hubbard model in Hartree-Fock(HF) approximation gave a good description of the ground state of the doped nickelates[7]. Charge ordering is the driving force for the formation of stripes[18]. One feature of both theoretical and experimental interest concerns the orientation of the stripes relative to the lattice[8, 19]. Specifically, whether the stripe in nickelate oxides is Ni-centered or O-centered, and the possible mixture of these two kinds of stripes, has been investigated intensively in recent experiments[8, 19]. Through magnetic-field-induced effects, it is suggested that the stripe phase is O-centered when the temperature T is higher than a temperature Tm, while the Ni-centered stripe phase is favored when T is lower than Tm. However, it is difficult to unambiguously determine the stripe form directly in a standard neutron or X-ray scattering experiment because of the loss of phase information. Similar ideas of site-centered or bond-centered stripe phases in cuprate oxides are also under investigation[20].
Previous modeling of the nickelates gave a reasonable explanation of the mechanism for the formation of stripe phases, but no detailed studies on the experimentally observable consequences has been given. The Ni-centered and O-centered stripe phases should certainly exhibit different experimental signatures. Due to the difficulty of current scattering experiments to directly determine the stripe form, it is very important to investigate these distinguishing observable signatures. As in other small-polaron type phenomena, the relationship between high energies(e.g. optical absorption) and low energy(e.g. lattice spectroscopy) can serve to specify particular structures very distinctly[21].
For a comprehensive understanding of the competition among the spin, charge and lattice degrees of freedom in complex electronic materials such as nickelate oxides, specifically for the spatially inhomogeneous stripe patterns within models of NiO2 planes, we resort here to the inhomogeneous HF plus RPA approach[22, 23]. This has proven to be a robust method for such phenomena, especially when electron-lattice coupling is present, obviating subtle many-body effects and quantum fluctuations[7, 24]. Using a 2-dimensional(2D) tight-binding Peierls-Hubbard model Hamiltonian, we obtain both Ni-centered and O-centered stripe phases. The Ni-centered stripe phase is energetically favored at strong e-l interaction, while the O-centered stripe phase is stable in the weak e-l coupling regime. The transition from the O-centered stripe phase to the Ni-centered one can be clearly identified by defining an appropriate ”order parameter”, as will be discussed in detail below. Local phonon, charge and magnetic modes are found for both of the two kinds of stripe phases, strongly distinguishing the inhomogeneous ground states from the homogeneous undoped situation. The infrared(IR) and Raman spectra and the magnetic excitations for both the nickelate spin and the oxygen spin are distinctive signatures, which should serve to guide experiments to discriminate between Ni-centered or O-centered stripes. Likewise, there are HF levels induced by stripes in the electronic charge-transfer-gap of the undoped case(i.e.intra-gap levels), which are reflected in the optical absorption.
This paper is organized as follows. In Sec.II our 2-dimensional(2D) Hamiltonian model for an NiO2 plane is given, and its various parameters are presented. The differences between this model Hamiltonian for the nickelates and the corresponding one for cuprates[10] are emphasized. The Ni-centered and the O-centered stripe phases and their respective characteristics are comparered in Sec.III. In Sec.IV we discuss predicted observable signatures for both Ni-centered and O-centered stripe phases. A summary and remarks are presented in Section V.
II Model Hamiltonian and Parameters
We consider a 2D four-band extended Peierls-Hubbard model, which includes both electron-electron and electron-lattice interactions [22, 23]. Here, for nickelate oxides, besides the orbital usually included in cuprate oxide models[10, 22, 23], the Ni orbitals must be included to account for the high spin state() at half filling(i.e. undoped). The model Hamiltonian we study is:
| (1) |
Here, creates a hole with spin at site in the Ni , or O orbital. The electron-electron interactions include the Ni-site() repulsions and the O-site() repulsions for , as well as the Hund interaction at the same Ni site to account for the high spin situation.(The interplay of the two orbitals can also lead to effects such as pseudo Jahn-Teller distortions. These are not our main focus here but will be mentioned briefly below). The nearest-neighbour Ni-O interaction is also included. For the lattice terms, we study only the motion of O ions along the Ni-O bonds—other oxygen(or Ni) distortion modes can be readily included in this approach if necessary. For the electron-lattice interaction, we consider that the nearest-neighbour Ni-O hopping is modified linearly by the O-ion displacement as , where the +(-) applies if the bond shrinks(or stretches) with positive . The Ni-site energy is assumed to be modified by the O-ion displacements as , where the sum runs over the four surrounding O ions.(Other electron-lattice couplings, including oxygen buckling, can be readily included in the present formalism). Other electronic terms are O-O hopping() for , O-site energy () for , with . We emphasize that, due to the large spin at a nickel site, Hund’s rule leads to a ferromagnetic exchange coupling , and , with the Pauli matrix.
It is known that for the nickelate oxides the e-l coupling is stronger than in cuprates oxides[7, 8], and is therefore likely to play an even more decisive role in the formation and nature of stripe phases. Complementary to recent studies on the 2D 3-band Peierls-Hubbard model in various parameter regimes[23], in this paper we concentrate on the variation of the stripe phase with respect to the e-l coupling constants in model (1). We adopt the following representative parameters for the nickelate materials[7]: , and (all in unit of ). In real materials[7, 25], is in the range 1.3eV1.5eV. Detailed analysis of the Ni-centered and the O-centered stripe phases we obtained, as well as their sensitivity to some of the parameters, will be discussed in the next section.
To emphasize that different kinds of stripes have individual spectroscopic signatures, we also consider the linear spin, charge and lattice fluctuations around the mean-field states: an O-centered stripe state and a Ni-centered stripe state[23]. As the electron-hole and the phonon excitations are all included, it is very convenient to calculate various physical properties through an RPA approach; this also serves as a local stability test of the mean-field states.
III Ni-centered and O-centered stripes
The inhomogeneous HF states are obtained as solutions of self-consistent nonlinear equations without a priori assumption of the spin, charge and lattice configurations. As shown previously [7, 23], adding holes in an undoped antiferromagnetically ordered system leads to a strong positive feedback: the domain wall is the result of accumulation of holes; conversely, more localized holes distort the lattice more and hence the system gains energy through a larger lattice distortion, balanced by the cost in electronic energy, around the stripe region. As we will show in the following, this positive feedback is decisive in forming the anti-phase domain walls which divide the whole system into hole-rich striped regions, within which the AF order is suppressed, and hole-poor regions, in which the AF order is maintained. Here we study a 5x5 unit cell system or a smaller 3x3 system for the later RPA calculation. Periodic boundary conditions are used. To emphasize the properties of ideal stripes, we concentrate here on the commensurate hole doping case of 5(3) holes in the 5x5(3x3) unit cell case. Results for other doping situations will be given elsewhere.


Depending on the e-l coupling strength, both oxygen-centered and nickel-centered stripe phases are obtained, as illustrated in Figs.1a and 1b, respectively. The HF energy levels for these two kinds of stripe phases are shown in Figs.2a and 2b(the hole filling is to the 21st level), respectively, and the undoped case(the hole filling is to the 18th level) is shown in Fig.2c, for a smaller 3x3 system, which is for the later comparison with the RPA calculation. When the holes are doped into the system, new localized states appear(as shown in Figs.2a and 2b) within the charge-transfer-gap of the undoped case(shown in Fig.2c). The gap states labelled L1 and L2 for the O-centered stripe phase in Fig.2a are most strongly localized. A similar conclusion can be also drawn for the Ni-centered stripe phase in Fig.2b. From Figs.2a and 2b, we clearly see the superlattice gaps induced by the formation of stripes, as illustrated in Figs.1a and 1b.
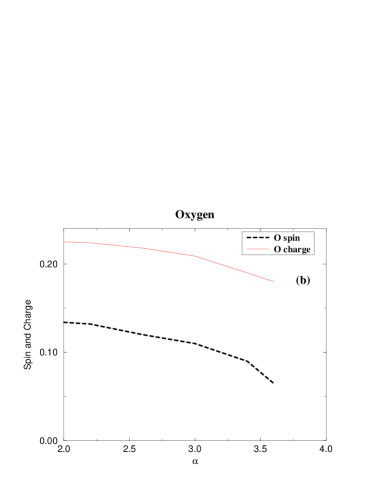
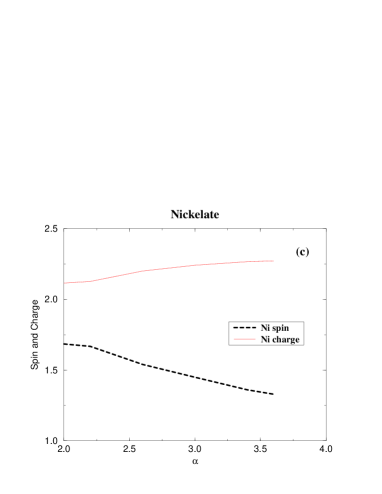
We found that the O-centered stripe phase is energetically favored at weak e-l coupling, while the Ni-centered one is favored at strong e-l coupling. This dependence on the electron-lattice interaction has been established by using a range of initial conditions and confirming local stability through RPA fluctuations. We varied the e-l coupling strength over a wide range. The transition from the O-centered stripe phase to the Ni-centered one is shown in Fig.3a. In the weak coupling region, the O-centered stripe is always found to be more stable than the Ni-centered one. With e-l coupling constant increasing beyond a critical value( with our parameters), the charge of holes on oxygen sites along the stripe begins to decrease and gradually transfer to the neighboring nickel sites. We also find that the spin density on neighboring nickel sites is gradually quenched. After the transition region( for our parameters), the charge and spin features on the neighboring nickel sites display a fully Ni-centered stripe phase. The reason for this transition can be understood by the competition between the energy gained from the electronic kinetic energy and lost from the lattice potential energy, with stronger e-l coupling, the system can gain much more energy through the electronic kinetic energy from the larger lattice distortion; because there are 4 oxygens neighbouring around each nickel site, the Ni-centered stripes are more favored in the strong e-l coupling regime.
As shown in Fig.3a, there is a small energy barrier for the 5x5 system in the transition region between the O-centered stripe phase and the Ni-centered one. For our parameters, this energy barrier is about 10K per unit cell. However, this barrier is a finite size effect; to elucidate this point, we found that in a 7x7 system, the energy barrier is absent, while the general trend and the critical point for the transition from an O-centered stripe to a Ni-centered one is essentially the same.
The average variations of both spin and charge densities on the fully O-centered and fully Ni-centered stripes are presented in Figs.3b and Fig.3c, respectively. Although both the charge and spin along the corresponding O or Ni-centered stripes vary continuously, it is illustrative to define an ”order parameter” which can clearly identify the regimes. Here we define an order parameter as the average difference of spin density on the two nickel sites neighboring the oxygen site belonging to the O-centered stripe:
| (2) |
In Fig. 3d we see that exhibits a rapid crossover in the transition region, as compared to the variations in Fig. 3b, c, and is therefore useful for discriminating between O- and Ni-centered stripes. This is due to the positive feedback localizing charge and lattice distortion, and quenching spin. In the O-centered stripe region added holes are more accumulated along the oxygen stripe, while the spin density on the neighboring nickel sites are quenched, as some holes are also partially distributed on them; the spin density on those sites is smaller than that of other nickel sites far from the stripe, but the difference of the spin density on the two Ni sites adjacent to the O-centered stripe is almost zero. In a Ni-centered stripe, the holes accumulated on the Ni sites at the stripe center quench the spin density, but a large spin density is recovered on neighboring Ni sites.


Some recent experiments[8] suggest that the Ni-centered stripe is more favored at low temperature, while the O-centered one is more favored at higher temperature. We have not included entropic effects in the present calculations which will contribute to the balance of stripe densities. However, as the e-l coupling constant is dependent on both the pressure and temperature, we suggest that a temperature dependent e-l coupling could explain this behavior, because the elastic constant should be stiffer at lower temperatures. We can also expect that a pressure experiment would test the stripe phase dependence on , as the e-l interaction is likely to be even more sensitive to pressure than temperature.
IV signatures of the Ni-centered and O-centered stripe phases
Present neutron scattering experiment on the nickelate oxides do not unambiguously determine whether the stripe phase is Ni-centered or O-centered[19], so it is necessary to predict more observable phenomena to discriminate between these two kinds of stripe. Experiments such as NMR, IR spectra, etc. are attractive candidates to give information on the stripe type. Thus we give the predicted results on: (a) phonon spectra, in which different local modes(IR and Raman) are found to vibrate in the vicinity of the O-centered stripe and the Ni-centered one, respectively; (b) the IR spectra, which further identify the distinct localized features around the different stripe phases for the localized modes, and the corresponding optical absorption spectra on electronic energy scales from the local intra-gap levels; (c) magnetic excitations for both the Ni and O spin, since nuclear quadrupole resonances(NQR) and inelastic neutron experiments can give local information on magnetic excitations; and (d) charge excitation spectra associated with the respective stripes.
A Local phonon modes and the IR spectra
After forming either Ni-centered or O-centered stripe phases, the inhomogeneity of the systems suggests that local phonon modes may be self-consistently induced as a result of the locally renormalized spring-constants [23], which is calculated using the renormalized spring-constant matrix(for e.g., see Appendix H in Ref.[23]). This is indeed the case. The phonon dispersions calculated for the stripe phases are illustrated in Fig.4a for O-centered and Fig.5a for Ni-centered stripe phases. In both cases, the phonon modes are strongly softened due to the lattice distortions, around the stripes induced by the e-l interaction. When the e-l interaction is present, local phonon bands form for both O-centered and Ni-centered stripes. It is clearly seen that more localized and softened phonons are found in the Ni-centered stripe phase, as this needs stronger e-l interaction.


With our parameters, the lowest phonon modes for the O-centered stripe phase with for a 5x5 system is 481.7cm-1, and the corresponding lowest phonon mode for the Ni-centered stripe phase when is 426.5cm-1. These two lowest modes and the associated eigenvectors for the two respective stripe phase are illustrated in Figs.4b and 5b. The arrows represent the oxygen displacement patterns, and the length of the arrows is proportional to the amplitude of the vibrational modes. We see that these lowest phonon modes are localized around the O-centered stripes or the Ni-centered stripes, respectively. The localized phonon modes and their corresponding distortions in the vicinity of stripes suggest observable signatures in an IR absorption experiment.


In Fig.6a and Fig.6b, the IR spectra are plotted for an O-centered and a Ni-centered stripe, respectively, for a small 3x3 system.(The RPA calculation needs large memory, so we use a smaller system). The three infrared peaks in Fig.6a arise from the one distinct localized mode at , and other less localized modes with frequencies and . The lowest phonon mode corresponding to the first peak and its lattice vibration pattern are clear in Fig.4b, which illustrates the localized character around the corresponding O-centered stripe. The other two peaks corresponding to the two less localized phonon modes also confine the lattice vibrations mainly around the stripe phase. The three peaks in Fig.6b for the Ni-centered stripe phase come from three localized phonon modes at , and , respectively. The stronger electron-lattice interaction in the Ni-centered stripe phase results in the more strongly localized nature of these phonon modes. Fig.5b illustrates the character of the localized phonon modes in this case. We emphasize that, since the Ni-centered stripe phase is favored in the strong e-l coupling region, they will be accompanied by lower frequency and more localized phonon modes.
As there are two orbitals(, ) on each nickel site, local defects induced by orbital mixing can have effects in our finite system. We find that the hole occupation of the two orbitals is quite different along the stripe, especially in two corners in Fig.1b and Fig.5b. To emphasize the finite size effect by the orbital mixing, we explored the larger 7x7 system and find this effect is much reduced, especially around the two corners along the stripe. This orbital mixing effect is not our focus in this paper, and the main physics we are interested here is not sensitive to it. Details on orbital mixing will be reported elsewhere.
The optical absorption spectra for both of these two stripe phases and the undoped case are illustrated in Figs. 7a, 7b and 7c on the electronic energy scale. The peaks correspond to many electron-hole excitations from the filled bands to unfilled bands, respectively. There are additional localized phonon modes around the stripes which are raman active. It would be important to excite these in resonant raman studies by tuning into the electronic gap states(Fig.2 ) associated with the corresponding stripes. Such excitation profiles would provide very strong correlations between high- and low-energy characteristics of specific stripes[26, 21].
B Magnetic and Charge Excitation spectra
Since NMR and NQR experiments can accurately probe local magnetic excitation, we have also calculated the RPA magnetic(as well as charge) excitations for both the Ni and the O sites. As will be shown below, the spectral weight of the magnetic excitations again contains specific features characteristic of the stripes.
The spectral weight for particle-hole and phonon excitations is given by the imaginary part of the two body Green’s function in each channel, :
| (3) |
Here is the operator whose spectral weight we wish to obtain. For magnetic excitations, we assign as the transverse components of the spin
| (4) |
with , and standing for the Pauli spin matrix. For the amplitude of charge, we can assign a corresponding operator[23]. Here is the number of NiO2 units.


The magnetic excitations for all the nickel sites in an O-centered stripe phase are illustrated in Figs.8a, 8b, and 8c. Fig.8a represents the sum over all the momenta , and can be compared to NMR experiments. Fig.8b and Fig.8c correspond to the spectral weight of magnetic excitation on Ni sites at specific momenta, here for Fig.8b and for Fig.8c. This information is accessible to magnetic inelastic neutron scattering. Five distinct peaks appear at and , of which have large amplitudes. Detailed analysis of the origins of these two peaks reveals very specific localized stripe information. For the peak, the RPA wave function corresponds to electron-hole excitation of the localized state in the charge transfer gap of the corresponding undoped system. By checking the wave function of the two localized electronic states, labelled as L1 and L2 in Fig.2a, we find that both electronic states are localized around the stripe: i.e., the distribution of the wavefunction amplitude is mainly around the stripe sites. Excitation between the two localized states represents local spin-flips of some oxygens on the O-centered stripe. Thus the new low-lying magnetic excitations clearly reflect information localized around the stripe. A similar conclusion is obtained for the second largest peak .


For the magnetic excitations of the nickel sites in the Ni-centered stripe phase, the spectral weight is represented in Figs.9a, 9b, and 9c, respectively. Similar to the O-centered case, Fig.9a is the sum over all the momenta and can be compared to an NMR experiment, while Figs.9b and 9c correspond to momenta at and . Five peaks are found: at and . Here we see a distinct difference between the Ni-centered stripe phase and the O-centered one: only one main peak with large amplitude appears, at . This peak again reflects information localized around the Ni-centered stripe. By checking the wavefunction of the main excitation between the two localized electronic states, which are mainly localized around the Ni-centered stripe, the magnetic excitation in this case is found to come from spin-flips of the oxygens neighboring the Ni-centered stripe. This is different from the O-centered case above. Thus both of the magnetic excitation spectra are characteristic of their corresponding stripes, and give distinct features, which we expect to be observable in NMR, NQR or inelastic neutron scattering experiments. For reference, we present results for the undoped case in Fig.10. Here, the peak at corresponds to the electron-hole excitation across the charge-transfer-gap. It is clearly seen that the intragap electronic levels for the stripe phases induce additional peaks, as illustrated in Figs. 8 and 9.


In Figs.11a, 11b, 11c, we also illustrate results for the magnetic excitation spectra of the oxygen sites for an O-centered stripe phase, Ni-centered stripe phase and undoped case, respectively. Due to the small spin on oxygen sites, the amplitude is smaller than the corresponding signatures for the magnetic excitations on nickel sites. The amplitude for charge excitations on nickel sites are shown in Figs.12a and Fig.12b for the O-centered and Ni-centered stripe phases, respectively. As anticipated, the strength of these signatures is weaker than the magnetic excitations on the oxygen for the two kinds of stripe phases. This demonstrates the more localized character of the added holes on an O-centered or Ni-centered stripe, as the main feature of a stripe is charge localization along the stripe, dividing the whole system into hole-rich and hole-poor regions.
V Conclusion
In summary, we have studied nickel-centered and the oxygen-centered stripe phases, recently suggested in doped nickelate oxides, including both e-e and e-l interactions in a model of a single NiO2 plane. A transition from an O-centered stripe phase to a Ni-centered one is found, as a function of the e-l interaction strength. Due to the difficulty of neutron experiments unambiguously distinguishing specific stripe types, we have provided predictions of additional observable signatures which may be accessible to experiments: localized phonon modes, IR spectra, and the spectra for various charge and spin excitations, as well as the electronic optical absorption. These show novel and distinct features in the vicinity of the respective stripes. NMR or NQR experiments, together with inelastic neutron scattering, are very promising for verifying our predicted signatures and can give clear local information. Likewise, resonant raman excitation profiles would be extremely valuable for confirming relationships between low- and high-energy signatures of stripes[21]. Charge localization into mesoscale stripe patterns is of central interest in strongly coupled spin-charge-lattice materials. Thus, the discrimination between stripe types will be of great value for understanding charge localization and ordering mechanisms in nickelates and related complex electronic materials, such as cuprate and manganese oxides. We expect that the observable signatures we have predicted can help to focus a coordinated set of experiments to identify specific stripe phases.
Acknowledgments
We have benefitted from valuable discussions with P. C. Hammel, Y. Yoshinari and J. Zaanen. This work was supported by the U. S. Department of Energy.
REFERENCES
- [1] C. H. Chen, S.-W. Cheong and A. S. Cooper, Phys. Rev. Lett. 71, 2461 (1993).
- [2] S.-W. Cheong et al., Phys. Rev. B 49, 7088 (1994).
- [3] J. M. Tranquada, D. J. Buttrey, V. Sachan, and J. E. Lorenzo, Phys. Rev. Lett. 73, 1003 (1994).
- [4] J. M. Tranquada, D. J. Buttrey and V. Sachan, Phys. Rev. B 54, 12318 (1996).
- [5] K. Nakajima et al., J. Phys. Soc. Jpn. 66, 809 (1997).
- [6] J. M. Tranquada et al., Nature(London) 375, 561 (1995); J. M. Tranquada, J. D. Axe, N. Ichikawa, A. R. Moodenbaugh, Y. Nakamura, and S. Uchida, Phys. Rev. lett. 78, 338 (1997).
- [7] J. Zaanen and P. B. Littlewood, Phy. Rev. B, 50, 7222 (1994).
- [8] P. Wochner, J. M. Tranquada, D. J. Buttrey and V. Sachan, Phys. Rev. B (in press).
- [9] A. Bianconi, et al., Phys. Rev. Lett. 76, 3412 (1996).
- [10] J. Zaanen and O. Gunnarsson, Phys. Rev. B, 40, 7391 (1989); D. Poilblanc and T. M. Rice, Phys. Rev. B, 39, 9749 (1989); H. J. Schulz, J. Physique, 50, 2833 (1989); K. Machida, Physica C 158, 192 (1989); K. Kata, K. Machida, H. Nakanishi and Fujita, J. Phys. Soc. Jpn, 59, 1047 (1990); J. A. Verges et al., Phys. Rev. B, 43, 6099 (1991); M. Inui and P. B. Littlewood, Phys. Rev. B 44, 4415 (1991); J. Zaanen and A. M. Oles, Ann. Physik 5, 224 (1996).
- [11] V. J. Emery and S. A. Kivelson, Physica C 209, 597 (1993).
- [12] V. J. Emery and S. A. Kivelson, Nature(London) 374, 434 (1995).
- [13] A. H. Castro Neto and D. Hone, Phys. Rev. Lett. 76, 2165 (1996).
- [14] Yu. A. Krotov, D. H. Lee, and A. V. Balatsky, Phys. Rev. B, 56, 8367 (1997).
- [15] J. Zaanen, M. L. Horbach, and W. van Saarloos, Phys. Rev. B, 53, 8671 (1996).
- [16] A. P. Ramirez, J. Phys.: Condens. Matter, 9, 8171(1997).
- [17] V. Sachan, et al., Phys. Rev. B, 54, 12318 (1996).
- [18] S.-H. Lee and S-W. Cheong, Phys. Rev. Lett. 79, 2514 (1997).
- [19] J. M. Tranquada, P. Wochner, A. R. Moodenbaugh, and D. J. Buttrey, Phys. Rev. B, 55, R6113 (1997).
- [20] S. R. White and D. J. Scalapino, preprint, (1997); S. R. White and D. J. Scalapino, Phys. Rev. B, 55, R14701(1997).
- [21] I. Batistic and A. R. Bishop, Phys. Rev. B, 45, 5282(1992).
- [22] K. Yonemitsu, A. R. Bishop, and J. Lorenzana, Phys. Rev. Lett. 69, 965 (1992).
- [23] K. Yonemitsu, A. R. Bishop, and J. Lorenzana, Phys. Rev. B, 47, 12059 (1993).
- [24] J. Zaanen, LANL preprint library, cond-mat/9711009 (1997).
- [25] J. van Elp, H. Eskes, P. Kuiper, and G. A. Sawatzky, Phys. Rev. B, 45, 1612 (1992).
- [26] G. Blumberg, M. V. Klein, and S-W. Cheong, Phys. Rev. Lett.(to appear), cond-mat/9711139.