Rare earth contributions to the X-ray magnetic circular dichroism at the Co K edge in rare earth-cobalt compounds investigated by multiple-scattering calculations
Abstract
The X-ray magnetic circular dichroism (XMCD) has been measured at the Co K edge in hcp-Co and R-Co compounds (R=La, Tb, Dy). The structure of the experimental XMCD spectra in the near-edge region has been observed to be highly sensitive to the magnetic environment of the absorbing site. Calculations of the XMCD have been carried out at the Co K edge in Co metal, LaCo5 and TbCo5 within the multiple-scattering framework including the spin-orbit coupling. In the three systems, the XMCD spectra in the near-edge region are well reproduced. The possibility to separate the local effects from those due to the neighboring atoms in the XMCD cross section makes possible a more physical understanding of the spectra. The present results emphasize the major role played by the states of the Tb ions in the XMCD spectrum at the Co K edge in the TbCo5 compound.
I introduction
The X-ray magnetic circular dichroism (XMCD) is now well established as a selective probe of the magnetic properties even in complex systems. XMCD can yield local quantitative information through a wide range of powerful calculation techniques. For instance within the multiplet framework, the XMCD spectra at the L2,3 transition metal (TM) and M4,5 rare earth (R) edges can be accurately reproduced [2]. It allows one to evaluate the local transition metal 3 and rare earth 4 magnetic moments. Moreover, the sum rules [3, 4] can provide, in favorable cases, a separate determination of both orbital and spin magnetic moments. However these atomic approaches fail at the TM K edge, where the excited electron is promoted to the delocalized states.
For final delocalized band states, the scattering processes encountered by the photoelectron can be treated in a one-electron picture within the multiple-scattering framework. This theory was first applied to the calculation of the x-ray absorption spectra, and recently it has been implemented to calculate the XMCD spectra, in particular at the transition metal K edge. Since the XMCD arises from the interplay between the spin-polarization and the spin-orbit coupling, these effects have to be included in the model. Ebert et al. [5, 6, 7] used a fully relativistic multiple-scattering formalism and obtained good results in the near-edge region. This formalism was recently extended to the EXAFS range [8]. On the other hand Ankudinov and Rehr, using a multiple-scattering approach where the scattering by the atomic sites is fully relativistic and the propagation between sites is non-relativistic, calculated the extended structure in XMCD at the L2,3 edges of Gd in good agreement with experiments [9]. However, in this case, the edge region was not well reproduced. More recently we performed calculations including both the near-edge and EXAFS regions in the same multiple-scattering formalism with application to the Fe K edge [10]. We showed that the spin-polarization of the -states of the neighboring ions highly contributes to the signal structure and accounts for the first positive peak in the Fe XMCD spectrum. This contribution arises from the scattering of the photoelectron due to the spin-orbit potential of the neighbors and the absorber. The role of the spin-orbit interaction of the 3 states on the neighboring sites was also reported by Igarashi and Hirai [11, 12] using tight-binding calculations, and later on by Guo within an itinerant electronic model [13]. These authors showed that the XMCD at the TM K edge in Fe and Ni is determined by the orbital moment on the 3 states through the - hybridization. By including the Coulomb interaction between the 3 electrons, the XMCD spectra seem to be quite well reproduced.
If these techniques now offer a reasonable description of the dichroic spectrum in pure metals, the interpretation of the XMCD at the TM K edge in rare earth-transition metal compounds is still open. In particular, the XMCD signal in the near-edge region may present very different features with respect to the allied rare earth. Recent experiments performed at the Fe K edge in R2Fe14B compounds were analyzed considering the XMCD spectra as the addition of the magnetic contributions of both Fe and R sublattices [14]. It was proposed that Fe K edge XMCD is induced by the splitting of the 5 band, due to the exchange interaction with the 4 states, through the - hybridization.
In the course of our studies at the L2,3 rare earth edges in GdNi5
and TbNi5 [15], non negligible XMCD signals compared to Ni
metal have been observed at the Ni K edge whereas Ni does not satisfy the
Stoner criterion in the RNi5 compounds [16]. These results
give information on the rare earth influence on the dichroic spectra of the
K edge of Ni. However, the understanding of the XMCD at the K edge of the
transition metal in R-TM intermetallics is far from being achieved and a
better description of the rare earth role has yet to be given.
In this paper we report a comparative study of the Co K edge XMCD spectra between Co metal and RCox metallic alloys with magnetic and non magnetic rare earth. In most of these compounds, the Co has a strong magnetic moment, in the RCo5 compounds for instance, it is comparable to that of Co metal. The choice of different rare earths allows us to observe the sensitivity of the XMCD spectrum to the magnetic and chemical environment of the absorbing site. For Co metal, LaCo5 and TbCo5, calculations of the XMCD signal have been carried out within the multiple-scattering model using a semi-relativistic approach [10]. These calculations require the knowledge of the atomic potential which was obtained within the local density approximation using the linear muffin-tin orbital (LMTO) basis-set within the atomic sphere approximation and including the so called combined correction term [17].
The second section of the present paper deals with the XMCD experimental results observed at the Co K edge in Co metal and various R-Co compounds. The third section presents the calculations of the crystal potentials by means of the linear muffin-tin orbital method within the local-density approximation, and the multiple-scattering calculations of the x-ray absorption and the dichroic signal of Co metal, LaCo5 and TbCo5. The last section summarizes and concludes our paper.
II experimental results
A samples properties
Like most of the rare earth-transition metal binary alloys, the R-Co phase diagrams present a large number of well-defined compounds. The different crystallographic structures of these compounds are based on the CaCu5-like hexagonal lattice including simple R or Co atom substitutions along with layers shifts. The magnetism of the rare earth-transition metal systems has been extensively studied in the past two decades (see for instance Refs. [18, 19]). It relies on a combination of 4 localized and 3 itinerant magnetism giving rise to a wide range of magnetic properties, some of them well suited for technical applications. The band structure of the R-TM metallic alloys is characterized by the hybridization of the 3 and 5 bands [20, 21]. The hybridization leads to a ferromagnetic coupling between 4 and 3 moments in light rare earth compounds and ferrimagnetic in heavy rare earth compounds [22, 23]. The hybridized states are located at the top of the 3 band and at the bottom of the 5 band. The Fermi level lies in this region where the density of states varies strongly. Starting from the pure 3 metal, the progressive introduction of the rare earth induces a decrease in the 3 magnetism and for given concentrations the Stoner criterion is no more satisfied. The critical concentration for the onset of the 3 magnetism is RNi5 for the nickel-based alloys whereas it corresponds to RCo2 for the RCox compounds.
The RCo2 compounds crystallize in the MgCu2-type cubic structure (Laves phases). In YCo2 and LuCo2, Co is non magnetic whereas in compounds with magnetic rare earths the Co moment of about 1 , is induced by exchange interactions between 3 and 4 spins. The Curie temperature reaches a maximal value of 395 K in GdCo2 and rapidly decreases with the spin value of the rare earth. On the contrary, in the RCo5 compounds (CaCu5-like structure) the Co moment, as deduced from magnetization studies, is approximately 1.64 and the strong Co-Co exchange interaction leads to very high Curie temperatures (TC 950 K). The extremely large Co anisotropy favors the axis and competes with that of the rare earth. For instance in TbCo5, a spin reorientation from the basal plane to the axis above 440 K is observed [24]. In the solid solutions R(NiCox)5, which also crystallize in the CaCu5 structure, the Co magnetic moment for high values is comparable to that in the RCo5 compounds. The Curie temperatures then progressively decrease when substituting Co by non magnetic Ni ions.
The XMCD measurements at the Co K edge have been performed in LaCo5, TbCo5, Dy(Ni0.2Co0.8)5 and TbCo2. Their crystallographic structures and magnetic properties are reported in table I. Table II gives the equivalent positions with their coordinates and the point symmetry group for the CaCu5-type hexagonal structure. All these compounds were prepared at the Laboratoire de Magnétisme Louis-Néel, by RF-melting in a cold crucible from the stoichiometric proportions of pure elements. In order to minimize oxidation, the melting was performed under neutral Argon atmosphere. For transmission mode XMCD experiments, the samples were then crushed into powder and layered onto a thin Kapton foil. The powders were previously analyzed by X-ray diffraction using a Debye-Scherrer method. The Co sample consists in a thin metallic foil.
B XMCD measurements
The XMCD measurements were carried out at LURE, on the energy dispersive beam-line D11 [25]. The polychromator consists of a curved Si(111) crystal which focuses the X-ray beam in the middle of the electromagnet poles. Higher harmonics are rejected by a SiO2 plane mirror located downstream of the photodiode array detector. Right circularly polarized X-ray beam is selected by 1 mm-wide slits positioned 3 mrad below the orbit plane. The circular polarization rate of the incoming radiation is estimated at . The XMCD spectra are recorded in transmission mode by selecting one polarization and reversing the magnetic field, applied along the photon propagation direction. The applied magnetic field intensity is about 0.4 T. The samples are oriented so that the magnetic field is applied perpendicular to the plane of the sample. For low temperature measurements (down to 10 K), the sample can be mounted in a helium cryogenerator inserted between the electromagnet poles. The spectra have been measured at room temperature in Co metal, LaCo5 and TbCo5 and at 10 K in TbCo2 and Dy(Ni0.2Co0.8)5.
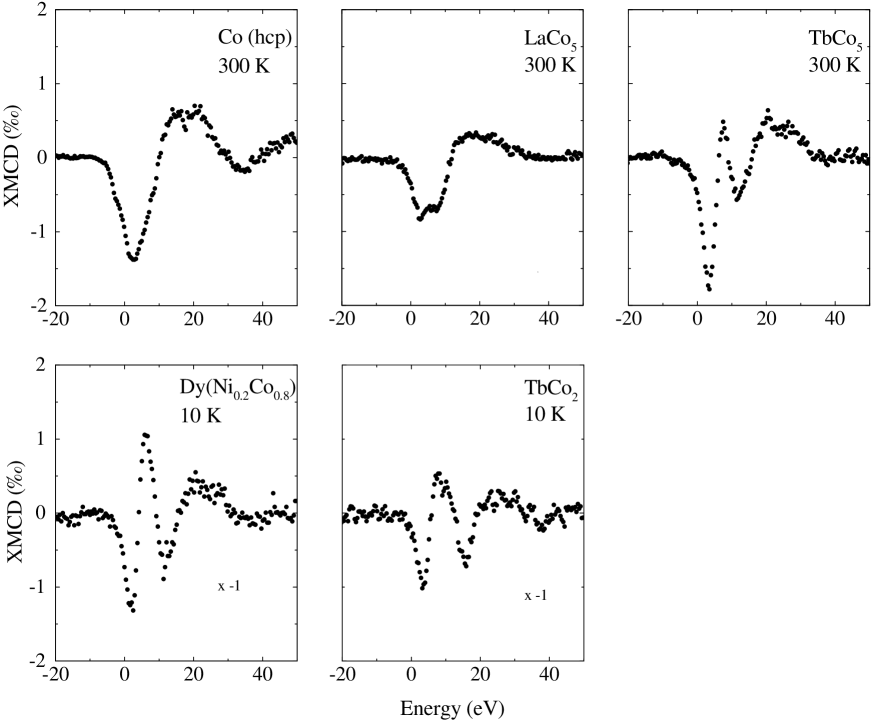
The XMCD spectra at the Co K edge are presented on figure 1 for Co metal, LaCo5 and TbCo5 along with other R-Co compounds. The origin of the energy scale has been chosen at the inflexion point of the absorption edge. All XMCD spectra have been normalized to the edge jump of the absorption edge. In TbCo2 and in Dy(Ni0.2Co0.8)5 at 10 K (Tcomp), the magnetization of the Co sublattice is smaller than the magnetization of the rare earth sublattice and antiferromagnetically coupled with it, giving rise to a reverse XMCD signal with respect to Co metal or LaCo5 and TbCo5 compounds. In order to keep the same sign convention than in Co metal the XMCD spectra of TbCo2 and Dy(Ni0.2Co0.8)5 were multiplied by -1 as indicated on figure 1.
The dichroic signal at the Co K edge in Co metal exhibits a one-peak structure centered about 5 eV above the absorption edge. The full width at half maximum is about 5 eV. The XMCD spectrum of LaCo5, where the rare earth is not magnetic, is close to that of Co metal. It presents a negative one-peak structure at about 5 eV in addition to a weak positive contribution in the middle of the broad negative structure. On the other hand, the XMCD spectra obtained from magnetic R-based compounds strongly contrast with that of Co metal and LaCo5. The dichroic signal consists of a three-peaks structure, two negative and one positive in the middle of the negative ones. The central peak exhibits now a huge amplitude, comparable to that of the negative dips. When switching from an hexagonal-based compound (TbCo5) to its cubic-based counterpart (TbCo2), sizeable changes in the XMCD signal are also observed. The central positive feature in TbCo2 seems of larger amplitude and wider than in TbCo5. At higher energy, all XMCD Co K edge spectra exhibit a positive bump located about 20 eV above the absorption edge, which may be ascribed to magnetic EXAFS.
The behavior of the XMCD signal at the Co K edge in R-Co compounds, with respect to Co metal, clearly shows the R influence on the dichroism. In order to obtain a deeper insight into such a behavior, we performed multiple-scattering calculations at the Co K edge in Co metal, LaCo5 and TbCo5.
III multiple-scattering calculations at the Co K edge
A multiple-scattering approach
The Co K edge XMCD spectra were calculated within the multiple-scattering framework including the spin-orbit coupling. The cross section is calculated from the Dirac-Green function according to Eq. (3) in Ref. [10]. A fully relativistic core-state wave function has been used. The determination of the cross section requires the calculation of the atomic potential which has been carried out within the self-consistent LMTO approach (see section III B). The influence of the relativistic effects, that is the spin-orbit interaction, is obtained by the series expansion of the Dirac-Green function. To zero-th order in we find the absorption cross section in the absence of relativistic effects. The expansion carried out up to second order in provides 5 terms. Only the fourth term of this expansion contributes to XMCD. This term will be denoted as according to the notation in Ref. [10].
In order to take into account the finite core-hole lifetime , the spectra must be convoluted by a Lorentzian with a half width at half maximum (HWHM) . Within the Green function formalism, this convolution is achieved in calculating the Green function for complex energies . We have to consider also the fact that only the transitions into the empty states, located above the Fermi energy, are allowed. Thus, the convolution by the -width Lorentzian must be carried out from EF instead of . We will see later on that the right choice of the Fermi energy is of crucial importance when comparing the calculated spectra to the experimental ones.
The total absorption cross-section can be written as the sum of two contributions according to Eq. (21) in Ref. [10].
| (1) |
where the sum is carried out over the two spin states s. is defined as the atomic contribution to X-ray absorption and stands for the influence of the neighbors surrounding the absorption site. The atomic contribution is the absorption due to an isolated atom, and does not exhibit oscillations. The dichroic cross section defined as is shown to be equal to the sum of three terms :
| (2) |
where describes the purely atomic contribution to XMCD (related to the Fano effect), provides the local contribution due to the spin polarization of the -states on the absorbing site and is the contribution due to the scattering of the photoelectron by the spin-orbit potential of the neighbors and the absorber itself [26]. The , , ,… orbitals of each atom of the cluster give a specific contribution to . The expansion of into orbitals and sites is useful to determine the physical origin of some peaks of the XMCD spectra.
B calculations of the crystal potential
The calculations were carried out at IDRIS (Orsay). The crystal potentials were calculated within the local density approximation using a LMTO basis set. The electronic structure is selfconsistent and the total energy is converged beyond 0.1 mRy. The spin-orbit coupling is not included in the calculations. For the Brillouin zone integration of the density of states we used the tetrahedron method with about 300 -points in the irreducible part of the Brillouin zone (IBZ) [27].
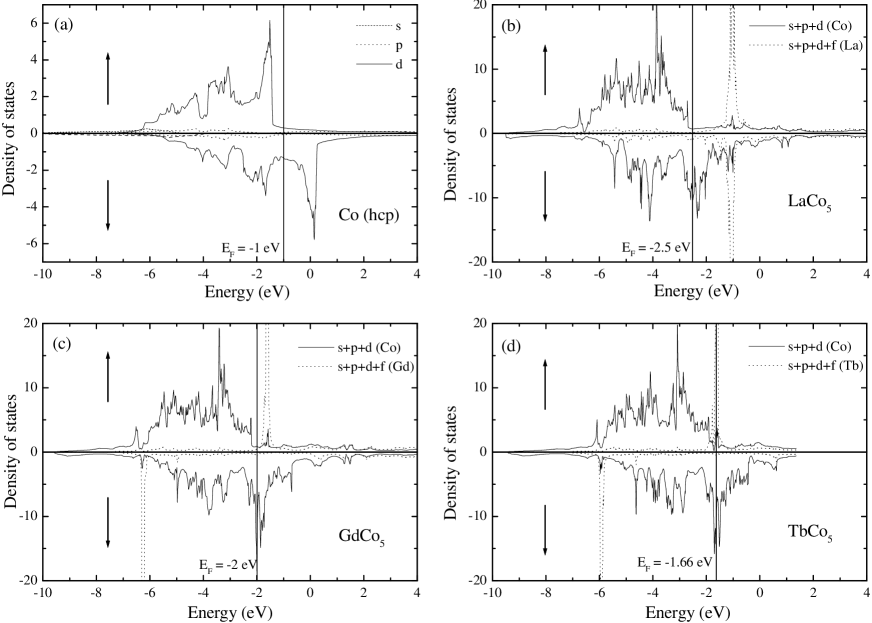
The calculated Co density of states (DOS) is presented on figure 2a. The result is consistent with previous calculations performed by Jarlborg et al. in Co-hcp using the same LMTO formalism [28]. The similarities between the spin and the spin DOS show the rigid band like behavior of Co metal. The calculated Co spin moment 1.57 Co agrees well with the experimental value of about 1.6 . The selfconsistent Fermi level is located at -1 eV.
The calculations on RCo5 class compounds were first performed on GdCo5. While not measured in the present study, this compound serves as a reference for our LMTO calculations of the RCo5. The muffin-tin radii RMT of both Gd and Co were derived from the values given by Yamaguchi and Asano [29] by expanding the radii so that the total volume occupied by the muffin-tin spheres in the unit cell is equal to the volume of the unit cell itself, while keeping the ratio RMT(Gd)/RMT(Co) constant. Under this condition, the muffin-tin spheres on two neighboring sites overlap each other. The R muffin-tin radius in the other RCo5 compounds has been deduced from that of Gd in GdCo5 by scaling the rare earth radius to the volume of the unit cell, keeping the Co muffin-tin radius constant throughout the RCo5 series. The muffin-tin radii used for the calculations are summarized in table III.
Our calculated GdCo5 DOS, presented in figure 2c, is comparable to that of Keller et al. [30], although the energy resolution of the latter is not as accurate as in the present study. The 4 spin moment is coupled antiferromagnetically to the mainly -character moment of the Co conduction band, as expected for rare earth-transition metal alloys. The Fermi energy is located at EF=-2 eV. The calculated spin moments on Co sites, of 1.28 Co and 1.37 Co respectively on 2c and 3g sites, are slightly smaller than those previously reported by Yamaguchi and Asano [29] but agree with a larger moment on the 3g site. The total spin moment calculated on the Gd site is 7.06Gd, this value is also smaller than the values reported in Ref. [29]. The Gd 4 spin moment deduced from our calculations is 6.69 Gd. The reduction of the 4 spin moment compared to the 7 expected for the free ion comes from the (Gd)-(Co) hybridization in the band structure calculation.
Figures 2b and 2d show the calculated DOS of LaCo5 and TbCo5 respectively. For LaCo5 the Fermi energy is located at -2.5 eV. The calculated Co spin moments are 1.33 Co and 1.50 Co on the 2c and 3g sites respectively. A weak moment of 0.4 La is also calculated on the La site, which is mainly due to the 5 states. For TbCo5 the Fermi energy is located at -1.66 eV and the calculated Co moments are 1.37 Co and 1.41 Co on 2c and 3g atomic sites, respectively. The values of the Co moments calculated in LaCo5 and TbCo5 are very consistent with those obtained in GdCo5. The spin moment calculated at the Tb sites is 5.88 Tb. Compared with the moment calculated on the Gd site in GdCo5, this value appears quite coherent. Here also the (Tb)-(Co) hybridization leads to a reduction of the 4 spin moment which reaches 5.63 Tb.
C results of multiple-scattering
The XMCD calculations have been carried out with the numerical program described in Ref. [10]. The converged potential included in the multiple-scattering calculations are those calculated by LMTO. The XMCD program uses touching muffin-tin spheres without overlap. The absence of overlap is required for the multiple-scattering calculations to be convergent. Because of the difference in the muffin-tin radii between LMTO and multiple-scattering potentials, there is an interstitial volume between the spheres in the multiple-scattering calculations. This volume is represented by a muffin-tin potential VI which is calculated as the average potential, in the interstitial region, due to all the charges in the cluster (including the interstitial region). This interstitial potential VI is the energy origin of the multiple-scattering calculations, and has no reason to be the same as the energy origin of the LMTO calculations. This ambiguity can be avoided by using full potential codes that do not make the muffin-tin approximation. However, no such codes are available at the moment for XMCD.
The muffin-tin radii used in the multiple-scattering calculations are presented on table III. For LaCo5 and TbCo5, they have been deduced using the procedure proposed by Yamaguchi and Asano for GdCo5 [29]. Note that the RMT(R)/RMT(Co) ratio has the same value than in LMTO calculations for TbCo5 while it is slightly smaller in LaCo5.
1 Co metal
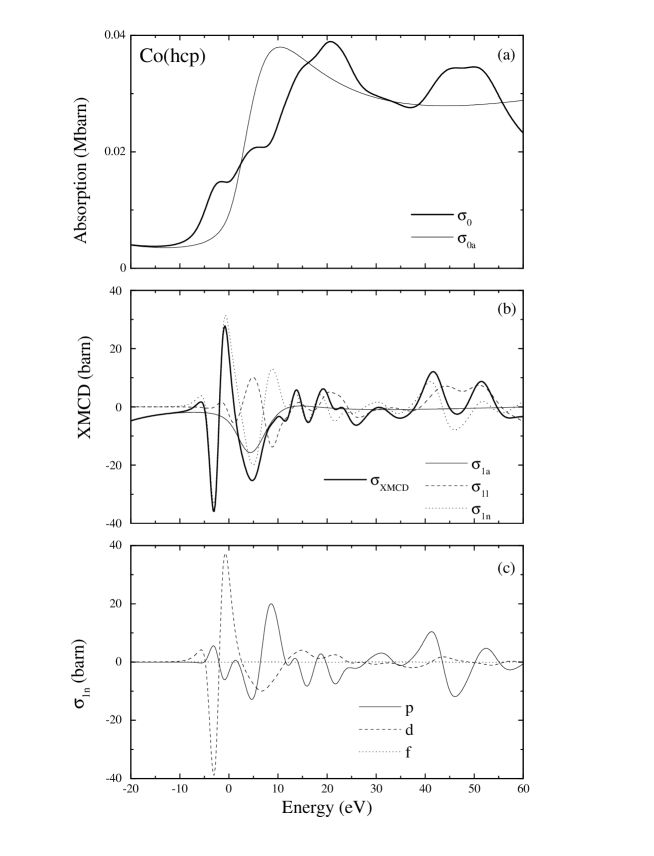
The calculations for hcp Co metal have been performed using a cluster of 105 atoms. The absorption, , and dichroic, , spectra calculated first without introducing the Fermi level are presented in figures 3a and 3b. Figure 3b also presents the contribution of , and to the dichroic cross section. The XMCD spectrum consists in a three-peaks structure near the absorption edge, followed by weak EXAFS oscillations appearing about 10 eV above the edge. The first two peaks in the XMCD spectrum come mainly from the contribution. As aforesaid, this contribution comes from the scattering due to the spin-orbit potential on the neighbors and the absorbing site. Quite similar results have been previously reported at the Fe K edge [10]. The third peak at 5 eV results from the sum of the three contributions, , and which have comparable amplitudes. As we shall see later in LaCo5 and TbCo5, in this energy region and are always in phase opposition with . originates form the polarization of the -states on the absorbing site. The expansion of the cross section into the components and sites of the whole cluster is presented on figure 3c. The scattering due to the spin-orbit potential mainly accounts for the first two peaks in the near-edge region of the XMCD signal. The amplitude of the oscillations due to the scattering by the spin-orbit potential on the orbitals starts to significantly increase above the edge and a large peak is calculated around 8 eV. The negative peak around 5 eV in the cross section results from the well balanced contributions of the and orbitals.
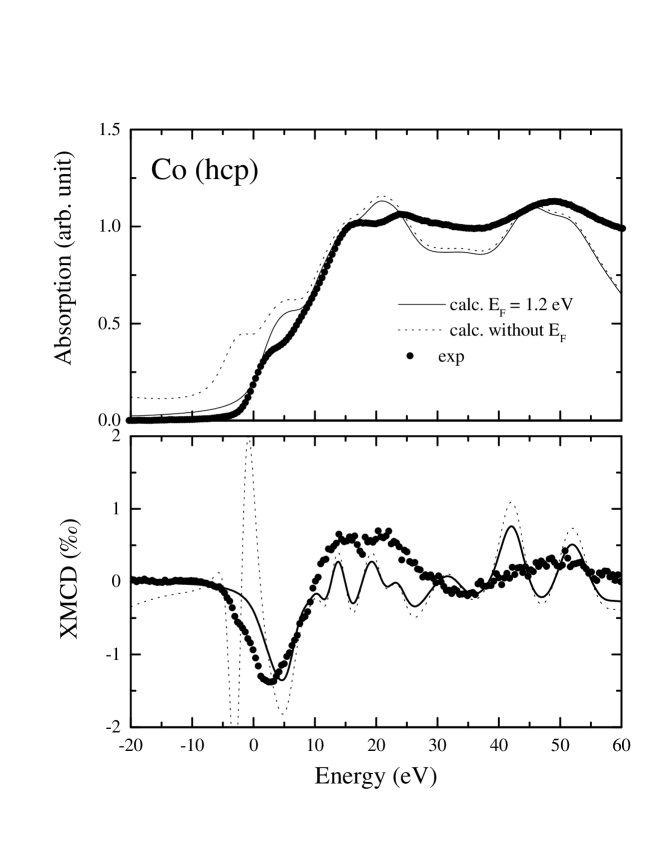
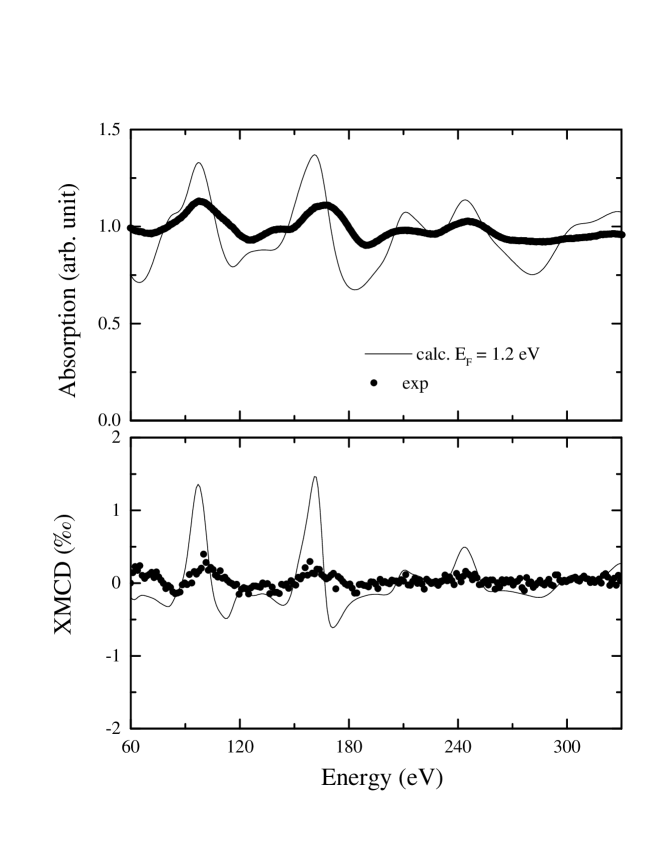
In order to compare the calculated spectra to the experimental ones, the Fermi energy has to be included. In figure 4 the absorption and dichroic experimental spectra are presented along with the calculated ones with and without introducing the Fermi energy. Absorption and XMCD spectra are all normalized to the edge jump at the absorption edge so that the absorption edge jump is 1. The Fermi energy was chosen at 1.2 eV by fitting both the absorption and the XMCD spectra to the experimental ones in the near-edge region. The Fermi energy of the multiple-scattering calculations is not the same as that of the LMTO calculations because of the difference in the energy origin between the two approaches. The effect of the Fermi energy clearly shows up, especially for the XMCD spectrum : the first two peaks have vanished and only subsists the negative peak around 5 eV. The XMCD spectrum is broadened around EF as expected from the truncated Lorentzian convolution. It may be noticed that in Ref. [10], the XMCD spectrum calculated at the K edge in Fe metal with EF=0 eV keeps a positive peak at low energy, mainly coming from the contribution, which fits well the derivative-like behavior of the measured XMCD spectrum. The higher Fermi level found in Co metal leads to the collapse of this second peaks in the near-edge region of the Co K edge XMCD spectrum. It is worth noting that a higher Fermi level in Co metal is coherent with the higher occupancy of the Co band () compared to Fe ().
In the near edge region the calculation reproduces rather well the structure of the absorption and XMCD experimental spectra. The calculated spectra present a slight shift to the high energies. This shift is very likely due to the difficulty to properly fit in the energy between calculated and experimental spectra. For the XMCD spectrum the calculation yields the expected one-peak feature with however a narrower width than the experimental one. In the region between 10 eV and 30 eV the calculated oscillations are not resolved in the experimental spectrum, where only a large bump is observed. The extended energy spectra are presented on figure 5. The slight shift in energy of the EXAFS oscillations is again noticed between experiment and calculation in both the absorption and the XMCD spectra. Though the EXAFS structures are strongly damped in the measured spectra, the agreement between experiment and calculation remains rather satisfactory. The agreement in the intensity of the calculated and experimental peak around 5 eV is very likely fortuitous. Indeed in the calculation the degree of circular polarization is set equal to 1, while experimentally the polarization rate of the incoming beam, estimated at 0.65, reduces the signal intensity. This is confirmed in the energy range 10-30 eV where the intensity of the calculated oscillations is to small to account for the bump observed experimentally. Consequently it turns out that in the high energy region the calculated amplitude of the oscillations is always overestimated, in the dichroic spectrum but also in the absorption one. These effects might be related to a current limitation of the XMCD program which does not include the inelastic scattering processes undergone by the photoelectron in the metal.
2 RCo5
The multiple-scattering calculations in the LaCo5 and TbCo5 compounds have been carried out on a 117 atoms cluster for each Co atomic site. The total spectrum results from the weighted sum of the spectrum on each site with respect to its multiplicity in the unit cell. Calculations have been performed only in the near edge energy domain since the extended structures are poorly resolved in the absorption and dichroic experimental spectra.
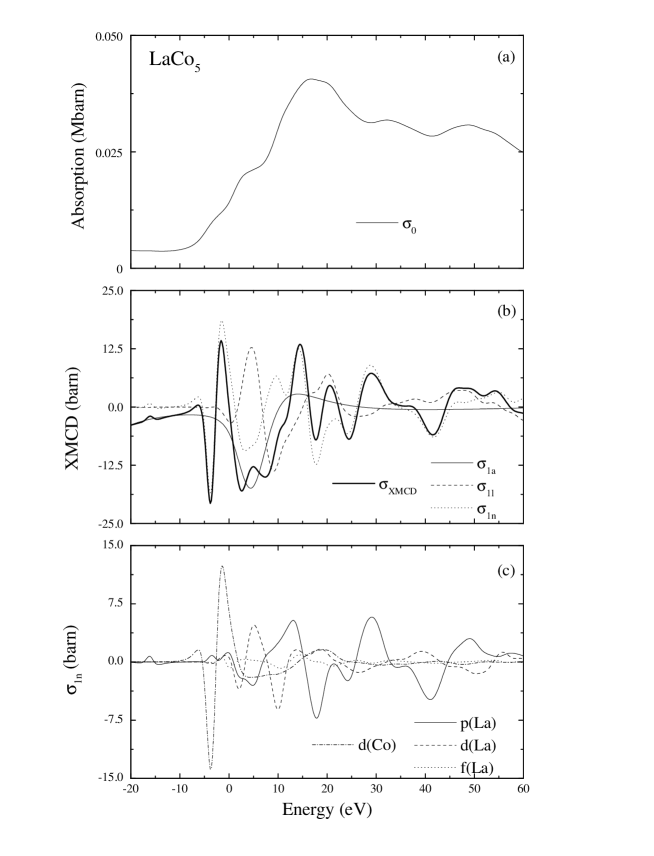
The absorption and dichroic spectra calculated without the Fermi level for LaCo5 are presented on figures 6a and 6b. The different components, , and , to the XMCD cross section are also shown. In the energy region -10 to 0 eV, the contribution is responsible for the first two peaks as already observed in Co metal. Around the third negative peak at 5 eV, the and contributions are comparable to those calculated in Co metal whereas is reduced by more than a factor 2. The reduction of and the phase opposition between , and give rise to the positive cusp located in the middle of the negative peak, characteristic of the LaCo5 XMCD spectrum (cf. fig. 7). Figure 6c presents the contribution to the cross section of the , and shells of the La first neighbors and of the shell of the Co first neighbors. In the near-edge region and just above the edge, is dominated by the scattering processes due to the contribution of Co and La. The peculiar decrease of the total cross section around 5 eV comes from the existence of a positive peak in the La orbital component, while the Co and La components give rise to negative structures. At higher energies features on come essentially from the La shell contribution.
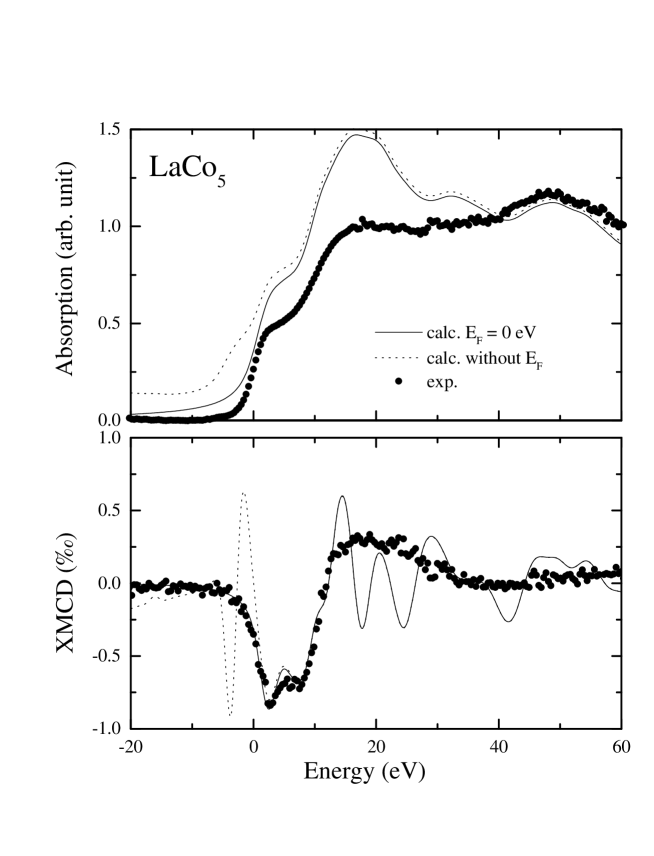
The normalized absorption and XMCD cross sections calculated with a
Fermi energy of 0 eV are compared on figure 7 with the
experimental spectra. The calculated dichroic spectrum was divided by an
arbitrary factor in order to fit the experimental one. Besides the reduction
of the signal due to the circular polarization rate, this correction
accounts for the fact that the magnetic saturation of the powdered sample
of LaCo5 is not reached under an applied field of 0.4 T. The agreement
for the absorption spectrum is far from being excellent but the dichroic
signal is well reproduced, especially the structure at 5 eV. It can be
noticed that the total width of the spectrum agrees well with the observed
one. Above 10 eV discrepancies between the calculations and the measured
spectrum are observed, as for Co metal the experimental signal presents a
large bump instead of well resolved structures.
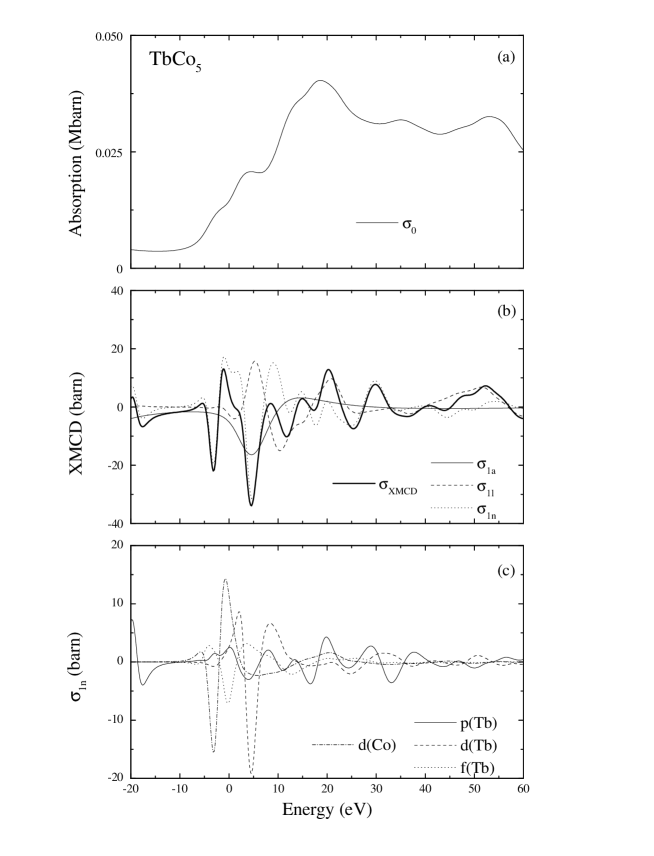
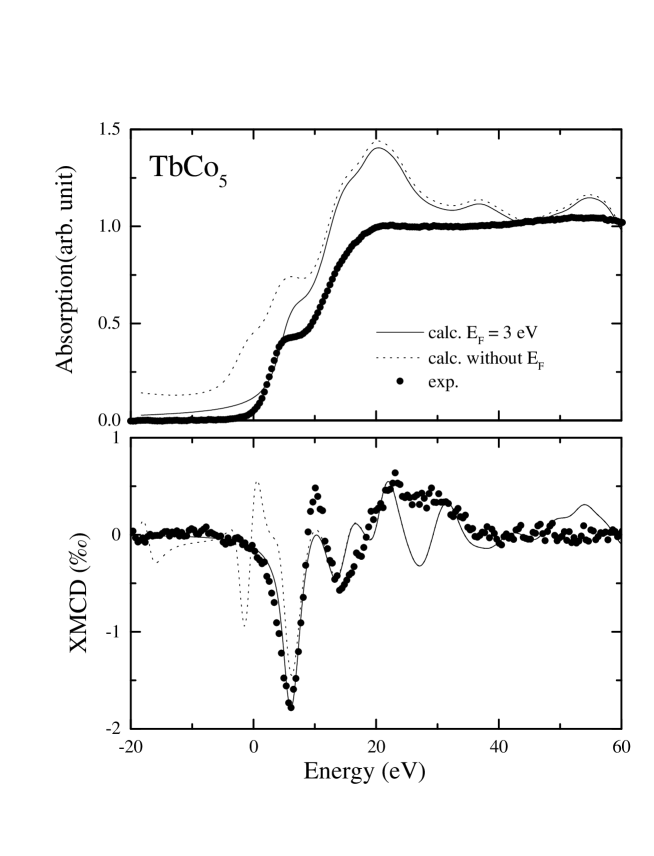
The absorption and XMCD calculated spectra without the Fermi level for TbCo5 are illustrated on figure 8a and 8b. Figure 8b also shows the contributions of , and to the total XMCD cross section. The structures of the XMCD signal in the low energy region arise, as in LaCo5, from . The first negative peak has a structure and an amplitude very similar to those obtained in LaCo5 or Co metal. The second positive peak presents a double structure which results from the mixing of the Co and Tb shell positive contributions and the negative Tb shell contribution as shown in figure 8c. In figure 8c are represented only the contributions to the cross section from the , and shells of the Tb first neighbors and the shell of the Co first neighbors. The addition of the contributions, of smaller intensity, coming from the other atoms of the cluster does not change quantitatively the structure of the spectra. It may be noted that the Tb shell contribution is not negligible in the near edge region. Compared to the LaCo5 XMCD spectra, the third negative peak around 5 eV comes almost exclusively from . In this energy region and having roughly the same amplitude and opposite sign cancel each other. This negative structure can be mainly assigned to the Tb shell contribution. This contribution along with the Tb and contributions, of lower intensity, give rise also to the positive bump in which immediately follows the negative peak. When the Fermi level is included in the calculation, the structures near the absorption edge are smeared out. The calculated spectra which best fit with the experimental ones are obtained with EF=3 eV. Experimental and calculated spectra are presented in figure 9. The calculated absorption spectrum presents structures which are not resolved in the experimental one. The calculated dichroic spectrum was scaled to the experimental one. As for LaCo5, this correction accounts for the non-saturation of the magnetization. The two peaks at 6 and 10 eV in the experimental XMCD spectrum are quite well reproduced by the calculations, in particular their widths. At higher energies, we find incoherences again between the calculation and the measured spectrum.
IV Concluding Remarks
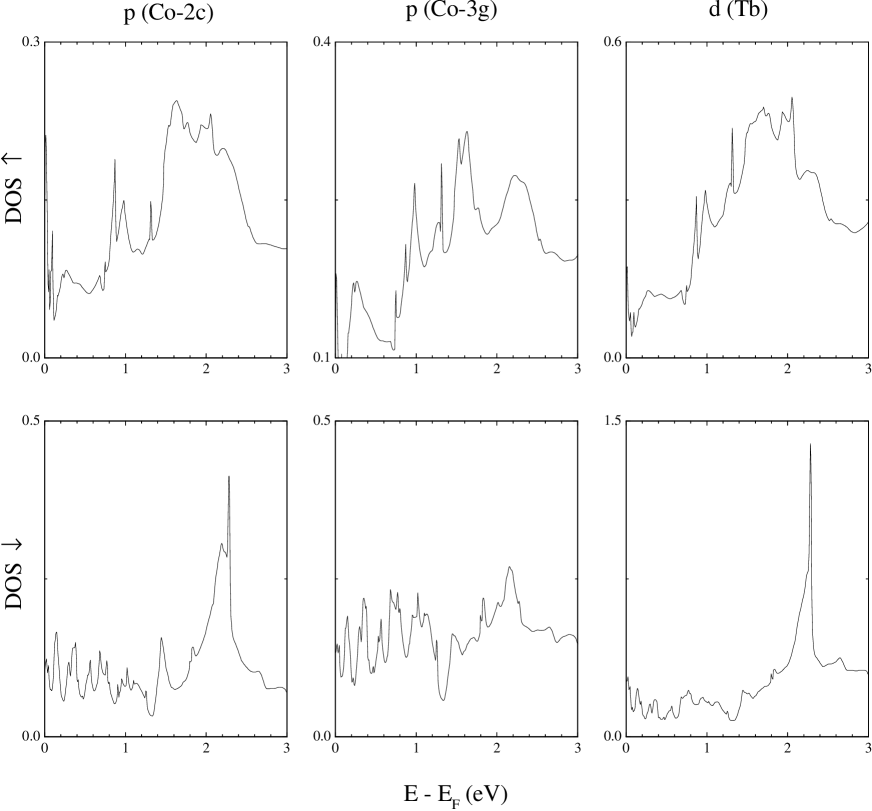
Calculations within the multiple scattering approach of the dichroic signal at the Co K edge in pure Co metal reproduce with a rather good agreement the structures of the experimental spectrum. In particular the one-peak structure near the edge is well accounted for with a Fermi energy of 1.2 eV. The Co K edge spectrum, calculated without the Fermi level presents strong similarities with the Fe K edge spectrum calculated in the same conditions. In the present theoretical approach it is possible to separate the local contributions to the dichroic cross section from those coming from the surrounding atoms. When these contributions are examined it is confirmed that the scattering by the spin-orbit potential of the shell of the neighboring atoms creates strong structures in the low energy range of the spectrum. This is in agreement with Igarashi and Hirai calculations. The local contributions, atomic contribution and contribution due to the spin polarization of the -states, give structures at higher energies typically around 5 eV. However as soon as the Fermi level is introduced in the calculations, low energy structures partially (Fe), or completely (Co), disappear. Present calculations show that the negative structure observed in the Co metal XMCD spectrum at the Co K edge results from a well balanced mixing between local, and , and surrounding, , contribution. It may be noted that, in this energy range, the contributions to , arising from the spin-orbit coupling in the and shells have comparable intensities. The calculated Co K edge XMCD spectra in LaCo5, and TbCo5 reproduce, with an excellent agreement in the near edge region, the structures of the experimental spectra. As for Co metal the signal structure in LaCo5 is accounted for by a balanced mixing between local and surrounding contributions. In this last contribution the rare earth atoms, via the spin-orbit coupling on the La and shells, significantly influence the structure. In the case of TbCo5 the multiple-scattering calculations stress the major role of the contributions due to the neighbors, in the structure of the spectrum around 5 eV. More precisely, the expansion of the cross section into the orbital components allowed us to evidence that the first negative peak in the XMCD spectrum at the Co K edge originates almost exclusively from the spin-orbit potential on the Tb states. This result points out that the structures of the XMCD spectrum at the K edge of the transition metal in the R-TM alloys are induced to a large extent by the rare earth when the rare earth is magnetic. The XMCD at the Co K edge in the R-Co compounds, which probes the empty -states on Co sites, thus detects the spin-orbit interaction on the rare earth -states. This process is very likely mediated through the hybridization. The similarities observed in the density of states above the Fermi level, between the Tb() and the Co()-DOS in TbCo5 (cf. fig. 10) underline the existence of a Co()-R() hybridization. The closer resemblance between Co-2c() and Tb() is related to the shorter distance leading to a larger orbital overlapping between the Co-2c–Tb compared to Co-3g–Tb.
Effects of the environment can be expected to exist at the L2,3 edges of the transition metal as well, like in the RE-TM alloys where the RE(5) and TM(3) band are hybridized. For instance, it is very likely that magnetic EXAFS structure can reflect these effects and recent theoretical investigations on the magnetic EXAFS at the L2,3 edges of pure Fe are very promising [8]. However a proper experimental evidence presents great difficulties as the white lines dominate the spectra at these edges. Moreover, in the soft x-ray energy range, surface defaults which are far from being negligible in the RE-TM alloys may disturb the interpretation of the spectra.
Though the XMCD spectra are quite well reproduced in the near region, a better agreement has yet to be obtained in the EXAFS region both in the absorption and dichroic spectra. An improvement planned for the future is the use of an optical potential to take into account the exchange and inelastic interactions on the photoelectron.
Acknowledgments M.A. acknowledges support in part by the U.S. Department of Energy Basic Energy Sciences, Division of Materials Sciences and by NSF, grant number DMR-9520319.
REFERENCES
- [1] Present address: National Synchrotron Light Source, Brookhaven National Laboratory, Upton, New York 11973
- [2] J. Goedkoop, B.T. Thole, G. van der Laan, G.A. Sawatzky, F.M.F de Groot, and J.C. Fuggle, Phys. Rev. B 37, 2086 (1988.).
- [3] B. Thole, P. Carra, F. Sette, and G. van der Laan, Phys. Rev. Lett. 68, 1943 (1992).
- [4] P. Carra, B. Thole, M. Altarelli, and X. Wang, Phys. Rev. B 70, 694 (1993).
- [5] H. Ebert, P. Strange, and B. Giorffy, Z. Phys. B 73, 77 (1988).
- [6] P. Strange and B. Giorffy, J. Phys. Cond. Matter 2, 9451 (1990).
- [7] S. Stälher, G. Schütz, and H. Ebert, Phys. Rev. B 47, 818 (1993).
- [8] H. Ebert, V. Popescu, D. Ahlers, G. Schütz, L. Lemke, H. Wende, P. Srivastava and K. Baberschke, Europhys. Lett. 42, 295 (1998).
- [9] A. Ankudinov and J. Rehr, Phys. Rev. B 52, 10214 (1995).
- [10] C. Brouder, M. Alouani, and K. Bennemann, Phys. Rev. B 54, 7334 (1996).
- [11] J. Igarashi and K. Hirai, J. of Electron. Spectroscopy and Related Phenomena 28, 209 (1996).
- [12] J. Igarashi and K. Hirai, Phys. Rev. B 53, 6442 (1996).
- [13] G. Guo, J. Phys. Cond. Matter 8, 747 (1996).
- [14] J. Chaboy, H. Maruyana, L.M. García, J. Bartolomé, K. Koboyashi, N. Kawamura, A. Marcelli, and L. Bozukov , Phys. Rev. B 54, 637 (1996).
- [15] R.M. Galéra, S. Pizzini, J.A. Blanco, J.P. Rueff, A. Fontaine, Ch. Giorgetti, F. Baudelet, E. Dartyge, and M.F. Lopez, Phys. Rev. B 51, 15957 (1995).
- [16] J.J.M. Franse, and R.J. Radwanski, in Hanbook of Magnetic Material, Vol. 7, edited by K.H.J. Buschow (Elsevier Science, Netherlands, 1993).
- [17] O. Andersen, Phys. Rev. B 11, 3060 (1975).
- [18] B. Barbara, D. Gignoux, and C. Vettier, Lecture on modern magnetism (Science Press Springer-Verlag, Germany, 1988).
- [19] D. Gignoux and D. Schmitt, in Handbook on the physics and chemistry of rare earths, edited by J. Schneider and L. Eyring (Elsevier Science, Netherlands, 1995).
- [20] M. Cyrot and M.Lavagna, J. Physique 40, 763 (1979).
- [21] M. Shimizu, J. Inoue, and S. Nagasawa, J. Phys. F 14, 2673 (1984).
- [22] I. Campbell, J. Phys. F 2, L47 (1972).
- [23] M. Brooks, O. Eriksson, and B. Johansson, J. Phys Condens. Matter 1, 5861 (1989).
- [24] R. Lemaire, Cobalt 32, 132 (1966).
- [25] F. Baudelet, E. Dartyge, A. Fontaine, C. Brouder, G. Krill, J.P. Kappler, and M. Piecuch, Phys. Rev. B 43, 5857 (1991).
- [26] More precisely, the interpretation depends on whether we consider fully or semi-relativistic theories. In a fully relativistic framework, XMCD depends only on the projection of the relativistic photoelectron wavefunction over the states of the absorber. In a semi-relativistic framework, the photoelectron is considered to propagate to all sites of the cluster, where it is scattered by the local spin-orbit interaction. When the -component of this semi-relativistic wavefunction is calculated, it has a contribution from the non-relativistic wave function ( and ) and a contribution due to the spin-orbit scattering by all the atoms of the cluster ().
- [27] O. Jepsen and O. K. Andersen, Solid State Commun. 9, 1763 (1971); G. Lehmann and M. Taut, Phys. Stat. Sol. 54, 469 (1972).
- [28] T. Jarlborg and M. Peter, J. Magn. Mag. Mat. 42, 89 (1984).
- [29] M. Yamaguchi and S. Asano, J. Phys. Soc. of Jpn. 63, 1071 (1994).
- [30] J. Keller, C. Amador, and C. de Teresa, Physica B 130, 37 (1985).
| Compound | Structure | a(Å) | c(Å) | TC(K) | Tcomp(K) |
|---|---|---|---|---|---|
| LaCo5 | CaCu5 | 5.105 | 3.966 | 840 | - |
| TbCo5 | CaCu5 | 4.950 | 3.979 | 980 | 90-110 |
| Dy(Ni0.2Co0.8)5 | CaCu5 | 4.90 | 4.00 | 1000 | 200 |
| TbCo2 | MgCu2 | 7.206 | - | 237.5 | - |
| atoms | sites | point symmetry | equivalent positions |
|---|---|---|---|
| R | 1a | (0,0,0) | |
| Co | 2c | (1/3,2/3,0), (2/3,1/3,0) | |
| Co | 3g | (1/2,0,1/2), (0,1/2,1/2), (1/2,1/2,1/2) |
| RMT (LMTO) (Å) | RMT (MS) (Å) | |
| Co metal | 1.38 | 1.25 |
| GdCo5 | ||
| Gd | 1.86 | - |
| Co(2c) and Co(3g) | 1.40 | - |
| LaCo5 | ||
| La | 1.97 | 1.65 |
| Co(2c) and Co(3g) | 1.40 | 1.24 |
| TbCo5 | ||
| Tb | 1.85 | 1.63 |
| Co(2c) and Co(3g) | 1.40 | 1.23 |