Factors that Affect the Folding Ability of Proteins
Abstract
The folding ability of a heteropolymer model for proteins subject to Monte Carlo dynamics on a simple cubic lattice is shown to be strongly correlated with the energy gap between the native state and the structurally dissimilar part of the spectrum. We consider a number of estimates of the energy gap that can be determined without simulation, including the gap in energy between the native and first excited fully compact states for sequences with fully compact native states. These estimates are found to be more robust predictors of folding ability than a parameter that requires simulation for its evaluation: , where is the temperature at which the fluctuation of the order parameter is at its maximum and is the temperature at which the specific heat is at its maximum. We show that the interpretation of as the collapse transition temperature is not correct in general and that the correlation between and the folding ability arises from the fact that is essentially a measure of the energy gap.
To function as a protein, a polypeptide must possesses a unique native state that is stable at a physiological temperature and be able to find that state in a reasonable time (milliseconds to minutes) at that temperature in spite of the fact that the number of possible configurations prevents it from making an exhaustive search (Levinthal paradox) [1]. For understanding the mechanism of folding and for protein design, it is important to determine the properties that distinguish polypeptide sequences that satisfy these requirements from those that do not. One approach is to compare sequence attributes with folding ability. Analytical heteropolymer theory based on a random energy model suggested that a large gap between the ground (native) state and the states (folds) that are structurally dissimilar is sufficient to allow a sequence to adopt a unique, stable structure [2, 3, 4]. Šali, Shakhnovich, and Karplus (SSK) demonstrated computationally that, for a 27-mer random heteropolymer model of a protein subject to Monte Carlo (MC) dynamics on a simple cubic lattice, a large energy gap promotes fast folding as well [5, 6]. The energy gap criterion has been confirmed by similar studies by other authors [7, 8] and has been used in the design of fast folding sequences [9]. Moreover, SSK showed that, when the ground state is maximally compact, the gap criterion can be simplified to a consideration of the difference in energy between the ground state and the first fully compact () excited state [5].
Based on results obtained with a set of 15-mer and 27-mer sequences, Klimov and Thirumalai (KT) argued that folding ability is not determined by the energy gap but instead by the parameter , where is the “folding” transition temperature (defined as the maximum in the fluctuation of the order parameter) and is the “collapse” transition temperature (defined as the maximum in the specific heat) [10, 11]. KT found that correlates positively with the folding time (small yields fast folding). In the present paper, we show that the maximum in the specific heat () is not the temperature of the collapse transition in general and that is essentially a measure of the energy gap. In light of these considerations, we re-examine the results for the sequences studied by KT. We find that other measures of the energy gap and native state stability, such as the Z-score, correlate more strongly with folding ability than does the parameter .
The specific model is a self-avoiding heteropolymer chain on a three-dimensional simple cubic lattice. The energy function is the sum over all contacts (non-bonded spatial nearest-neighbors):
| (1) |
where is the distance between monomers and located at and , respectively, and is the lattice spacing. The function selects the interacting monomer pairs; and 0 otherwise. The give the specific interaction energies between monomers and ; a complete set of defines a sequence. The are chosen randomly with Gaussian probability distribution:
| (2) |
The quantity () is a mean attraction between monomers that corresponds to an overall hydrophobic term. The 200 27-mer sequences studied in [5] were generated with because that value guaranteed that most sequences had maximally compact ground states which could be found by examining the enumerated ensemble of 103,346 maximally compact structures [12]. In the present study, we use the same sequences as in [10, 11]; there are nine 15-mers with , thirty-two 15-mers with , two 27-mers with , and fifteen 27-mers with . KT included the value because they felt that it produced a more realistic fraction of hydrophobic interactions.
It should be noted that some of the sequences (KT have not stated which ones) were optimized by a Monte Carlo procedure in sequence space [11]. This procedure differs from that used by others [9] in that individual elements of the matrix were interchanged, rather than entire rows and columns (the latter is equivalent to switching residue types in a linear sequence). This optimization procedure is free to make the native contacts the lowest energy ones, so that there is no frustration, and, because only odd can form contacts on a simple cubic lattice, to change the distribution of the that actually contribute to the energy function. The averages of the with odd () differed substantially from in the 58 sequences studied; for sequences with and for sequences with .
We follow KT and use as an order parameter the complement of native pairwise distances [10, 11]:
| (3) |
where is the distance between and in the ground state, and we use as a measure of compactness the total number of contacts (). Boltzmann weighted averages of these quantities were calculated exactly for the 15-mer (all 93,250,730 self-avoiding conformations can be enumerated) and by Monte Carlo simulation for the 27-mer (see [11] for the protocol). Following KT, the “folding” transition temperature () is taken to be the temperature at which the fluctuation in the order parameter has a maximum, and the “collapse” transition temperature () is taken to be the temperature at which the heat capacity has a maximum (units are chosen to make the Boltzmann constant equal to 1). There is one 15-mer sequence with that exhibited two peaks in , three that exhibited shoulders with derivatives close to zero in , and one that exhibited a shoulder with a derivative close to zero in ; in these cases, for consistency with KT, we calculated the corresponding transition temperature ( or ) by a weighted average of the two temperatures corresponding to the zero derivative points (see Eqn. 10 of [11]).
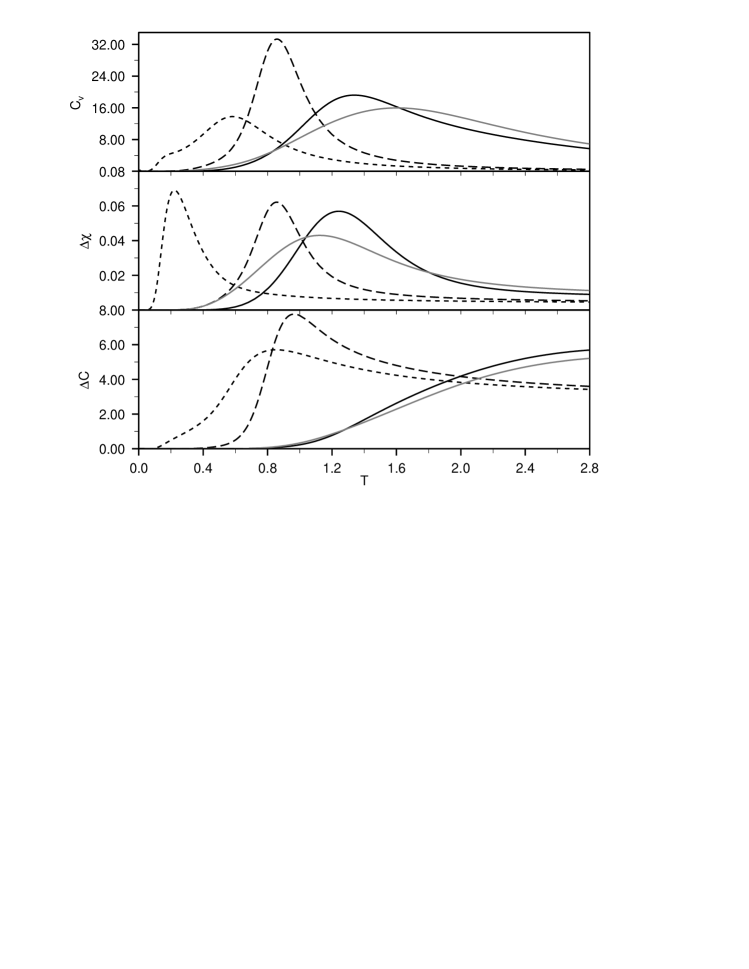
From and , we can calculate the parameter , which was argued by KT to determine folding ability [10, 11]. To better understand , , and , we examine the heat capacity (), the fluctuation in the order parameter (), and the fluctuation in the total number of contacts () as functions of temperature for several representative 15-mer sequences (Fig. 1). When , the collapse is determined by the overall attraction between monomers; reaches its maximum ( for sequence 91 and for 95) at a much lower temperature than does ( and , respectively). When , the collapse transition is driven by specific contacts so that the folding and collapse transitions are closer in . In the case of sequence 62 (), the peak in () is closer to the peak in () than to the peak in (). In the case of sequence 5 (), the peak in () is closer to the peak in () than to the peak in (), but there is a substantial shoulder in at the temperature corresponding to the peak in , which is not uncommon for sequences with larger . Although is clearly associated with the folding transition, cannot be interpreted as the temperature of the collapse transition in general.
It is apparent from the above that must have a different physical meaning than that given in [10, 11]. To better understand , we consider a simple two-state model with free energy (). By substitution into , we find
| (4) |
Similarly,
| (5) |
To determine the maxima ( and , respectively), we take the derivates with respect to temperature and set them equal to zero; it is important to note that and are temperature dependent. We solve the resulting equations by expanding around the true transition point []:
| (6) |
Substitution of Eqn. 6 into and and straightforward rearrangement yield
| (7) |
In other words, and deviate from the true transition () in such a way that a measure of their difference () is inversely proportional to the square of the energy gap. Although lattice models (particularly the short chains considered here) deviate from two-state behavior, the simple model suggests that is related to the energy gap.
We now compare the correlation between and folding ability to that obtained with other measures of the native state stability. These include the transition temperatures themselves ( and ) and the Z-score of the native state [9], which more directly measures the degree to which a native state is separated from the majority of states in the spectrum. For all sequences, we estimated the Z-score by , where is the energy of the native state, is the number of contacts in that state, is the average and is the standard deviation of . For the 15-mers, it was possible to compare this estimate to the exact Z-score: , where is the unweighted average energy and is the standard deviation of energies. As expected, the two quantities are correlated (Tables I and II). For the sequences that have fully compact ground states, the Z-score is closely related to the energy gap between the ground and first excited compact states () [5]. To compare with [5], we include statistics for for the nine 27-mers with that have ground states. Inclusion of the six sequences that have non-compact ground states would be inappropriate, because is unrelated to the Z-score in these cases ().
The folding ability of a sequence was measured by the mean-first passage time for finding the ground state (MFPT). The MFPT was calculated from 100 Metropolis Monte Carlo trials with a move set identical to that used previously [5, 6, 10, 11]. Trials began in a random configuration and were allowed to proceed for up to steps. Following KT, the simulation temperature () was chosen to yield a constant value of the order parameter: . A similar temperature was used by SSK: , where and is the Boltzmann probability of conformation [5]. Since is determined from an order parameter, it is closely related to , and is thus another measure of the native stability.
The logarithm of the MFPT is plotted against , , and for the 15-mers (Fig. 2) and the 27-mers (Fig. 3). Overall, Figs. 2a and 3a are in good agreement with Figs. 2 of [11] and 11 of [10]. Pearson linear correlation coefficients (Tables I and II) are calculated separately for and since these represent different solvent conditions. Although there is a high correlation between and MFPT for sequences with , the correlation is low for those with . In contrast, and both do well and are comparable for both values of . For the 27-mers, the most sensitive measure of folding ability is clearly ; these results are in agreement with [5], where it was found that a temperature at which the order parameter had a particular value () yielded the best predictivity of folding ability. For the sequences with compact ground states, correlates more strongly with folding ability than does any other measure, particularly (Table II).
The correlation between and folding ability is obscured in the studies by KT (Fig. 22 of [11]) because they include sequences with native states that are not fully compact, even though it is clearly stated in [5] that doing so is inappropriate (see also above). Instead, they compare folding ability to the gap between the the native state and the first excited state from the complete conformational ensemble () (Fig. 20 of [11]). Typically, the first non-compact excited state is a tail flip, and thus that gap need not be correlated with either or the Z-score. Moreover, it should be noted that, even if the correct gap () is used with the appropriate sequences (those with fully compact native states), it is incorrect to “normalize” by the simulation temperature () as KT have done in Fig. 3 of [10] and Fig. 21 of [11]. Because and are closely related, they both increase as the magnitude of the Z-score increases. Consequently, their ratio, , is not expected to correlate with stability or folding ability. The calculations presented here are completely consistent with those of KT [10, 11]; it is only the interpretation that differs.
In the study by KT and the present one, the simulation temperature differs for each sequence. This provides a physically meaningful approach since it is appropriate to compare the folding of sequences under conditions of corresponding stability; a protein sequence must not only be able to find its native state but it must be dominantly populated at equilibrium [5]. It has been suggested that the correlation between folding ability and the energy gap found in [5] and, by inference, here derives from the variation in simulation temperature [13]. To address this concern, we performed simulations for the 15-mers at three sets of constant temperatures , and 1.2 (Table III). Although the correlations are somewhat reduced, they remain highly significant. In particular, the correlation between the logarithm of the MFPT and the exact Z-score (), the most direct measure of the energy gap, is essentially unchanged.
Thus, for the same 58 sequences as were studied in [10, 11], it is evident that, although is well correlated with the folding ability for sequences with small (), it is not for sequences with large (). The difference between the two sets of sequences stems from a difference in the dependence of on the Z-score (and hence ), which correlates well with folding ability for both values of and different simulation temperatures; the relationship between and the energy gap (Eqn. 7) breaks down for sequences with because they deviate strongly from two-state behavior due to the large separation in temperature of the collapse and folding transitions. Moreover, , unlike and , can be calculated without either explicit enumeration of all the conformations or Monte Carlo simulation. Consequently, is not only more practical for protein design, but it is a true predictor of folding ability.
The correlation of the folding rate with the energy gap can be understood in
terms of its effect on the energy surface. For random 27-mer sequences,
SSK found that folding proceeds by a fast collapse to a semi-compact random
globule, followed by a slow, non-directed search through the ()
semi-compact structures for one of the () transition states that
lead rapidly to the native conformation [6]. A large energy gap
results in a native-like transition state that is stable at a
temperature high enough for the folding polypeptide chain to overcome barriers
between random semi-compact states. As the energy gap increases
to the levels obtainable in designed sequences,
the model exhibits Hammond behavior [14]
in that the fraction of native contacts required in the transition
state from which the chain folds rapidly to the native state decreases;
random sequences with relatively small gaps must form 80% of the native
contacts [6], while designed sequences with large
gaps need form only 20% [15, 16].
This decrease in the number of native contacts in the transition state
as the energy gap increases is consistent with the the behavior of
homogeneous systems that coalesce into droplets. Strengthening the
interparticle interactions accelerates the process by lowering the
energy of the transition state and decreasing its size [17].
Acknowledgements
We thank Yaoqi Zhou for helpful discussions and KT for making their sequence data available to us. ARD is a Howard Hughes Medical Institute Pre-Doctoral Fellow. ES was supported in part by a grant from the National Institute of Health (GM 52126), and MK was supported in part by a grant from the National Science Foundation.
References
- [1] C. Levinthal. In P. Debrunner, J. C. M. Tsibris, and E. Munck, editors, Mossbauer Spectroscopy in Biological Systems, Proceedings of a Meeting held at Allerton House, Monticello, IL, pages 22–24. University of Illinois Press, Urbana, 1969.
- [2] J. D. Bryngelson and P. G. Wolynes. Spin glasses and the statistical mechanics of protein folding. Proc. Natl. Acad. Sci. USA, 84:7524–7528, 1987.
- [3] J. D. Bryngelson and P. G. Wolynes. Intermediates and barrier crossing in a random energy model (with applications to protein folding). J. Chem. Phys., 93:6902–6915, 1989.
- [4] E. I. Shakhnovich and A. M. Gutin. Formation of unique structure in polypeptide chains: Theoretical investigation with the aid of a replica approach. Biophys. Chem., 34:187–199, 1989.
- [5] A. Šali, E. Shakhnovich, and M. Karplus. Kinetics of protein folding: A lattice model study of the requirements for folding to the native state. J. Mol. Biol., 235:1614–1636, 1994.
- [6] A. Šali, E. Shakhnovich, and M. Karplus. How does a protein fold? Nature, 369:248–251, 1994.
- [7] H. S. Chan and K. A. Dill. Transition states and folding dynamics of proteins and heteropolymers. J. Chem. Phys., 100:9238–9257, 1994.
- [8] N. D. Socci and J. N. Onuchic. Folding kinetics of proteinlike heteropolymers. J. Chem. Phys., 101:1519–152, 1994.
- [9] E. I. Shakhnovich and A. M. Gutin. Engineering of stable and fast-folding sequences of model proteins. Proc. Natl. Acad. Sci. USA, 90:7195–719, 1993.
- [10] D. K. Klimov and D. Thirumalai. Criterion that determines the foldability of proteins. Phys. Rev. Lett., 76:4070–4073, 1996.
- [11] D. K. Klimov and D. Thirumalai. Factors governing the foldability of proteins. Proteins, 26:411–441, 1996.
- [12] E. I. Shakhnovich and A. M. Gutin. Enumeration of all compact conformations of copolymers with random sequence of links. J. Chem. Phys., 93:5967–597, 1990.
- [13] R. Unger and J. Moult. Local interactions dominate folding in a simple protein model. J. Mol. Biol., 259:988–994, 1996.
- [14] G. S. Hammond. A correlation of reaction rates. J. Am. Chem. Soc., 77:334–338, 1955.
- [15] V. I. Abkevich, A. M. Gutin, and E. I. Shakhnovich. Specific nucleus as the transition state for protein folding: Evidence from the lattice model. Biochemistry, 33:10026–10036, 1994.
- [16] A. R. Dinner, A. Šali, and M. Karplus. The folding mechanism of larger model proteins: Role of native structure. Proc. Natl. Acad. Sci. USA, 93:8356–8361, 1996.
- [17] D. W. Oxtoby. Nucleation of crystals from the melt. Adv. Chem. Phys., 70(2):263–296, 1988.