Coherent Moving States in Highway
Traffic
Recent advances in multiagent simulations [1]-[3] have made possible the study of realistic traffic patterns and allow to test theories based on driver behaviour [3]-[6]. Such simulations also display various empirical features of traffic flows [7], and are used to design traffic controls that maximise the throughput of vehicles in heavily transited highways. In addition to its intrinsic economic value [8], vehicular traffic is of interest because it may throw light on some social phenomena where diverse individuals competitively try to maximise their own utilities under certain constraints [9, 10].
In this paper, we present simulation results that point to the existence of cooperative, coherent states arising from competitive interactions that lead to a new phenomenon in heterogeneous highway traffic. As the density of vehicles increases, their interactions cause a transition into a highly correlated state in which all vehicles practically move with the same speed, analogous to the motion of a solid block. This state is associated with a reduced lane changing rate and a safe, high and stable flow. It disappears as the vehicle density exceeds a critical value. The effect is observed in recent evaluations of Dutch traffic data.
In many social situations, decisions made by individuals lead to externalities, which may be very regular, even without a global coordinator. In traffic, these decisions concern when to accelerate or brake, pass, or enter into a heavily transited multi-lane road [11]-[14], while trying to get ahead as fast as possible, but safely, under the constraints imposed by physical limitations and traffic rules. At times this behaviorial rules give rise to very regular traffic patterns as exemplified by the universal characteristics of moving jam fronts [15] or synchronised congested traffic [16, 17]. These phenomena are in contrast with usual social dilemmas, where cooperation in order to achieve a desirable collective behaviour hinges on having small groups or long time horizons [18, 9].
In what follows we exhibit a new type of collective behaviour that we discovered when studying the dynamics of a diverse set of vehicles, such as cars and lorries, travelling through a two-lane highway with different velocities. As the density of vehicles in the road increases, there is a transition into a highly coherent state characterised by all vehicles having the same average velocity and a very small dispersion around its value. The transition to this behavior becomes apparent when looking at the travel time distributions of cars and lorries, comprising the overall dynamics on a freeway stretch (Fig. 1). These were obtained by running computer simulations using a discretised follow-the-leader algorithm [19, 20], which distinguishes two neighbouring lanes of an unidirectional freeway. Both are subdivided into sites of equal length m. Each site is either empty or occupied, the latter case representing the back of a vehicle of type (e.g. a car or lorry) with velocity . Here, is the number of sites that the vehicle moves per update step s. Cars and lorries are characterised by different ‘optimal’ or ‘desired’ (i.e. maximally safe) velocities with which the vehicles would like to drive at a distance to the vehicle in front (see symbols in Fig. 2). Their lengths correspond to the maximum distances satisfying . At times , i.e. every time step , the positions , velocities , and lanes of all vehicles are updated in parallel. We have ruled out synchronisation artefacts [22] by this update method, which is appropriate for flow simulations [1].
Denoting the position, velocity, and distance of the respective leading vehicle (+) or following vehicle () on lane by , , and , in the adjacent lane by , , and , the successive update steps are: 1. Determine the potential velocities and on the present and the adjacent lane according to the acceleration law [21]
where the floor function is defined by the largest integer . This describes the typical follow-the-leader behaviour of driver-vehicle units. Delayed by the reaction time , they tend to move with their desired velocity , but the adaptation takes a certain time because of the vehicle’s inertia.
2. Change lane in accordance with, for simplicity, symmetrical (‘American’) rules, if the following incentive and safety criteria [14] are fulfilled: Check if the distance to the following vehicle in the neighbouring lane is greater than the distance that this vehicle is expected to move within the reaction time (safety criterion 1). If so, the difference defines the backward surplus gap. Next, look if you could go faster in the adjacent lane (incentive criterion). Finally, make sure that the relative velocity would not be larger than (safety criterion 2), where the magnitude of the parameter is a measure of how aggressive drivers are in overtaking (by possibly enforcing deceleration manoeuvres).
3. If, in the updated lane , the corresponding potential velocity or is positive, diminish it by 1 with probability in order to account for delayed adaptation and the variation of vehicle velocities.
4. Update the vehicle position according to the equation of motion .
Despite its simplifications, this model is in good agreement with the empirical known features of traffic flows, and it can be well calibrated [21]: and determine the approximate velocity-density relation and the instability region. The typical outflow from traffic jams and their characteristic dissolution velocity [15] can be enforced by and . The average distance between successive traffic jams increases with smaller . allows to calibrate the lane-changing rates. Our simulations started with uniform distances among the vehicles and their associated desired velocities. The lorries were randomly selected. Since our evaluations started after a transient period of one hour and extended over another four hours, the results are largely independent of the initial conditions.
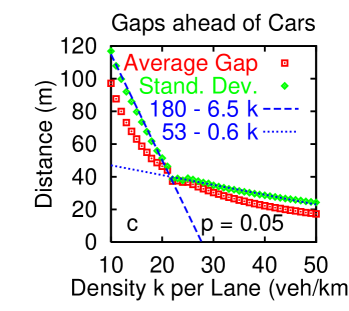
Investigating the density-dependent average velocities of cars and lorries yields further insight into the solid-like state (Fig. 2). For small one finds that, at a certain ‘critical’ density, the average speed of cars decays significantly towards the speed of the lorries, which is still close to their maximum velocity. At this density, the freeway space is almost used up by the safe vehicle headways, so that sufficiently large gaps for lane-changing can only occur for strongly varying vehicle velocities (like for large ). However, since the speeds of cars and lorries are almost identical in the solid-like state, the lane-changing rate drops by almost one order of magnitude (Fig. 3). Consequently, without opportunities for overtaking, all vehicles have to move coherently at the speed of the lorries, which closes the feedback-loop that causes the transition. The solid-like flow does not change by adding vehicles until the whole freeway is saturated by the vehicular space requirements at the speed of the lorries. Then, the vehicle speeds decay significantly to maintain safe headways. The onset of stop-and-go traffic at this density produces largely varying gaps, so that overtaking is again possible and the coherent state is destroyed. For large , we do not have a breakdown of the lane-changing rate at the critical density and, hence, no coherent state. Nevertheless, lane-changing cars begin to interfer with the lorries, so that the average velocity of lorries starts to decrease with growing density before the average car velocity comes particularly close to it (Fig. 2c).
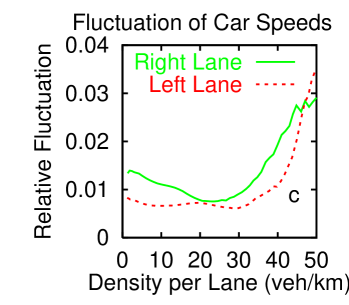
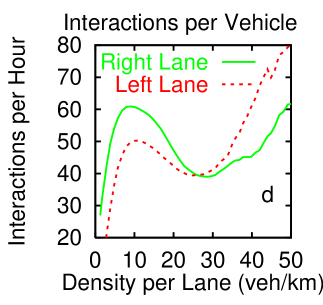
As shown in Figure 4, our prediction of the transition into a coherent state is supported by empirical data obtained from highway traffic in the Netherlands. Clearly, the difference between the average velocities of cars and lorries shows the predicted minimum at a density around 25 vehicles per kilometer and lane, where the average car velocity approaches the constant velocity of the lorries (Fig. 4a,b). The fact that the empirically observed minimum is less distinct than in Fig. 2a can be reproduced by higher values of the fluctuation parameter () and points to a noisy transition. This interpretation is also supported by the relative fluctuation of vehicle speeds (Fig. 4c), which shows a minimum at the same density, while remaining finite. A similar result is obtained for the interation rates of vehicles (Fig. 4d).
In summary, we have presented a novel effect in highway traffic that consists in the formation of coherent motion out of a disorganised vehicle flow by competitive interactions. The predicted solid-like state is supported by real highway data, and our interpretation of the effect suggests that it is largely independent of the chosen driver-vehicle model (although the transition may be less sharp in a continuous model). It would be interesting to see if the spontaneous appearance of coherent states is also found in other social or biological systems, such as pedestrian crowds [24], cell colonies [25], or animal swarms [26].
We conclude by noting that the coherent state of vehicle motion considerably reduces the main sources of highway accidents: differences in vehicle speeds and lane-changes [27]. It is also associated with maximum throughput in the highway and located just before the transition to unstable traffic flow. Thus, at a practical level it is desirable to implement traffic rules and design highway controls that will lead to traffic moving like a solid block. Close to the transition point the formation of this coherent state could be supported by traffic-dependent lane-changing restrictions and variable speed limits or by automatic vehicle control systems. Compared to American (symmetric) lane-changing rules, European ones seem to be less efficient: An asymmetric lane usage, where lorries mainly keep on one lane and overtaking is carried out on the other lane(s), motivates car drivers to avoid the lorry lane, so that the effective freeway capacity is reduced up to 25%.
REFERENCES
REFERENCES
- [1] Schreckenberg, M., Schadschneider, A., Nagel, K. & Ito, N. Discrete stochastic models for traffic flow. Phys. Rev. E 51, 2939–2949 (1995).
- [2] Faieta, B. & Huberman, B. A. Firefly: A synchronization strategy for urban traffic control (Xerox PARC, Palo Alto, Internal Report No. SSL-42, 1993).
- [3] Schreckenberg, M. & Wolf, D. E. Traffic and Granular Flow ’97 (Springer, Singapore, 1998).
- [4] Prigogine, I. & Herman, R. Kinetic Theory of Vehicular Traffic (Elsevier, New York, 1971).
- [5] Leutzbach, W. Introduction to the Theory of Traffic Flow (Springer, Berlin, 1988).
- [6] Helbing, D. Verkehrsdynamik (Springer, Berlin, 1997).
- [7] May, A. D. Traffic Flow Fundamentals (Prentice Hall, Englewood Cliffs, NJ, 1990).
- [8] Small, K. A. Urban Transportation Economics (Harwood Academic, London, 1992).
- [9] Glance, N. S. & Huberman, B. A. The dynamics of social dilemmas. Sci. Am. 270, 76–81 (1994).
- [10] Helbing, D. Quantitative Sociodynamics (Kluwer Academic, Dordrecht, 1995).
- [11] Daganzo, C. F. Probabilistic structure of two-lane road traffic. Transpn. Res. 9, 339–346 (1975).
- [12] Hall, F. L. & Lam, T. N. The characteristics of congested flow on a freeway across lanes, space, and time. Transpn. Res. A 22, 45–56 (1988).
- [13] Rickert, M., Nagel, K., Schreckenberg, M. & Latour, A. Two lane traffic simulations using cellular automata. Physica A 231, 534–550 (1996).
- [14] Nagel, K., Wolf, D. E., Wagner, P. & Simon, P. Two-lane traffic rules for cellular automata: A systematic approach. Phys. Rev. E 58, 1425–1437 (1998).
- [15] Kerner, B. S. & Rehborn, H. Experimental features and characteristics of traffic jams. Phys. Rev. E 53, R1297–R1300 (1996).
- [16] Kerner, B. S. & Rehborn, H. Experimental properties of phase transitions in traffic flow. Phys. Rev. Lett. 79, 4030–4033 (1997).
- [17] Helbing, D. & Treiber, M. Gas-kinetic-based traffic model explaining observed hysteretic phase transition. Phys. Rev. Lett. 81, 3042–3045 (1998).
- [18] Axelrod, R. & Dion, D. The further evolution of cooperation. Science 242, 1385–1390 (1988).
- [19] Gazis, D. C., Herman, R. & Rothery, R. W. Nonlinear follow the leader models of traffic flow. Operations Res. 9, 545–567 (1961).
- [20] Bando, M. et al. Phenomenological study of dynamical model of traffic flow. J. Phys. I France 5, 1389–1399 (1995).
- [21] Helbing, D. Cellular automaton model simulating experimental properties of traffic flows. Submitted to Phys. Rev. (1998).
- [22] Huberman, B. A. & Glance, N. S. Evolutionary games and computer simulations. Proc. Natl. Acad. Sci. USA 90, 7716–7718 (1993).
- [23] Krug, J. & Ferrari, P. A. Phase transitions in driven diffusive systems with random rates, J. Phys. A: Math. Gen. 29, L465–L471 (1996).
- [24] Helbing, D., Keltsch, J. & Molnár, P. Modelling the evolution of human trail systems. Nature 388, 47–50 (1997).
- [25] Ben-Jacob, E. et al. Generic modelling of cooperative growth patterns in bacterial colonies. Nature 368, 46–49 (1994).
- [26] Vicsek, T. et al. Novel type of phase transition in a system of self-driven particles. Phys. Rev. Lett. 75, 1226–1229 (1995).
- [27] Lave, C. A. Speeding, coordination, and the 55 MPH limit. American Economic Review 75, 1159–1164 (1985).
Acknowledgments: D.H. wants to thank the DFG for financial support by a Heisenberg scholarship. He is also grateful to Henk Taale and the Dutch Ministry of Transport, Public Works and Water Management for supplying the freeway data, which were evaluated by Vladimir Shvetsov.
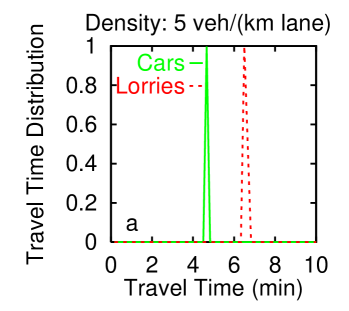
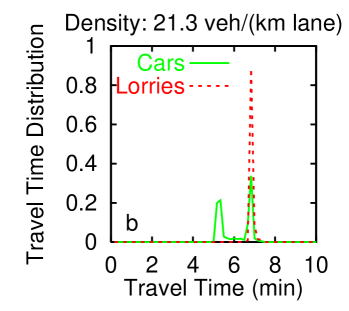
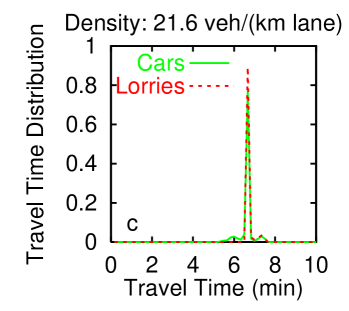
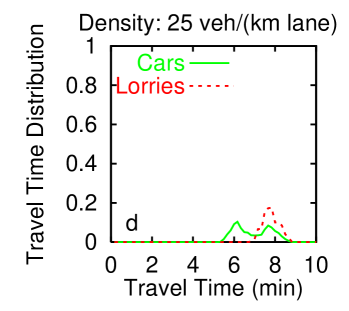
We considered a scenario of about 2.5% randomly selected, identical lorries of length 7.5 m with a maximum velocity of about 90 km/h moving among 97,5% identical cars with 5 m length and a maximum velocity of about 125 km/h. (a) At small densities, the travel time distribution has two narrow peaks at the maximum velocities of cars and lorries, since cars can overtake lorries without prior slowdowns. (b) With increasing but still moderate density, the travel times of lorries remain unchanged, as their slow speed implies large average headways. In contrast, the average travel time of cars grows. As a lack of sufficiently large gaps may prevent immediate lane changing, some cars will have to temporarily slow down to the lorries’ speed. The resulting higher relative velocity to the vehicles in the adjacent lane makes overtaking more difficult, so they may get ‘trapped’ behind lorries for a long time. Therefore, the travel time distribution develops a second peak around the lorry peak. (c) At a certain density, the peak of unobstructed cars disappears, and the travel time distributions of cars and lorries become almost identical, with a small dispersion. (d) If the density is further increased, this highly correlated state of motion breaks down, and a broad distribution of travel times results.
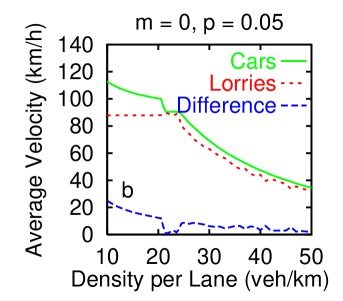
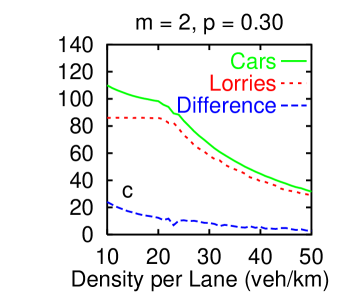
The parameter values were chosen as in Fig. 1, but the observed effects are not very sensitive to their particular choice. Different values of give the same qualitative results (b). A higher proportion of lorries leads to an earlier transition to the solid-like behaviour. Increasing the fluctuation parameter causes a smoother, but still visible transition, until it disappears for (c). A similar thing holds for the width of velocity or parameter distributions characterising cars and lorries.
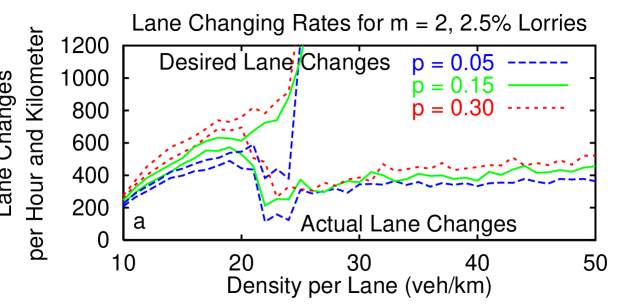
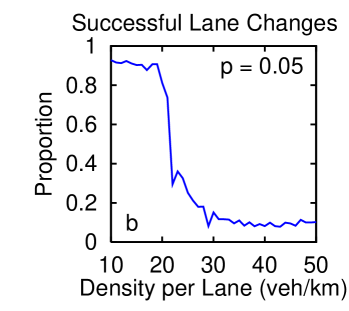
The breakdown of the lane-changing rate seems to imply a decoupling of the lanes, i.e. an effective one-lane behavior. However, this is already the result of a self-organisation process based on two-lane interactions, since any significant perturbation of the solid block state (like different densities in the neighbouring lanes or velocity variations) will cause frequent lane changes. By filling large gaps, the gap distribution is considerably modified (also compared to mixed one-lane traffic [23]). This will eventually reduce possibilities for lane changes, so that the solid-like state is restored.
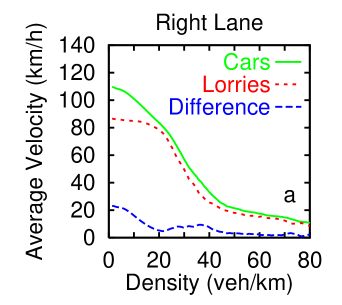
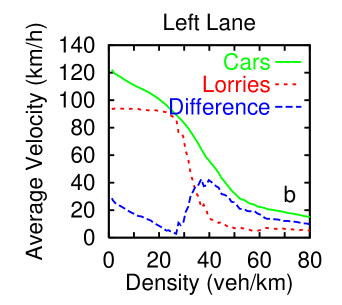
We point out that the above data support the predictions of our model despite its simplifications. In particular, this concerns the asymmetry of European lane-changing rules, which imply that overtaking is only allowed in the left lane, but vehicles should switch back to the right lane as soon as possible. At least at velocities of about 80 km/h or below, vehicles also pass in the right lane with small relative velocities to vehicles in the left lane. Nevertheless, the rate of lane changes from and to each lane is, on average, the same. One result of the mentioned asymmetry, however, is a smaller fraction of lorries in the left lane, which diminishes the related minimum in (c). Another consequence is the tendency of having a higher average car velocity in the left lane, which pronounces the features in (b) compared to (a).