How Popular is Your Paper? An Empirical Study of the Citation Distribution
Abstract
Numerical data for the distribution of citations are examined for: (i) papers published in 1981 in journals which are catalogued by the Institute for Scientific Information (783,339 papers) and (ii) 20 years of publications in Physical Review D, vols. 11-50 (24,296 papers). A Zipf plot of the number of citations to a given paper versus its citation rank appears to be consistent with a power-law dependence for leading rank papers, with exponent close to . This, in turn, suggests that the number of papers with citations, , has a large- power law decay , with .
PACS Numbers: 02.50.+s, 01.75.+m, 89.90.+n
In this letter, I consider a question which is of relevance to those for whom scientific publication is a primary means of scholarly communication. Namely, how often is a paper cited? While the average or total number of citations are often quoted anecdotally and tabulations of highly-cited papers exist[1, 2], the focus of this work is on the more fundamental distribution of citations, namely, the number of papers which have been cited a total of times, . In spite of the fact that many academics are obliged to document their citations for merit-based considerations, there have been only a few scientific investigations on quantifying citations or related measures of scientific productivity. In a 1957 study based on the publication record of the scientific research staff at Brookhaven National Laboratory, Shockley[3] claimed that the scientific publication rate is described by a log-normal distribution. Much more recently, Laherrere and Sornette[4] have presented numerical evidence, based on data of the 1120 most-cited physicists from 1981 through June 1997, that the citation distribution of individual authors has a stretched exponential form, with . Both papers give qualitative justifications for their assertions which are based on plausible general principles; however, these arguments do not provide specific numerical predictions.
Here, the citation distribution of scientific publications based on two relatively large data sets is investigated[5]. One (ISI) is the citation distribution of 783,339 papers (with 6,716,198 citations) published in 1981 and cited between 1981 – June 1997 that have been cataloged by the Institute for Scientific Information. The second (PRD) is the citation distribution, as of June 1997, of the 24,296 papers cited at least once (with 351,872 citations) which were published in volumes 11 through 50 of Physical Review D, 1975–1994. Unlike Ref. [4], the focus here is on citations of publications rather than citations of specific authors. A primary reason for this emphasis is that the publication citation count reflects on the publication itself, while the author citation count reflects ancillary features, such as the total number of author publications, the quality of each of these publications, and co-author attributes. Additionally, only most-cited author data is currently available; this permits reconstruction of just the large-citation tail of the citation distribution.

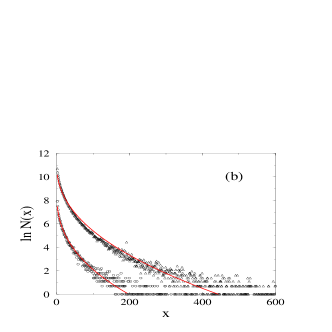
The main result of this study is that the asymptotic tail of the citation distribution appears to be described by a power law, , with . This conclusion is reached indirectly by means of a Zipf plot (to be defined and discussed below), however, because Fig. 1 indicates that the citation distribution is not described by a single function over the whole range of .
Since the distribution curves downward on a double logarithmic scale and upward on a semi-logarithmic scale (Figs. 1(a) and (b) respectively), a natural first hypothesis is that this distribution is a stretched exponential, . Visually, the numerical data fit this form fairly well for (PRD) and (ISI) as indicated in Fig. 1(b), with best fit values (PRD) and (ISI). However, the stretched exponential is unsuitable to describe the large- data. Here, data points are widely scattered, reflecting the paucity of well-cited papers. For example, in the ISI data, only 64 out of 783,339 papers are cited more than 1000 times, 282 papers are cited more than 500 times, and 2103 papers are cited more than 200 times, with the most-cited paper having 8907 citations. Such a sparsely populated tail is not amenable to being directly fit by a smooth function. (Amusingly (or soberingly) 633,391 articles in the ISI set are cited 10 times or less and 368,110 are uncited.)
Another test to determine the functional form of is to compare numerical values for the moments of the citation distribution
| (1) |
with those obtained by assuming a given form for . For example, if the citation distribution is a stretched exponential, then the dimensionless ratios , where is the gamma function. Notice that the scale factor in the exponential cancels. For each , an estimate for can be inferred by matching the value of obtained from the above gamma function formula with the corresponding numerical data. For both the ISI and PRD data, the corresponding estimates for for depend weakly but non-systematically on , and further do not match the values for obtained from a least-squares fit to a stretched exponential (Fig. 1(b)). Similarly, the numerical data for also do not match a power-law form for the citation distribution, . These results provide evidence that the citation distribution is not described by a single function over the entire range of citation count.
More fundamentally, it is natural to expect different underlying mechanisms and different statistical features between minimally-cited and heavily-cited papers. The former are typically referenced by the author and close associates, and such papers are typically forgotten a short time after publication. Evidence for such a short lifetime of minimally-cited papers can be found, e.g., by comparing the small-citation tail of for the first 4 years (1975-79) and the last 4 years (1990-1994) of the PRD data set. For , these data (appropriately normalized) and the complete PRD data are virtually identical. On the other hand, well-cited papers become known through collective effects and their impact also extends over long time periods. This is reflected in the significant differences among the large-citation tails of for papers of different eras.
To help expose these differences in the citation distribution, it is useful to construct a Zipf plot[6], in which the number of citations of the most-ranked paper out of an ensemble of papers is plotted versus rank (Fig. 2). By its very definition (see Eq. (2)), the Zipf plot is closely related to the cumulative large- tail of the citation distribution. This plot is therefore well-suited for determining the large- tail of the citation distribution. The integral nature of the Zipf plot also smooths the fluctuations in the high-citation tail and thus facilitates quantitative analysis.
Given an ensemble of publications and the corresponding number of citations for each of these papers in rank order, , then the number of citations of the most-cited paper, , may be estimated by the criterion[7]
| (2) |
This specifies that there are publications out of the ensemble of which are cited at least times. Eq. (2) also represents a one-to-one correspondence between the Zipf plot and the citation distribution. From the dependence of on in a Zipf plot, one can test whether it accords with a hypothesized form for .
In Fig. 2(a), a Zipf plot of the rank-ordered citation data is presented on a double logarithmic scale for 4 data sets: (a) ISI data (top 200,000 papers only), (b) complete PRD data (24,296 papers), (c) first 4 years of PRD data, vols. 11-18 (5044 papers), and (d) last 4 years of PRD data, vols. 43-50 (5467 papers). As alluded to previously, there is a considerable difference between the first and last 4 years of the PRD data. As might be anticipated, the more recent highly-cited papers (up to approximately rank 700) are cited less than papers in the earlier sub-data. (There are two exceptions, however. These are the two top papers in the first 4 years which are cited 1741 and 1294 times, while in the last 4 years of data the two leading papers are cited 2026 and 1420 times.) The larger citation count of heavily-cited older papers reflects the obvious fact that popular but recent PRD papers are still relatively early in their citation history. This is in sharp contrast to poorly-cited papers where there is little difference in the citation count from the first 4 years and the last 4 years of the PRD data.


To interpret the apparently unsystematic data in the Zipf plot of Fig. 2(a) effectively, it is instructive to scale the data. Since ranges between 1 and the number of publications in the ensemble, it is natural to define a scaled relative rank , where is the total number of papers in each of the 4 data sets in Fig. 2, (, 2, 3, or 4). Similarly, for the ordinate, it is useful to define a scaled citation count for the most-cited paper by , where is the average number of citations for all papers in the data set. As shown in Fig. 2(b), there is relatively good collapse of the 4 data sets onto a single universal curve. Notice also that the disparity in the two PRD data subsets appears as a relatively small fluctuation about a mean value. The data collapse also provides a strong clue about the location of the asymptotic regime for citation data.
Of particular relevance for the citation distribution, this scaling plot indicates that the ISI data extends deeper than the PRD data into the asymptotic tail of most heavily-cited papers. This arises both from the fact that the ISI data involves approximately 30 times more publications than the PRD data and that the average number of citations to ISI papers is approximately one-half that of PRD papers. From the available data, the highly-ranked ISI publications therefore provide the best representation of the asymptotic tail of the citation distribution. For ISI publications between rank 1 (8904 citations) and 12,000 (approximately 85 citations), the data is fairly linear and a least-squares data fit in this range yields an exponent for the Zipf plot of Fig. 2(b) of approximately . By inverting Eq. (2), this power law is equivalent to the distribution of citations also having a power law form for large , with .
This power-law behavior suggests a reconsideration of the citation distribution in this range of 85 citations (Fig. 1(a)). The curvature in the data decreases significantly for and it is not unreasonable to attempt a power law fit, but with the additional caveat that the citation data beyond approximately 500 citations is dominated by fluctuations. Consequently there is subjectivity in specifying the range over which this fit is performed. Least-squares fits to the data within give exponent estimates in the range 2.6 – 2.8, and a fit for , where the data are visually the most linear, both in the citation distribution and in the Zipf plot, gives . The correspondence between these fits and those in the Zipf plot therefore suggest that the citation distribution may have a power-law tail, , with exponent close to 3.
| Year | # articles | ||||
|---|---|---|---|---|---|
| 1975 | 1369 | 19.3 | 80.0 | 168.8 | 1294 |
| 1976 | 1085 | 17.8 | 71.8 | 178.5 | 1741 |
| 1977 | 1328 | 16.9 | 61.5 | 126.6 | 846 |
| 1978 | 1262 | 16.5 | 56.6 | 123.2 | 1066 |
| 1979 | 1229 | 17.8 | 57.5 | 114.7 | 907 |
| 1980 | 1114 | 18.5 | 61.9 | 126.2 | 912 |
| 1981 | 1107 | 17.0 | 62.5 | 148.8 | 1449 |
| 1982 | 1116 | 13.0 | 32.4 | 56.7 | 340 |
| 1983 | 1100 | 14.6 | 51.1 | 107.7 | 813 |
| 1984 | 1090 | 14.4 | 46.9 | 107.6 | 1004 |
| 1985 | 1094 | 13.8 | 34.6 | 66.7 | 579 |
| 1986 | 1222 | 11.8 | 24.7 | 38.9 | 215 |
| 1987 | 1275 | 12.7 | 35.6 | 79.5 | 772 |
| 1988 | 1124 | 11.4 | 23.6 | 38.8 | 244 |
| 1989 | 1153 | 12.0 | 29.8 | 62.6 | 600 |
| 1990 | 1161 | 13.0 | 29.7 | 57.5 | 515 |
| 1991 | 1083 | 13.2 | 34.5 | 74.9 | 622 |
| 1992 | 1388 | 13.3 | 47.3 | 130.0 | 1420 |
| 1993 | 1436 | 11.5 | 23.0 | 40.0 | 311 |
| 1994 | 1560 | 11.9 | 55.9 | 175.4 | 2026 |
Another important aspect of citation statistics which emerges from Fig. 2(a) is its continuing temporal evolution. This feature is nicely illustrated by the annual citation statistics of PRD publications, where the average number of citations for articles published in a given year is typically decreasing slowly with time (Table 1). It is interesting that the existence of a single exceptionally well-cited paper in a particular year has an imperceptible effect on but a much larger influence on higher-order moments. Notice also that the total number of citations to PRD papers published in a given year, even as far back as 1975 (the first year for which data is available), is slowly increasing. Since papers from this period which are still currently being cited are also likely to be highly cited, this implies that the large- tail of the citation distribution has not yet reached its final state. Because of this continuing evolution of the citation distribution, one cannot expect that the properties of the high-citation tail of the citation distribution will be accurately determined by direct analysis.
In summary, the citation distribution provides basic insights about the relative popularity of scientific publications and provides a much more complete measure of popularity than the average or total number of citations. At a basic level, most publications are minimally recognized, with of the papers in the ISI data set uncited, more than 80% cited 10 times or less, and cited more than 1000 times. The distribution of citations is a rapidly decreasing function of citation count but does not appear to be described by a single function over the entire range of this variable. Although the available data is extensive, it still appears insufficient to quantify the tail of the citation distribution unambiguously by direct means. However, a Zipf plot of the citation count of a given paper versus its citation rank indicates a substantial range of power law behavior with exponent close to . This provides indirect evidence that the citation distribution has a power law asymptotic tail, with . This differs from the conclusion of Ref. [4], where the citation distribution of individual authors was argued to have a stretched exponential tail.
Another important aspect of citations is that computerized data are relatively recent, and the PRD data indicates that citation statistics from 1975 are still evolving. Thus even the more extensive ISI data set is still too recent to provide an accurate picture of the long-time and large-citation tail of the citation distribution. It should therefore be worthwhile to study the properties of older citation data. Alternatively, information of a related genre, such as the distribution of sales for a particular class of books, or ticket sales for movies and theaters may provide useful data for studying citation-related statistics.
Finally, the citation distribution provides an appealing venue for theoretical modeling. There are several qualitative features about citations which should be essential ingredients for a theory of their distribution. Since almost all papers are gradually forgotten, the probability that a given paper is cited should decrease in time with a relatively short memory. Conversely, a paper which is in the process of becoming recognized gains increasing attention through citations. This suggests that the probability of a paper being cited at a given time should be an increasing function of the relative number of citations to that paper from an earlier time period. Work is in progress to construct a model for the citation distribution which is based on these considerations.
I thank P. Krapivsky, F. Leyvraz, and D. Sornette for helpful discussions, P. Krapivsky for critical suggestions on the manuscript, and D. Sornette for providing the author-based ISI citation data and related pertinent information. I also thank H. Galic from the SPIRES High-Energy Physics Databases at SLAC, and D. Pendlebury and H. Small from the Institute for Scientific Information for providing citation data and helpful advice. I gratefully acknowledge NSF grant DMR-9632059 and ARO grant DAAH04-96-1-0114 for partial financial support.
REFERENCES
- [1] See e.g., Science Citation Index Journal Citation Reports (Institute for Scientific Information, Philadelphia) for annual lists of top-cited journals and articles (web site: http://www.isinet.com/welcome.html).
- [2] For example, current lists of top-cited articles in high-energy physics are maintained by the SPIRES High-Energy Physics Database at SLAC (web site http://www.slac.stanford.edu/find/top40.html).
- [3] W. Shockley, Proc. IRE 45, 279 (1957).
- [4] J. Laherrere and D. Sornette, cond-mat/9801293.
- [5] The PRD data was provided by H. Galic from the SPIRES Database. The ISI data was provided by D. Pendlebury and H. Small of the Institute for Scientific Information. These two data sets and related citation data are available from my web site http://physics.bu.edu/redner.
- [6] G. K. Zipf, Human Behavior and the Principle of Least Effort (Addison-Wesley, Cambridge, 1949).
- [7] This is a basic exercise in extreme value statistics. See e.g., J. Galambos, The Asymptotic Theory of Extreme Order Statistics, (J. Wiley & Sons, New York, 1978).