ARE FINANCIAL CRASHES PREDICTABLE?
92535 Levallois cedex, France
2 Institut de Physique Théorique, École Polytechnique Fédérale,
CH-1015 Lausanne, Switzerland
3 Capital Futures Management, 109–111, rue Victor Hugo,
92535 Levallois cedex, France
4 Service de Physique de l’État Condensé, Centre d’études de Saclay,
Orme des Merisiers, 91191 Gif-sur-Yvette cedex, France
)
Abstract
We critically review recent claims that financial crashes can be predicted using the idea of log-periodic oscillations or by other methods inspired by the physics of critical phenomena. In particular, the October 1997 ‘correction’ does not appear to be the accumulation point of a geometric series of local minima.
It is rather tempting to see financial crashes as the analogue of critical points in statistical mechanics, where the response to a small external perturbation becomes infinite, because all the subparts of the system respond cooperatively (a large proportion of the actors in a market decide simultaneously to sell their stocks). If one furthermore assumes that ‘log-periodic’ corrections (for which there is a recent upsurge of interest [1]) are present, then one can try to use the oscillations seen on markets as precursors to predict the crash time , which is the point where these oscillations accumulate. Intriguing hints supporting this scenario have been reported in [2, 3], and more recently in [4, 5], where it was even claimed that the October 1997 correction could be predicted (see also [6]). As a proof of this, the implementation of a winning strategy was reported in [7]. In view of the considerable echo that these claims have enjoyed, in particular in the physics community [8], we feel that it is important to temper the growing enthusiasm by discussing a few facts.
In general, the unveiling of a new phenomenon either results from a strong theoretical argument suggesting its existence, or from compelling experimental evidence. In the present case, there is no convincing theoretical model which substantiates the idea that crashes are critical points – not even speaking about log-periodic oscillations. On the ‘experimental’ side, there has been only very few crashes where this scenario (or any theoretical model for that matter) can be tested. Hence, although suggestive, the empirical findings are obviously not statistically significant. The fact of correctly predicting one event ex ante (the October 1997 correction [7]) is clearly not enough to prove the theory right: many ‘chartists’ make a living by ‘recognizing’ patterns on past charts of prices and are on average right 50% of the time. We want to publicly disclose here the fact that on the basis of a log-periodic analysis, a crash on the JGB (Japanese Government Bonds) for the end of May, 1995 was predicted [9]. On this basis, one of us (JPA) bought for $1,000,000 of put options in early May 1995, a sum representing less than 1% of the amount under management of CFM (a fund management company trading on the basis of statistical models). The crash did not occur, and only a delicate trading back allowed to avoid losses. The point is not that the out-of-sample prediction failed (the risk was deliberately taken), but rather that it worked one time and failed the other, a fact that is not mentioned in [7]. Obviously, this does not mean that the method works 50% of the time (which would already be quite interesting); an apparent success out of a least two trials is just not statistically significant!
The methodological procedure used to extract the ‘crash time’ is actually rather dubious, since a seven (or even nine) parameters fit to noisy data is required, which is of some concern. Sometimes, the time period over which the fit is performed is rather long, which implies that a small dip occuring more than five years before the crash must be seen as causally related to the crash, which is somehow hard to believe. A more robust prediction of the log-periodic scenario is that the price chart should exhibit a sequence of minima (and maxima) at times such that:
| (1) |
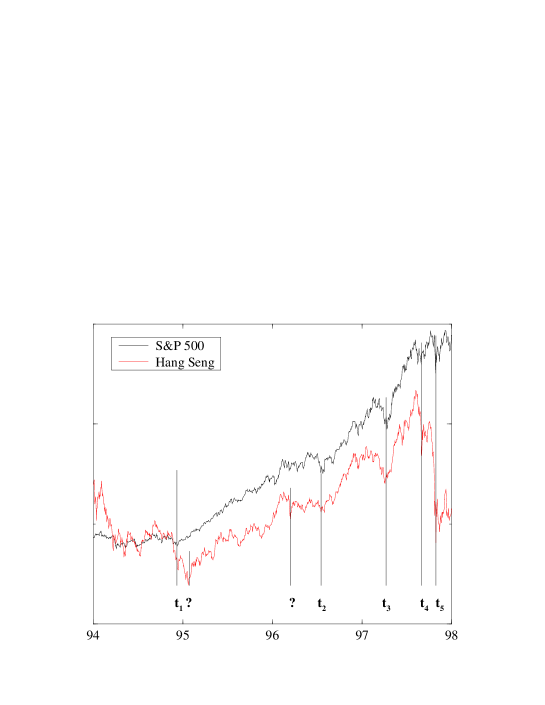
i.e. that the time lags between minima follows a geometric contraction. The crash time is defined as the accumulation of these minima. Looking at the S&P chart between 1994 and the end of 1997 (see figure 1), one can identify five ‘major’ minima, most of them being identified as such by the press at the time, the last (at time ) one being the October 1997 ‘crash’ [10]. (Of course, there are also many local minima of less importance). One finds the following time lags (in days): , , and . On the basis of the four first events, one obtains three time lags and thus two estimates of , namely and , from which one estimates : this is the ‘crash’ prediction, which indeed worked well since the observed [11]. But, the scenario also predicts that another drawdown should have occurred at such that , i.e, at the end of November 1997, and maybe another one days later – none of which occurred. One can of course argue that the accumulation of crash times will be smeared out when one reaches the day (or the week) time scale, but in any case a 6th minimum should have been observed, otherwise the very notion of ‘critical point’ is empty. In view of the fact that three successive ratios were close to one another (and close to their value [12]), the possibility of a crash occuring at the end of November was real; conversely, its non existence throws serious doubts on the validity of a log-periodic scenario. Furthermore, one can study the Hong-Kong index which did experience a serious crash at the end of November 1997. One finds that the above , indeed corresponds to rather deep minima; however, there are also at least two extra ‘obvious’ minimum between and which ruins the idea of a constant (see figure 1).
Using somewhat related ideas, another prediction of the October 1997 correction was reported in [6]. These authors also predicted a 13% fall of the S&P during March 1998 [13], which did not occur (the index rose by 5% instead). We have systematically tested their method, where the price at the end of the next month is predicted on the basis of the previous three to five months. We studied the S&P from 1990 to the beginning of 1998, and found that, for example, the prediction error using the 3 point procedure described in [6] is about (see table 1), which is three times larger than the simplest ‘no-change’ prediction, i.e. that next month price is equal to this month price!
| Method: | ||
|---|---|---|
| no-change | 2.8 % | 3.4 % |
| 3 months | 7.5 % | 10.0 % |
| 4 months | 5.8 % | 11.3 % |
| 5 months | 12.3 % | 17.0 % |
To answer the question raised in the title, we have argued that the recent claims on the predictability of crashes are at this point not trustworthy. This however does not mean that crash precursors do not exist, an example could be a systematic increase of the volatility prior to the crash. This general subject certainly merits further investigations. Finance is a fascinating field with huge amounts of money at stake. There is a danger that this might sometimes lead physicists astray from minimal scientific rigor.
We thank P. Cizeau and I. Kogan for discussions. We also thank M. Ausloos, D. Sornette, D. Stauffer, N. Vandewalle and V. Yukalov for comments on an earlier version of the paper.
References
- [1] D. Sornette, Physics Reports, in press, cond-mat/9707012.
- [2] D. Sornette, A. Johansen, J.P. Bouchaud, J. Physique 6 (1996) 167.
- [3] J.A. Feigenbaum, P.G.O. Freund, Int. J. Mod. Phys. 10 (1996) 3737.
- [4] J.A. Feigenbaum, P.G.O. Freund, cond-mat/9710324.
- [5] For a more careful analysis, see: M. Ausloos, P. Boveroux, A. Minguet, N. Vandewalle, Universal and complex behaviour of prerupture signals in stock market indices, Université de Liège, submitted to Physica A; their prediction was announced in the general press in Tendances (18 sept. 1997) pp 26–27 and ibid (30 oct. 1997) p. 11.
- [6] S. Gluzman, V.I. Yukalov, cond-mat/9710336.
- [7] In a strange footnote in D. Stauffer, D. Sornette, cond-mat/9712085, Physica A 252, 271 (1998), and again in B. M. Roehner and D. Sornette, cond-mat/9802234, a 5 to 1 reward based on the log-periodic ‘bet’ is presented as the proof of the pudding. Under the reasonable assumption that option prices are not too far from ‘fair-game’, this means that the market estimated the probability of such an adverse move to be about 20%.
- [8] T. Chapman, Europhysics News 29 (1998) 4 and 35–36.
- [9] D. Sornette, private communication to J.-P. Aguilar, May 1995.
- [10] To call the October 1997 turmoil a crash is furthermore unadapted, since the S&P index made a strong rebound on the following day and reached a new historical high about a month later!
- [11] The occured in August 1997. With this information in hand, we (and others, for example [5], or I. Kogan in Oxford (private communication)) also calculated to be around the end of October 1997. However, we judged the evidence too thin to take the bet. Obviously, this was a missed opportunity; but it shows that the evidence was simply not compelling.
- [12] Note that the parameter for the 1987 crash is calculated using the 7 (or 9) parameter fit to a full log-periodic oscillating function, while for the 1997 crash, identification of the local minima is used. Neither method works convincingly in the other case.
- [13] S. Gluzman, V.I. Yukalov, cond-mat/9803059.