Environmental Changes, Co-extinction, and Patterns in the Fossil Record
Abstract
We introduce a new model for large scale evolution and extinction in which species are organized into food chains. The system evolves by two processes: origination/speciation and extinction. In the model, extinction of a given species can be due to an externally induced change in the environment or due to the extinction of all preys of that species (co-extinction). The model is able to reproduce the empirical observations, such as the statistical fractality of the fossil record or the scale-free distribution of extinction events, without invoking extinctions due to competition between species.
The identification of the mechanisms responsible for large-scale evolution and extinction is a topic of heated debate [1, 2, 3, 4, 5, 6, 7, 8, 9, 10]. The basic problem can be summarized by two questions. The first one centers on the cause of mass extinction: Is it external to the system — e.g., due to extraterrestrial impacts [11, 12, 13, 14] — or is it internal and due to the nonlinear dynamics of the ecosystem [15, 16, 17, 18]? The second question centers on the mechanisms for selecting the species that become extinct: In standard extrapolation of Darwinian evolution theory, it is assumed competition leads to the extinction of less fit species [15, 16, 17, 18, 19, 20], but some authors argue that competition might be not a determinant factor for macroevolution [1, 2, 6]. The fossil record has yet to answer these questions unequivocally [3, 21, 22, 23, 24]. In qualitative modelling, all of the mechanisms discussed above have been considered as the explanation of the patterns in the fossil record. On the other hand, quantitative modelling approaches [15, 16, 17, 18] have consistently included competition among species as a fundamental mechanism. Here, we show that a quantitative model that does not include competition among species may reproduce the empirical observations, particularly the statistical fractality of the fossil record [9, 25], and the scale-free distribution of extinction sizes [5, 6, 7].
The literature on large scale species extinction reports on two key empirical results. First, the probability density that a number of species becomes extinct during a given time interval decays as a power law, , with an exponent [17, 18, 23]. Second, the power spectrum of the time series of extinction sizes also decays as a power law, , with [9], which implies that the sequence of extinction is long-range correlated. These results impose severe constraints on the models attempting to describe the extinction/evolution process. A power law decay of the probability of extinction sizes implies that there is no characteristic size for extinction events, i.e. the dynamics are scale-free and incidents of mass extinction are likely due to the same mechanisms as smaller extinction events. The hypothesis that the mass extinctions are generated by the same dynamics as smaller extinction events is consistent with the self-similarity of the fossil record [9].
Quantitative models have been proposed to explain the patterns in the fossil record. Many are based on the assumption that extinction events are a consequence of the competition between species, i. e. the least fit species become extinct and are replaced by new species [15, 16, 17, 18, 19, 20]. These changes affect the fitness of other species leading to bursts of extinction of all sizes. Several of the models [16, 17] self-organize into a critical state in which many quantities are known to scale as a power law [18]. However, recently it has been shown that mechanisms other than self-organized criticality, such as coherent noise [19, 20] can lead to power law scaling without requiring the system to be in a critical state.
In this Letter, we test the hypothesis that competition between species is not a fundamental ingredient for the explanation of the fossil record. This hypothesis is in agreement with statements that Darwinian competition while important at the level of individuals within a population (microevolution) might not be relevant at the level of stable species (macroevolution) [1, 2]. Thus, we propose a quantitative model for large scale extinction and evolution that does not include competition between species but assumes instead that the relevant mechanisms for macroevolution are (random) changes in the environment [12, 13], and co-extinctions [26] due to the interactions between species along food chains [10, 27, 28]. The model is able to reproduce both the power law distribution of extinction sizes and the fractality of the fossil record [Figs. 1–3]. These results suggest that competition between species might not be a fundamental ingredient for the description of the fossil record.
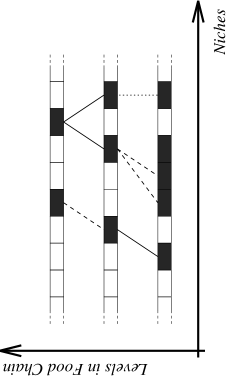
The model is defined as follows. Species can occupy niches in a model ecosystem with trophic levels in the food chain, and niches in each level. Species from the first level, are assumed to be autotrophic (i.e., they produce their food through, e.g., photosynthesis), while species from levels are assumed to be heterotrophic. That is, a species occupying a niche in level feeds from at most species occupying niches in level [Fig. 1]. We do not consider in the model any kind of structure of the niches within a given trophic level, that is, niches and in level do not need to be occupied by similar species or to be geographically close. Finally, we assume that the preys of a new species are chosen at random from existing species in the trophic level below. The model starts with species in level and evolves according to the following rules:
-
Origination: every existing species gives rise, at a rate , to the creation of a new “potential” species that tries to occupy a randomly selected niche in the same trophic level or in one of the two neighboring levels. This speciation event occurs if the selected niche is not yet occupied by an existing species. Preys for the new species are selected at random from existing species in the trophic level below.
-
Extinction: at rate 1 (in some arbitrary time unit), a fraction of species in the first level are randomly selected for extinction. Then, any species in the second level for which all preys became extinct also becomes extinct. This procedure is repeated up to level .
These rules imply that the number of species in the system is not kept constant. In particular, if the origination rate is smaller than a threshold value, then all species become extinct, i.e., the model has absorbing states [29]. The rules for speciation imply that the origination rate of new successful species is proportional to the number of species in the system (leading to exponential growth, in agreement with the results of [8]), and to the number of empty niches (which takes into consideration the limited resources of the system [20]). Although the finite size of the system introduces competition for the creation of new species, the model does not involve any competition between existing species.
Figure 2 shows our results for the time sequence of extinction and origination events. The first interesting observation is that both signals are intermittent with very large events appearing at a high rate. Furthermore, there is a strong correlation between the extinction and origination curves, which is in qualitative agreement with empirical observations [8, 30]. Finally, we find that the size of the extinction events has a distribution which decays with a power law tail with an exponent , in agreement with empirical observations [17, 18, 23].
Next, we study the fluctuations in the number of species in the system [Fig. 3]. We find that these fluctuations are self-affine [31], as demonstrated by its power spectrum which scales as a power law. This result is in agreement with the perceived fractality of the fossil record [9, 25].
In order to demonstrate the ability of our model to reproduce quantitatively the empirical data on extinction and origination, we compare in detail our results with the recent results of Ref. [9]. We therefore study the temporal correlations of extinction events for the model and compare our results with the analysis of the fossil record [7]. Figure 4 shows that the model results agree well with the empirical data, when we consider model sequences of the same lengths as available in the fossil record. This agreement is found for the power spectrum as well as for the method of detrended fluctuation analysis, which allows accurate estimates of correlation exponents independent of local trends [31]. Note, however, that once we consider longer records generated by the model, we find that the results crossover to uncorrelated behavior. In fact, the analysis of local slopes [see inset of Fig. 4b] indicates a similar trend for the empirical data as well, suggesting that extinction events might become uncorrelated at long time scales.
The model proposed here is able to reproduce key statistical properties of the fossil record, both for the extinction and the origination of species. In contrast with many models in the literature, these results are obtained without having to assume that species have an intrinsic fitness, and that less fit species become extinct due to competition between species. In the model, mass extinctions are due to the amplification effect of predator-prey interactions that propagate along the food chain [10]. In this framework, the extinction of some key species (due to environmental changes) can lead to catastrophic extinction events.
We thank N. Dokholyan, P.Ch. Ivanov, H. Kallabis, M. Kardar, R.V. Solé, and H.E. Stanley for stimulating discussions. L.A.N.A. thanks the JNICT and M.M. thanks the DGF for financial support.
REFERENCES
- [1] Gould, S.J. & Eldredge, N. Punctuated equilibrium comes of age. Nature 366, 223-227 (1993).
- [2] Stanley, S.M. Macroevolution (Freeman, San Francisco, 1979).
- [3] Glen, W. (ed.) The Mass Extinction Debates (Stanford Univ. Press, Palo Alto, 1984).
- [4] Maynard Smith, J. The causes of extinction. Phil. Trans. R. Soc. Lond. B 325, 241–252 (1989).
- [5] Elliot, D.K. (ed.) Dynamics of Extinctions (Wiley, New York, 1986).
- [6] Raup, D.M. Extinctions: Bad Genes or Bad Luck? (Oxford Univ. Press, Oxford, 1993).
- [7] Benton, M.J. (ed.) The Fossil Record 2 (Chapman & Hall, London, 1993).
- [8] Benton, M.J. Diversification and extinction in the history of life. Science 268, 52–58 (1995).
- [9] Solé, R.V., Manrubia, S.C., Benton, M. & Bak, P. Self-similarity of extinction statistics in the fossil record. Nature 388, 764–767 (1997).
- [10] Smith, A.B. & Jeffery, C.H. Selectivity of extinction among sea urchins at the end of the Cretaceous period. Nature 392, 69–71 (1998).
- [11] Alvarez, L.W., Alvarez, W., Asaro, F. & Michel, H.V. Extraterrestrial cause for the Cretaceous-Tertiary extinction. Science 208, 1095–1108 (1980).
- [12] Hoffmann, A.A. & Parsons, P.A. Evolution Genetics and Environmental Stress (Oxford Univ. Press, Oxford, 1991).
- [13] Jablonski, D. Extinctions: A paleontological perspective. Science 253, 754–757 (1991).
- [14] Raup, D.M. & Sepkoski, J.J.Jr Periodicity of extinctions in the geologic past. Proc. Nat. Acad. Sci. USA 81, 801–805 (1994).
- [15] Kauffman, S. & Johnsen, J. Coevolution to the edge of chaos: Coupled fitness landscapes poised states and coevolutionary avalanches. J. Theor. Biol. 149, 467–505 (1991).
- [16] Bak, P. & Sneppen, K. Punctuated equilibrium and criticality in a simple model of evolution. Phys. Rev. Lett. 59, 381–384 (1993).
- [17] Solé, R.V. & Bascompte, J. Are critical phenomena relevant to large-scale evolution? Proc. R. Soc. Lond. B 263, 161–168 (1996).
- [18] Newmann, M.E.J. A model of mass extinctions. J. Theor. Biol. 189, 235–252 (1997).
- [19] Newman, M.E.J. & Sneppen, K. Avalanches, scaling, and coherent noise. Phys. Rev. E 54, 6626–6629 (1996).
- [20] Wilke C. & Martinetz T. Simple model of evolution with variable system size. Phys. Rev. E 56, 7128–7131 (1997).
- [21] Signor, P.W. & Lipps, J.H. Sampling bias, gradual extinction patterns and catastrophes in the fossil record. Geol. Soc. Am. Spec. Pap. 190, 291–296 (1982).
- [22] House, M.R. Ammonoid extinction events. Phil. Trans. R. Soc. Lond. B 325, 307–326 (1989).
- [23] Raup, D.M. A kill curve for Phanerozoic marine species. Paleobiology 17, 37–48 (1991).
- [24] Jablonski, D. Extinctions in the fossil record. Phil. Trans. R. Soc. Lond. B 344, 11–17 (1994).
- [25] Burlando, B. The fractal geometry of evolution. J. Theor. Biol. 163, 161–172 (1993).
- [26] Stork, N.E. & Lyal, C.H.C. Extinction or ‘co-extinction’ rates? Nature 366, 307, (1993).
- [27] Plotnick, R.E. & McKinney, M.L. Ecosystem organization and extinction dynamics. Palaios 8, 202–212 (1993).
- [28] Solé, R.V., Bascompte, J., & Manrubia, S.C. Extinction: Bad genes or weak chaos? Proc. R. Soc. Lond. B 263, 1407–1413 (1996).
- [29] Muñoz, M.A., Grinstein, G., & Tu Y.H. Survival probability and field theory in systems with absorbing states. Phys. Rev. E 56, 5101–5105 (1997).
- [30] Kerr, R.A. Does evolutionary history take million-year breaks? Science 278, 576–577 (1997).
- [31] Barabási A.-L. & Stanley H.E. Fractal Concepts in Surface Growth (Cambridge University Press, Cambridge, 1995).