[
Vortex Lattice Melting into Disentangled Liquid Followed by the 3D-2D Decoupling Transition in YBa2Cu4O8 Single Crystals
Abstract
A sharp resistance drop associated with vortex lattice melting was observed in high quality YBa2Cu4O8 single crystals. The melting line is well described well by the anisotropic GL theory. Two thermally activated flux flow regions, which were separated by a crossover line Bcr(T)=1406.5(1-T/Tc)/T (Tc=79.0 K, Bcr in T), were observed in the vortex liquid phase. Activation energy for each region was obtained and the corresponding dissipation mechanism was discussed. Our results suggest that the vortex lattice in YBa2Cu4O8 single crystal melts into disentangled liquid, which then undergoes a 3D-2D decoupling transition.
pacs:
74.60.Ge; 74.25.Fy; 74.72.Bk]
The vortex dynamics in the mixed state of high Tc superconductors (HTSCs) remains a subject of intense research because of its fundamental importance for physics of the vortex matter[2, 3, 4]. It was predicted theoretically[5, 6, 7] and confirmed experimentally[8, 9, 10, 11, 12, 13, 14, 15, 16] that, the vortex system undergoes a second order transition from a high temperature vortex liquid to a low temperature vortex glass or Bose glass in superconductors with strong disorders. In a clean superconductor a first order transition from vortex liquid to a well ordered vortex lattice occurs.
Vortex melting in high quality high Tc superconducting single crystals has been detected by various techniques including torsion oscillator[9], transport[10, 11], magnetization[12, 13], neutron scattering[14], spin rotation[15] and calorimetric measurements[16]. Central to the question of flux melting is: does the vortex lattice melt via a first order transition? How does disorder influence the melting transition[17]? It was found by Safar et al. [10] and by Kwok et al.[11] that the resistive transition of high quality YBa2Cu3O7 (Y123) single crystal showed a sharp discontinuity and that the transition exhibited a hysteric behavior. They attributed this phenomenon to flux melting. Although their explanation was questioned by Jiang et al.[18] who found that the hysteresis was not necessarily an indication for a melting transition, it could be resulted from a nonequilibrium behavior seen in the resistive transition. Subsequent magnetization[12, 13] and calorimetric[16] measurements convincingly proved that the melting transition was indeed a first order one, i.e., discontinuity in the internal energy at the melting temperature was observed. By doing simultaneous transport and magnetization measurements, Welp et al.[13] and Fuchs et al.[19] found that the temperatures, where the resistance jumped, coincided with the melting temperature obtained from magnetization measurements on Y123 and Bi2Si2CaCu2O8 (Bi2212) single crystals, respectively. The role of disorder in the melting transition has been checked by Kwok et al.[11] and by Fendrich et al.[20]. They found that strong pinning from twin boundaries or artificially introduced defects drove the first order melting transition into a second order glass transition.
Another important question related to the flux melting is how the melting propagates. Will the vortices lose their coherence along the c direction during the melting transition or will they keep the c-axis integrity and then lose it afterwards, at higher temperature, when thermal fluctuations destroy long range correlations along the c-direction[21]? This question has been recently pursued by employing the flux transformer configuration. The results remain still controversial. Lopez et al. and Fuchs et al. found a coincidence of the melting transition and decoupling one in Y123 and Bi2212 single crystals, respectively[22]. However, Wan et al. and Keener et al. did similar measurements on Bi2212 single crystals and concluded that the melting took place in a two stage fashion [23].
Previous studies of the vortex melting transition have been concentrated on Y123 and Bi2212 single crystals. Up to now, no detailed measurements on YBa2Cu4O8 single crystals have been reported. Meanwhile, the dissipation in the liquid state after the melting transition still remains to be clarified. The main purpose of this work is to show that in YBa2Cu4O8 single crystals, vortex lattice melts into liquid via a first order transition. It was also found that the liquid state after the melting transition could be separated into two regions which were governed by different dissipation mechanisms. Our results support the picture that the vortices first lose their transverse coherence at the melting temperature, this lose being followed by a disappearance of correlation in longitudinal direction at higher temperature.
YBa2Cu4O8 (Y124) single crystals were grown by travelling solvent floating zone method. The details for the single crystal growth were published elsewhere[24]. These single crystals are needle-like with typical dimensions of 1.20.30.05 mm3. Tc of the single crystals was about 76-78 K. Three single crystals were used for similar measurements. Each crystal was carefully cleaved to obtain optically flat surfaces with the c-axis normal to the sample surface. Gold wires were attached to the surface of crystal by using Pt epoxy. Then the crystal was heated in air at 100 ∘C for 1 hour, yielding a typical contact resistance below 0.5 . The resistance was measured by four-probe low frequency ac lock-in technique with an excitation current of 0.3 mA at 17 Hz in the ab plane. The magnetic field was generated by a 15 T Oxford superconducting magnet. The direction between the crystalline c-axis and the magnetic field was adjusted by rotating the sample holder with an accuracy of 0.2 ∘. The crystal we report on here had a Tc of 77.6 K and transition width of about 1.2 K at zero field.
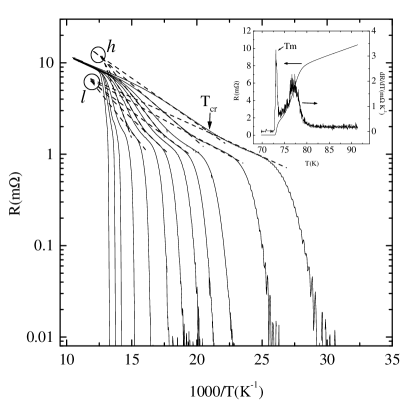
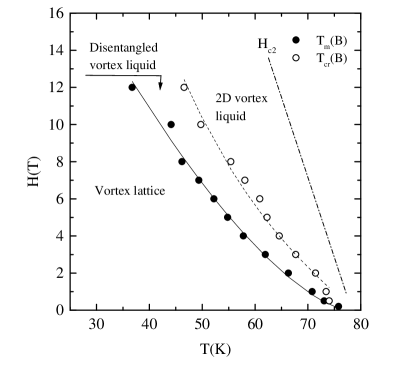
Fig.1 shows the Arrenhius plot for the temperature dependence of the resistance measured at different fields applied perpendicular to the ab plane up to 12 T. A sharp jump in the resistance R with a magnitude of R/R10% is clearly visible at each magnetic field. The magnitude of the resistive drop lies between those of Y123 (20%) and Bi2212 (0.5%), suggesting a possible dependence of the R(T) jump on the anisotropy of the materials since Y124 has an anisotropy between those of Y123 and Bi2212. We also observed small hysteresis in the resistive jump upon warming up and cooling down. We measured resistive transition at 4 T with different excitation currents of 0.1 mA, 0.3 mA and 1 mA, respectively. The R-T curves measured at 0.1 mA and 0.3 mA were essentially identical. However, that of 1 mA deviated from those of 0.1 mA and 0.3 mA. Similar hysteric resistance jumps were earlier observed on Y123 and Bi2212 single crystals and were attributed to a first order flux melting in clean superconductors[10, 11]. To quantify the melting transition, we determine the melting temperature Tm as the temperature where dR/dT vs. T plot shows a sharp peak. The inset in Fig. 1 demonstrates how the melting points Tm are determined. The obtained melting temperatures are plotted against the corresponding magnetic fields in Fig. 2. The melting line can be described by the empirical formula Bm(T)(1-T/Tc)α with the exponent between 1 and 2[9, 10, 11]. We find that the melting line is best fitted by Bm(T)=31.51(1-T/Tc)1.47, Tc=77.6 K being the transition temperature at zero field. This result agrees well with that obtained by Kwok et al.[11] who found Bm(T)=103(1-T/92.33)1.41 on Y123 single crystal when the field was applied parallel to c-axis.
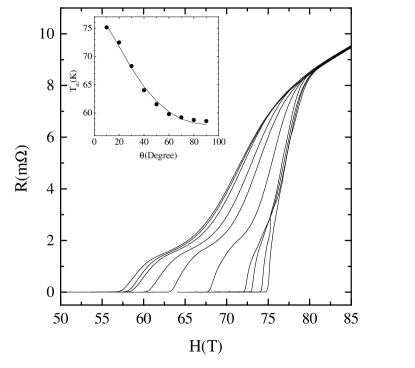
To check further an interpretation of the Bm(T) line in the framework of the vortex melting scenario, we measured the resistive transition with the magnetic fields applied at different angles to the ab plane, while fixing the field magnitude at 4 T. The angular dependence of the melting transition is shown in Fig.3 where clear resistance jumps can be seen at all the angles. It is interesting to note that at small angles (20∘, being the angle between ab plane and applied field), the resistive transition shows an anomalous behavior above the kink. This anomaly was more clearly visible in our flux flow measurements (R-B curves). Such kind of anomalous behavior could be due to the vortex tilting instability at large angles and under a magnetic field of a few Tesla which induces a competition between intrinsic pinning and vortex interaction. Following the same procedure, we have obtained the angular dependence of the melting transition temperatures at 4 T as shown in the inset of Fig. 3.
For a 3D vortex lattice, the melting transition occurs when the shear modulus goes to zero, which is determined by using a phenomenological Lindermann criterium, i.e., when the mean square root amplitude of the displacement of the vortex from its equilibrium position is larger than a certain portion of the lattice constant, where is the Lindermann number, being the vortex spacing. According to the theory for an anisotropic superconductor, Tm() has such a relationship as[7]
| (1) |
where , is the flux quantum, is the penetration depth in the ab plane and the anisotropy parameter. A best fit to the obtained data by using Eq. (1) with Å (Ref. 24) is achieved when =13.6, , which is shown as the solid line in the inset of Fig.3. Clearly a quite satisfactory result has thus been obtained. The value agrees very well with those reported by Safar et al.[10] and by Kwok et al.[11]. Considering the crystalline structures of Y123 (=7.7)[11], Y124 and Bi2212 (=50170)[26], we think that the anisotropy of =13.6 is a reasonable value.
As mentioned in the introductory part, in a clean layered superconductor, the melting line separates the vortex lattice phase at low temperatures from the vortex liquid phase above Bm(T). Depending on the temperature, magnetic field and strength of disorder, the vortex can be melted into a disentangled 3D line liquid or an entangled liquid[2, 27]. It is important to note that the melting transition is not necessarily a depinning transition, which means that vortex liquid can be pinned. The pinning force can arise from the residual pinning or from viscosity of the vortices. Due to the different dimensionality and vortex configurations involved in these various liquid states, the dissipation mechanisms should also be quite different. A useful information about the liquid state can be extracted by carefully analyzing the activation behavior of vortex liquid.
From Fig. 1 it is clearly seen that above the melting temperature, i.e. in the liquid state, there are two distinct parts where lnR shows a linear dependence upon 1/T with different slopes. This kind of behavior () is typical for thermally activated flux flow (TAFF) with an activation energy [28]. Such two separate TAFF regions with different activation energies have previously been observed by us on oxygen deficient Y123 thin films[28].
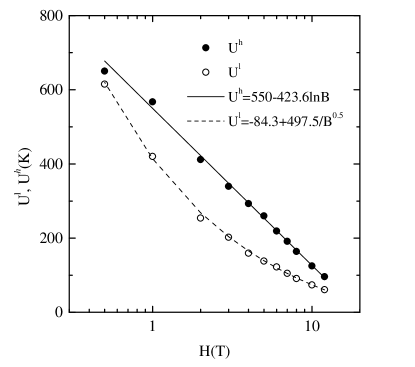
Using the same notations as in Ref. 27, we define the TAFF regions as region and region as shown in Fig.1. For each TAFF region, we extract the activation energies from the slopes of the Arrenhius plot. The obtained results are shown in Fig. 4. We find that the activation energy can be best fitted by and , respectively. Moreover, from a low temperature extrapolation of TAFF fit to region and a high temperature one for region , we obtain the temperatures which define the crossover from region to .
It was argued[2, 27] that the Abrikosov lattice could melt into a disentangled liquid under certain circumstances. As discussed by Geshkenbein et al. and by Vinokur et al., the dissipation in a disentangled liquid can be developed via plastic deformations of the vortices[29]. The activation energy is associated with the energy required to create a double kink in the vortex which is the free energy of two vortex segments along the ab plane with the length of , the average distance between the vortices. Using anisotropic Ginzburg-Landau theory, the barrier for this plastic movement can be estimated as
| (2) |
where is the vortex energy per unit length along the ab planes and . With (where ), an activation energy is predicted which is in qualitative agreement with our experimental data. To make an order of magnitude estimation of , we have used the above value for (=13.6) and Å, thus obtaining at 1 T, which agrees well with the experimental data.
As the temperature increases, due to the enhanced thermal fluctuations, an entanglement-disentanglement or 3D-2D decoupling transition should happen. Considering the high temperature, we think a 3D-2D decoupling is more likely. Daemen et al.[21] have calculated self-consistently the decoupling line for a Josephson coupled superconducting system. When the renormalization of the Josephson coupling by thermal fluctuations and static disorder are taken into account, the decoupling field is given by
| (3) |
for moderate anisotropy when , where s is the distance between the superconducting Cu-O planes ( Å for Y124)[25]. Since , we have . We find that the line we obtained above can be nicely fitted by Eq. (3). The fitted result is as shown in Fig. 2 by the dashed line.
As discussed in Ref. 27, the dissipation in the 2D liquid state is controlled by the plastic motion of pancake vortices which can be visualized as the generation of dislocation pairs. The typical energy for creating such a pair is
| (4) |
with . We note that Eq. (4) gives a (1-t)lnB dependence of as we have just observed. Inserting the values for s (10 ) and (2000 ), we find , in excellent agreement with our experimental data. The large prefactor derived from TAFF analysis for region suggests that the liquid in region is very viscous. Since a 2D pancake vortex liquid is just an extreme case for an entangled liquid, i.e., the entanglement length equals to . The entanglement increases the viscosity of vortex liquid and results in a larger activation energy, and thus a large prefactor.
Therefore, our results suggest feasibility of the following scenario: below , the vortices form a regular Abrikosov lattice. As the temperature increases, the lattice melts into a disentangled liquid, loses its transverse correlation while keeping the longitudinal one. The dissipation is governed by the generation of double kinks. Upon further warming, a 3D-2D decoupling transition sets in and the vortices lose their longitudinal coherence. The 2D vortices form very viscous liquid and the activation energy increases which follows a relationship.
In conclusion, we have shown that vortex lattice melting can also been observed in Y124 single crystals. The melting line can be well described by using anisotropic GL theory with a Lindermann constant . Two different liquid phases were observed which we think correspond to the disentangled liquid and the 2D pancake vortex liquid, respectively.
We thank E. Rossel and P. Wagner for their help during the measurements. This research has been supported by the Belgian IUAP and Flemish GOA and FWO programs.
REFERENCES
- [1] Present Address: Research Institute for Engineering Materials, Tokyo Institute of Technology, Nagatsuta 4259, Yokohama 226, Japan.
- [2] G. Blatter et al., Rev. Mod. Phys. 66, 1125(1994).
- [3] E. Brandt, Rep. Prog. Phys. 58, 1465(1995).
- [4] L. Cohen and H. Jensen, Rep. Prog. Phys. 60, 1581(1997).
- [5] M.P.A. Fisher, Phys. Rev. Lett. 62, 1415(1989). D.S. Fisher, M.P.A. Fisher and D.A. Huse, Phys. Rev. B 43, 130(1991).
- [6] D.R. Nelson and V.M. Vinokur, Phys. Rev. Lett. 68, 2398(1992); Phys. Rev. B 48, 13060(1993); A.I. Larkin and V.M. Vinokur, Phys. Rev. Lett. 75, 4666(1995).
- [7] D.R. Nelson, Phys. Rev. Lett. 60, 1973(1988); A. Houghton, R. Pelcovits and A. Sudb, Phys. Rev. B 40, 6763(1989). D.R. Nelson and H.S. Seung, Phys. Rev. B 39, 9153(1989); M. V. Feigelfman, V. B. Geshkenbein, and A.I. Larkin, Physica C 167, 177(1989).
- [8] R.H. Koch et al., Phys. Rev. Lett. 63, 1511(1989). C.J. van der Beek et al., Phys. Rev. Lett. 74, 1214(1995).
- [9] R.G. Beck et al., Phys. Rev. Lett. 68, 1694(1992)
- [10] H. Safar et al., Phys. Rev. Lett. 69, 824(1992); Phys. Rev. Lett. 70, 3800(1993);
- [11] W.K. Kwok et al., Phys. Rev. Lett. 69, 3370(1992); Phys. Rev. Lett. 72, 1088(1992); Phys. Rev. Lett. 72, 1092(1994).
- [12] E. Zeldov et al., Nature 375, 373(1995); R. Liang, D.A. Bonn and W.N. Hardy, Phys. Rev. Lett. 76, 835(1996).
- [13] U. Welp et al., Phys. Rev. Lett. 76, 4809(1996).
- [14] R. Cubitt et al., Nature 365, 407(1993).
- [15] S.L. Lee et al., Phys. Rev. Lett. 75, 922(1995).
- [16] A. Schilling et al., Nature 382, 791(1996).
- [17] E.A. Jagla and C.A. Balseiro, Phys. Rev. Lett. 77, 1588(1996); D. Domínguez, N Brnbech-Jensen and A.R. Bishop, Phys. Rev. Lett. 78, 2644(1997).
- [18] W. Jiang et al., Phys. Rev. Lett. 74, 1438(1995).
- [19] D.T. Fuchs et al., Phys. Rev. B 54, 796(1996).
- [20] J.A. Fendrich et al., Phys. Rev. Lett. 74, 1210(1995).
- [21] L.I. Glazman and A.E. Koshelev, Phys. Rev. B 43, 2835(1991); L. Daemen et al., Phys. Rev. Lett. 70, 1167(1993).
- [22] D. Lopez et al., Phys. Rev. Lett. 76, 4034(1996); D.T. Fuchs et al., Phys. Rev. B 55, 6156(1997).
- [23] Y.M. Wan, S.E. Hebboul and J.C. Garland, Phys. Rev. Lett. 72, 3867(1994); C.D. Keener et al., Phys. Rev. Lett. 78, 1118(1997).
- [24] J. Karpinski et al., Nature 336, 660(1988).
- [25] W.C. Lee and D.M. Ginsberg, Phys. Rev. B 45, 7402(1992); M. Xu et al., Phys. Rev. B 53, 15313(1996).
- [26] R. Doyle et al., Phys. Rev. Lett. 75, 4520(1995).
- [27] D.R. Nelson, in Phenomenology and applications of High Temperature Superconductors, edited by K. Bedell et al.(Addison-Wesley, New York, 1992).
- [28] X.G. Qiu et al., Phys. Rev. B 52, 559(1995).
- [29] V. Geshkenbein et al., Physica C 162-164, 239(1989); V.M. Vinokur et al., Phys. Rev. Lett. 65, 259(1990).