To be published in Comments on Condensed Matter Physics
Bridging the length and time scales: from ab initio
electronic structure calculations to macroscopic proportions
Paolo Ruggerone, Alex Kley, and Matthias Scheffler
Fritz-Haber-Institut der Max-Planck-Gesellschaft,
Faradayweg 4-6, D-14 195 Berlin-Dahlem, Germany
Abstract
Density functional theory (DFT) primarily provides a good description of the electronic structure. Thus, DFT primarily deals with length scales as those of a chemical bond, i.e. 10-10 meter, and with time scales of the order of atomic vibrations, i.e. 10-13 seconds. However, several interesting phenomena happen and/or become observable on different scales, namely meso- or macroscopic lengths and on time scales of seconds or even minutes. To bridge the gap between 10-13 seconds and a second or between 10-10 meter and 10 and more nano meters is one of the important challenges we are facing today. In this paper we show how we are overcoming these time and size problems for the example of crystal growth and the evolution of nano-scale structures. The key is a kinetic Monte Carlo approach with detailed input from DFT calculations of the relevant atomistic processes.
1 Introduction
Many, maybe most, interesting physical phenomena take place with meso- or macroscopic length scales and over times that range from seconds to minutes. For example, surface reconstructions sometimes evolve over a time period of seconds or even minutes, and the self-organization of nano-scale structures, such as for example quantum dots, also occurs over macroscopic times. Ab initio calculations (electronic structure, total energy calculations as well as molecular dynamics (MD) simulations) are concerned with length scales of a chemical bond and with times determined by interatomic force constants and the corresponding atomic vibrations. To bridge the gap from the atomistic processes to macroscopic dimensions is an important challenge. In this paper we show how we are coping with this issue for the example of crystal growth by means of a kinetic Monte Carlo (KMC) approach based on detailed input from density functional theory (DFT) calculations. This approach is able to describe the evolution of meso- and macroscopic growth shapes which may (see below) differ significantly from equilibrium shapes as determined by the minimum of the free energy.
The growth conditions, namely substrate temperature and deposition rate, and the presence or absence of surface defects and impurities play the relevant roles for crystal growth far from thermal equilibrium. For example, according to STM studies Pt islands on Pt (111) show fractal-like structures, triangular and hexagonal shapes at different substrate temperatures [1]. Moreover, different densities of Pt islands coexist on reconstructed and unreconstructed terraces on Pt (111) [2]. Furthermore, a small increase in the temperature produces a transition in the shape of Ag islands on Pt (111) from fractal to dendritic [3]. It is clear that a thorough knowledge of the atomistic processes occurring at surfaces during growth is a fundamental requirement for understanding these phenomena.
Our strategy for gaining insights into the interplay of microscopic processes in assembling mesoscopic structures is based on the combination of DFT calculations and KMC simulations. This approach is called the “ab initio kinetic Monte Carlo method” and proceeds in three steps:
-
1)
Analysis of all possibly relevant atomistic processes using DFT.
-
2)
Selection of the relevant atomistic processes and evaluation of their energy barriers and prefactors.
-
3)
A KMC study using the parameters determined in the second step.
The main risk of this approach lies in step 1), namely that an important process is overlooked. However, as step 1) may be combined with an ab initio molecular dynamics study, this risk is rather low. Altogether the ab initio KMC approach is able to describe the evolution of structures of 10, or 100, or more nano meters in dimensions, and to cover time scales of seconds. This is done without introducing any additional significant approximation than that of the exchange-correlation functional contained in the DFT step. Technical approximations, as for example supercell size and/or k-point summation, will be relevant as well, but these could (and should) be checked by performing the necessary tests.
The paper is organized as follows. In the next Section we will give a brief picture of processes involving an adatom that has landed on a substrate. In Section 3 we describe the main features of the “ab initio kinetic Monte Carlo method” (more details are contained in Ref. [4]). Section 4 contains our results for Al on Al (111) and, particularly, a discussion of the shapes of islands and their evolution with time.
2 Atomistic Processes
During growth an atom that reaches the surface, may either stay on the surface and wander around, form an island with other wanderers, or evaporate back into the gas phase. Under typical growth conditions the latter is a very rare process and can be neglected. Thus, we focus our attention on the wandering adatom that can be involved in several processes. These are schematically illustrated in Fig. 1. After deposition atoms can diffuse across the surface and will eventually form a small nucleus when they meet another adatom , or adatoms get captured by an already existing island or a step edge . Once an adatom has been captured by an island, it may either leave the island and return to the flat surface (reversible aggregation) or remain bonded to the island (irreversible aggregation). An atom that is bonded to an island may diffuse along its edge until it finds a favorable site . At low coverage of adsorbed material (say ), deposition on top of islands is insignificant and nucleation of islands on top of existing islands practically does not take place. However, if the step down motion is hindered by an additional energy barrier (often called Schwoebel-Ehrlich barrier [5]), nucleation of island on top of islands becomes likely , giving rise to rough surfaces. A negligible step-edge barrier favors an easy motion of an adatom from the upper to the lower terrace with a consequent growth of smooth films.
In principle it is possible that not just single adatoms but also dimers and bigger islands migrate . For example, a dimer might diffuse by the two atoms rotating around each other. Moreover, compared to a single adatom, a dimer may be less bounded to the substrate since the electrons of the two adatoms participate to the adatom-adatom bond and not only to the adatom-substrate bonds. Therefore, it may be expected a low activation barrier for the diffusion of dimers, but there is no clear evidence yet available.
In the case of surface diffusion we have assumed that an adatom hops from one binding site to another (hopping), but this is not the only way: An adatom may diffuse by atomic exchange where it changes place with a substrate atom and the ejected substrate atom moves further (exchange). This mechanism (first discussed by Bassett and Webber [6] and Wrigley and Ehrlich [7]) is actuated by the desire of the system to keep the number of cut bonds low along the diffusion pathway. On fcc (100) surfaces diffusion by atomic exchange was observed and analyzed for Pt [8] and Ir [9], and predicted for Al [10], Au, and strained Ag [11].
Diffusion along a step edge may also occur via the exchange mechanism as on the Al (111) surface. Since this system will be the object of our study, we add here a few more words. As illustrated in Fig. 2 on the (111) surface of an fcc crystal there are two different types of close-packed steps.
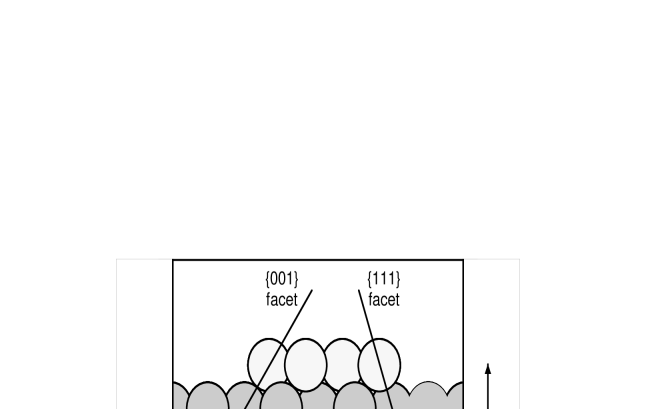
They are labeled according to their and facets, referring to the plane passing through the adatom of the step and the neighbor atom of the substrate (often these two steps are labeled A and B, respectively). On Al (111) DFT calculations [12] show that an adatom at the faceted step experiences a rather high diffusion barrier, if the mechanism would be hopping: Either it has to move over an ontop site of the substrate or to leave the step edge to finally reach an adjacent step edge position. Because this is energetically unfavorable, the system chooses an alternative: an in-step atom moves out of the step and the adatom fills the opened site. Thus, the coordination of all the particles does not decrease appreciably during the whole process, and the corresponding energy barrier is lower than that of the hopping process. Yet, the final geometry is indistinguishable from that of a simple hop. Along the facet the Al adatom prefers to jump since the associated path goes through a bridge position with a consequent lower activation energy than for an exchange. We will see that this difference will play an important role for understanding the shapes of the islands during growth.
The exchange process may also be energetically favored for the diffusion of an adatom from the upper to the lower terrace. As already mentioned, this diffusion through a normal jump may be hindered by an additional energy barrier at the step edge. Its origin can be understood in terms of a bond counting argument. From Fig. 3 it is clear that the atom moving to the right toward the step edge (black atom in the figure) breaks the bond with the terrace atom on its left before jumping down the step, but there is no terrace atom on its right to help the diffusion process in that direction. The absence of this bond generates a further increase in the energy barrier compared to this of an atom that wanders to the left away from the step. However, for the exchange mechanism the diffusion path is not affected by such a reduction of the bond number [cf. Fig. 3], and the activation barrier for the process may be lower than for the normal jump. For some metallic systems [for example, Al on Al (111) and Ag on Ag (100)] calculations [12, 13] have shown that the exchange mechanism is the favored situation for a step-down motion.
3 Ab initio Kinetic Monte Carlo
A severe problem in describing crystal growth is the time scale that it is too long for MD simulations. MD runs can provide important insight into elementary microscopic mechanisms but typically they can cover at most picoseconds, possibly some nanoseconds. Since growth patterns usually develop on a time scale of seconds, the inadequacy of MD is evident. Moreover, the growth structures involve large numbers of particles (from to ) far beyond the reach of MD (simulations with atoms are hardly feasible, and only for very short times). Instead, the method of choice for studying the spatial and temporal development of growth is KMC (for more details see Ref. [4], and references therein). The key idea behind KMC is to describe stochastic processes (such as deposition, diffusion, desorption, etc.) on the microscopic scales by rates usually given by:
| (1) |
Here, is an effective attempt frequency, the temperature, the Boltzmann constant, and is the energy barrier that needs to be overcome for the event to take place. In this way one avoids the explicit calculation of unsuccessful attempts, and KMC simulations therefore can describe phenomena with time scales of seconds. Furthermore, large systems can be treated without great difficulties. The basic procedure of a KMC simulation can be sketched as follows:
-
Determination of all processes that possibly could take place with the actual configuration of the system.
-
Calculation of the total rate , where the sum runs over the possible processes [see step 1)]. Deposition is accounted for in this description by the deposition rate
-
Choose two random numbers and in the range .
-
Find the integer number for which
(2) -
Let process to take place.
-
Update the simulation time with
-
Go back to step .
KMC simulations have been used to study crystal growth of semiconductors (e.g. [14]) and metals (e.g. [15]). However, most of these studies have been based on restrictive approximations. For example, the input parameters, such as activation barriers, have been treated as effective parameters determined rather indirectly, e.g. from the fitting of experimental quantities. Thus, the connection between these parameters and the microscopic nature of the processes may be somewhat uncertain. Often even the surface structure was treated incorrectly, i.e. the simulation was done on a simple quadratic lattice while the system of interest had an fcc or bcc structure. Despite these approximations such studies have provided significant qualitative quantitative insight into growth phenomena. The next better approach is to use semi-empirical calculations such as the embedded atom method or effective medium theory to evaluate the input parameters for KMC simulations of growth [16]. The best, but also most elaborate procedure to obtain these input parameters is to exploit the accuracy of DFT, and this is our approach.
A few words about the important atomistic processes. In view of our results for Al on Al (111), reviewed in Section 4, we consider the deposition of monoatomic species with sticking coefficient equal to one, and the process is quantitatively characterized by the deposition rate .
Concerning adatom diffusion Eq. (1) reflects the idea that an adatom experiences many stable and metastable sites at the surface, and that the diffusive motion brings it from one minimum to an adjacent one on the free energy surface in the configuration space spanned by the substrate and adatom coordinates. Eq. (1) shows that the two ingredients we need are the effective attempt frequency and the activation energy barrier . Both can be obtained by DFT calculations. The key quantity for the evaluation of is the potential energy surface (PES) which is the potential energy surface seen by the diffusing adatom. The PES is defined as:
| (3) |
where is the ground-state energy of the many-electron system (also referred as the total energy) at the atomic configuration . Here, are the coordinates of the adatom and represent the set of positions of the substrate atoms. According to Eq. (3) the PES is the minimum of the total energy with respect to the -coordinate of the adatom and all coordinates of the substrate atoms . Under the assumption of negligible vibrational effects, the minima of the PES represent stable and metastable sites of the adatom. Moreover, we consider the dynamics of the electrons and of the nuclei decoupled (Born-Oppenheimer approximation) that is usually well justified for not too high temperatures. We note that the results of a KMC study of growth will be the same as that of a MD simulation, provided that the underlying PES is the same; however, as pointed out above, KMC can handle significantly longer times.
Now consider all possible paths to get from one stable or metastable adsorption site, , to an adjacent one, . The energy difference between the energy at the saddle point along and the energy of the initial geometry is the barrier for this particular path. If the vibrational energy is small compared to , the diffusion barrier then is the minimum value of all of the possible paths that connect and , and the lowest energy saddle point is called the transition state. Although often only the path with the most favorable energy barrier is important, it may happen that several paths exist with comparable barriers or that the PES consists of more than one sheet (e.g. Ref. [17]). Then the effective barrier measured in an experiment or a molecular dynamics (MD) simulation represents a thermodynamic average over all possible pathways.
For calculating the second basic quantity, , Transition State Theory (TST) [18] provides a good framework. Within the harmonic approximation is proportional to the ratio between the products of the normal mode frequencies of the system with the adatom at the equilibrium site and at the saddle point. The normal mode frequencies are obtained by diagonalization of the force constant matrix for the system with the adatom at the equilibrium site and at the transition point. The force constant matrix reflects the interactions of the adatom with the substrate and can be derived from DFT calculations [17]. TST is only valid when is larger than . When this requirement is not fulfilled, the appropriate tool is Molecular Dynamics (MD). In several works the attempt frequency is assumed equal for all the processes with a value that lies in the range of the highest phonon vibration or the Debye frequency. However, this assumption may not be correct. First, processes with larger activation barriers may be characterized by a larger attempt frequency than processes with smaller energy barriers [19]. Moreover, processes that involve a different number of particles and different bonding configurations may also be characterized by different attempt frequencies. For examples, experimental analyses have given for exchange diffusion larger by up to two orders of magnitude than for hopping [20].
An important step in the description of growth is nucleation. This is the process by which two or more mobile adatoms meet and form a stable cluster. A cluster that is formed can suffer two main fates, provided that other mobile species are available. Either the cluster dissolves again into smaller constituents or it survives and ultimately grows, as more adatoms add to its periphery. In the second case the cluster acts as the initial nucleus for the growth of islands. If agglomerates of and more adatoms are stable against break-up, is called the size of the “critical nucleus” [21].
4 Results: Al/Al (111)
Having discussed the basic concepts (see Fig. 1) we describe the results obtained by combining the DFT results for Al on Al (111) obtained by Stumpf and Scheffler [12] with a realistic KMC simulation that takes into account the correct structure of the system. As already mentioned, the (111) surface of an fcc crystal is characterized by the presence of the two types of close-packed steps, shown in Fig. 2. Experimentally it has been shown that for Pt (111) [1] and Ir (111) [22] these two steps behave quite differently with respect to surface diffusion and growth. For Al (111) the DFT calculations [12] predict that the formation energies of the two steps are different with a lower energy cost for the formation of the faceted step than of the faceted step: 0.232 eV per atom vs. 0.248 eV per atom. Thus, the two steps have not the same equilibrium properties. What happens during growth far from equilibrium?
Stumpf and Scheffler [12] analyzed microscopic diffusion processes and in particular determined the activation energies for:
-
diffusion of a single adatom on the flat surface: = 0.04 eV;
-
diffusion from upper to lower terraces which was found to proceed by an exchange with a step-edge atom: = 0.06 eV for the {100} step and = 0.08 eV for the {111} step;
-
diffusion parallel to the {100} step via hopping: = 0.32 eV (0.44 eV for exchange);
-
diffusion parallel to the {111} step via exchange: = 0.42 eV (0.48 eV for hopping).
The DFT calculations give that the binding energy of two adatoms in a dimer is 0.58 eV [12], and we therefore assume that dimers, once they are formed, are stable, i.e., they will not dissociate and . Moreover, we assume that dimers are immobile. We note that the reported value for the self-diffusion energy barrier is rather low (0.04 eV) [12] and comparable to the energy of optical phonons of Al (111) ( eV). Since these phonon levels are highly populated at room temperature, simulations for 300 K may not be reliable because the concept of uncorrelated jumps between nearest neighbor sites is no more valid: In the reached site the adatom cannot cancel the correlation with the previous jumps since it stays there too shortly in order to be thermally equilibrated through the interaction with the substrate. We therefore limited our study to substrate temperatures K.
We adopt periodic boundary conditions, and our rectangular simulation area is compatible with the geometry of an fcc (111) surface. The linear dimensions of the simulation area range form 1700 Å to 3000 Å. These dimensions are a critical parameter, and it is important to ensure that the simulation area is large enough that artificial correlations of neighboring cells do not affect the formation of growth patterns. The mean free path of a diffusing adatom before it meets another adatom with possible formation of a nucleation center or is captured by existing islands is proportional to [23] where and are the diffusion constant on the flat surface and the deposition rate, respectively, and should be smaller than the linear dimension of the simulation array. Because of the fast diffusion of a single adatom Al on the flat (111) surface our cell is large enough (for the imposed deposition rate F = 0.08 ML/s) for K, whereas for K the dimensions of the cell are too small, and the island density is determined by the simulation array rather than the physics. Nevertheless, the island shape is determined by local processes (edge diffusions) and is still meaningful.
In the KMC program two additional insights extracted from the DFT calculations are included: the attractive interaction between steps and single adatoms, and the fact that diffusion processes take place via different mechanisms (hopping or exchange). Particularly the second point plays an important role in our investigation, as already mentioned in the Section 3: Processes as hopping and exchange may be characterized by different attempt frequencies [24].
Results of the ab initio KMC simulations are collected in Fig. 4 for a coverage of ML and = 50, 150, 200, and 250 K. With the substrate at = 50 K during growth the shape of the islands is highly irregular. Adatoms which reach a step cannot break away from it and they even cannot diffuse along the steps. Thus, at this temperature ramification occurs into random directions, and island formation can be understood in terms of the so-called hit and stick model (see also Ref. [25]). From Fig. 4 it appears that at a growth temperature = 150 K the islands assumes a triangular shape with their sides being {100} steps. Increasing the temperature to = 200 K a transition from triangular to hexagonal form occurs and for = 250 K the islands become triangular again. However, at this temperature they are mainly bounded by {111} steps. Another interesting aspect of the simulations is the appearance of a rough ordered arrangement of the islands obtained at low temperatures ( = 50 K and 150 K). This arrangement is a kinetic effect and reflects the fact that the average distance between neighboring islands is proportional to where depends on the size of the critical nucleus .
To understand the island shapes in the temperature regime between 150 and 250 K we consider the mobility of the adatoms along the steps (at such temperatures the adatoms at the step edges cannot leave the steps): The lower the migration probability along a given step edge, the higher is the step roughness and the faster is the growth normal to this step edge. Thus, this step edge shortens as a result of the growth kinetics and eventually it may even disappear. Since diffusion along the densely packed steps on the (111) surface (the {100} and {111} facets) is faster than along steps with any other orientation this criterion explains the presence of islands which are mainly bounded by {100} or {111} steps. The same argument can be extended to the diffusion along the two close-packed steps and applied to the triangular islands at = 150 K, where the energy barrier for the diffusion along the {111} facet is larger and thus the {100} steps survive so that triangular islands with {100} sides are obtained. By considering the energy barriers we would expect only these islands, until the temperature regime for the thermal equilibrium is reached.
However, the diffusion of adatoms is not only governed by the energy barrier but also by the attempt frequency [cf. Eq. (1)]. For Al/Al (111) the effective attempt frequencies have not been calculated, but the analysis of Ref. [12] proposes that the exchange process should have a larger attempt frequency than the hopping process. The results displayed in Fig. 4 are obtained with s-1 for the diffusion on the flat surface, s-1 for the jump along the {100} step, and s-1 for the exchange along the {111} step. These effective attempt frequencies are the only input of the KMC not calculated explicitly by DFT, but were estimated from the theoretical PES as well as from experimental data for other systems. In Fig. 5 the edge diffusion rates along the two steps are plotted as a function of the reciprocal temperature. At lower temperatures the energy barrier dominates the diffusion rate but at = 250 K the attempt frequencies start to play a role and lead to faster diffusion along the {111} facet than along the {100} one. Thus, the latter steps disappear and only triangles with {111} sides are present. The roughly hexagonally shaped islands at = 200 K are a consequence of the equal advancement speed for the two steps at that temperature. Obviously, the importance of the attempt frequencies should receive a better assessment through accurate calculations, and work in this direction is in progress. While no experimental data for Al/Al (111) are presently available we note that a similar sequence of islands as obtained above has been observed for Pt on Pt (111) by Michely et al. [1].
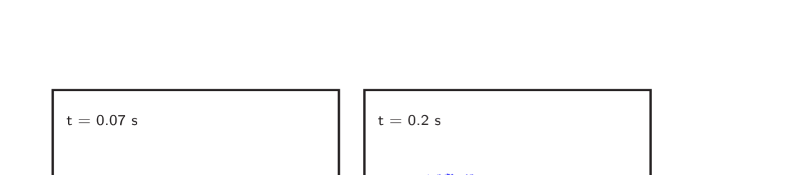
An interesting point is the evolution of the island shapes with time. This aspect is related also with a peculiarity of the triangular islands at = 250 K (cf. Fig. 4): They exhibit concave sides. In order to understand this behavior we have checked the island shape at different times for the deposition at = 250 K. The results are collected in Fig. 6. After s the islands are roughly hexagonal and upon successive deposition they evolve into a nearly triangular shape. The longer sides are formed by straight {111}-faceted step edges but short {100}-faceted edges can still be identified, at least for s. The latter edges become rougher and progressively disappear. Note that the development of a triangular island requires s. This time is remarkably long, provided that diffusion of adatoms on the flat surface is fast at = 250 K, and it confirms the need of a KMC approach for investigating in a reliable way the evolution of growth patterns. The shape of the island is the result of several processes with different time scales that are accounted for in the KMC scheme. A further confirmation of this collective action is given by the value of the temperature at which the advancement speeds for the two steps are practically equal. This corresponds at the crossing point of the two diffusion rates in Fig. 5 at = 250 K. From simulations this temperature is lower ( = 200 K). Going back to the time evolution, at s the sides are still nearly straight, but at s the concavities appear. The corners of the triangles seem to increase their rate of advancement during deposition. The effect can be understood on the basis of competition between adatom supply from the flat surface and mass transport along the sides. The adatom concentration field around an island exhibits the steepest gradient close to the corners, and the corners of the islands receive an increased flux of adatoms. When the sides of the islands are not too long, this additional supply of adatoms is compensated by the mass transport along the steps, i.e., the adatoms have a high probability to leave the region around the corners before the arrival of the successive adatom. For s this scenario still seems to be true, while at s the island edges are longer and the mass transport along the sides is not able to compensate the additional supply of particles at the corners. This means that the probability for a particle to leave the corner region and to move along the island edge before being reached by another particle decreases considerably, and the corners start to grow faster than the sides of the triangles so that the concave shape develops.
In summary, we have shown how detailed microscopic information can be combined with KMC simulations in order to gain insight in the time evolution of the structures assembled during growth. As we have shown for Al on Al (111), islands modify their shapes when the substrate temperature is changed, and the origin of these transitions lies in the microscopic nature of the diffusion processes occurring onto the surface. Moreover, growth patterns may develop on a time scale of seconds that cannot be reached with MD simulations, and the ab initio KMC approach seems to be a very powerful tool to overcome size and time limitations without loosing the microscopic description or accuracy.
5 Acknowledgments
We thank Christian Ratsch (Berlin) for many valuable discussions. One of the authors (P.R.) thanks D.E. Wolf (Duisburg) for the kind hospitality and the useful discussions during his stay at the HLRZ in Jülich.
References
- [1] T. Michely, M. Hohage, M. Bott, and G. Comsa, Phys. Rev. Lett. 70, 3943 (1993).
- [2] M. Hohage, T. Michely, and G. Comsa, Surf. Sci. 337, 294 (1995).
- [3] H. Brune, C. Romalnczyk, H. Röder, and K. Kern, Nature 369, 469 (1994).
- [4] P. Ruggerone, C. Ratsch, and M. Scheffler, in The Chemical Physics of Solid Surfaces, vol. 8, Eds. D.A. King and D.P. Woodruff (Elsevier Science, Amsterdam, 1997), p. 490.
- [5] G. Ehrlich and F.G. Hudda, J. Chem. Phys. 44, 1039 (1966); R.L. Schwoebel and E.J. Shipsey, J. Appl. Phys. 37, 3682 (1966).
- [6] D.W. Bassett and P.R. Webber, Surf. Sci. 70, 520 (1978).
- [7] J.D. Wrigley and G. Ehrlich, Phys. Rev. Lett. 44, 661 (1978).
- [8] G.L. Kellog and P.J. Feibelman, Phys. Rev. Lett. 64, 3143 (1990).
- [9] C. Chen and T.T. Tsong, Phys. Rev. Lett. 64, 3147 (1990).
- [10] P.J. Feibelman, Phys. Rev. Lett. 65, 729 (1990).
- [11] B.D. Yu and M. Scheffler, submitted to Phys. Rev. Lett.
- [12] R. Stumpf and M. Scheffler, Phys. Rev. Lett. 72, 254 (1994); ibid. 73, 508 (1995)(E); Phys. Rev. B 53, 4958 (1996).
- [13] B.D. Yu and M. Scheffler, Phys. Rev. Lett. 77, 1095 (1996); Phys. Rev. B 55, 13916 (1997).
- [14] A. Madhukar, Surf. Sci. 132, 344 (1983); S. Clarke and D.D. Vvedensky, Phys. Rev. Lett. 58, 2235 (1987); H. Metiu, Y.-T. Lu, and Z. Zhang, Science 255, 1088 (1992).
- [15] M.C. Bartelt and J.W. Evans, Phys. Rev. Lett. 75, 4250 (1995); Z. Zhang, X. Chen, and M. Lagally, Phys. Rev. Lett. 73, 1829 (1994); J.G. Amar and F. Family, Phys. Rev. Lett. 74, 2066 (1995); S.V. Khare, N.C. Bartelt, and T.L. Einstein, Phys. Rev. Lett. 75, 2148 (1995).
- [16] S. Liu, Z. Zhang, G. Comsa, and H. Metiu, Phys. Rev. Lett. 71, 2967 (1993); J. Jacobsen, K.W. Jacobsen, P. Stolze, and J.K. Nørskov, Phys. Rev. Lett. 74, 2295 (1995); Z.-P. Shi, Z. Zhang, A.K. Swan, and J.F. Wendelken, Phys. Rev. Lett. 76, 4927 (1996); S. Liu, L. Bönig, J. Detch, and H. Metiu, Phys. Rev. Lett. 74, 4495 (1995).
- [17] A. Kley, P. Ruggerone, and M. Scheffler, Phys. Rev. Lett., in press.
- [18] G.H. Vineyard, J. Phys. Chem. Solids 3, 121 (1957); G. Wahnström, in Interaction of Atoms and Molecules with Solid Surfaces, eds. V. Bortolani, N.H. March, and M.P. Tosi (Plenum Press, New York and London, 1990), p. 529.
- [19] G. Boisvert, L.J. Lewis, and A. Yelon, Phys. Rev. Lett. 75, 469 (1995).
- [20] G. Ayrault and G. Ehrlich, J. Chem. Phys. 60, 281 (1974); S.C. Wang and G. Ehrlich, Phys. Rev. Lett. 62, 2297 (1989); G.L. Kellog, Surf. Sci. 246, 31 (1991).
- [21] C. Ratsch, A. Zangwill, P. Šmilauer, and D.D. Vvedensky, Phys. Rev. Lett. 72, 3194 (1994); C. Ratsch, P. Šmilauer, A. Zangwill, and D.D. Vvedensky, Surf. Sci. 329, L599 (1995).
- [22] S.C. Wang and G. Ehrlich, Phys. Rev. Lett. 67, 2509 (1991)
- [23] S. Stoyanov and D. Kashchiev, in Current Topics in Material Science, ed. E. Kaldis (North-Holland, Amsterdam, 1981), vol. 7, p. 69.
- [24] C.L. Liu, J.M. Cohen, J.B. Adams, and A.F. Voter, Surf. Sci. 253, 334 (1991).
- [25] T.A. Witten and L.M. Sander, Phys. Rev. Lett. 47, 1400 (1981); Phys. Rev. B 27, 5686 (1983).