[
Evidence of Microscopic-Scale Modifications in Optical Glasses Supporting Second Harmonic Generation
Abstract
We explore, by means of inelastic neutron scattering, the extent of changes in dynamic correlations induced by thermal poling of vitreous . The measured vibrational density of states shows an excess of modes in certain frequency regions as well as a narrowing of the 100 meV peak. These findings indicate that such alterations cannot be ascribed to the appearance of new well defined vibrational modes, such as those coming from localized topological defects, but rather arises from an increase in ordering in the material as attested in a reduced spread of the inter-tetrahedral angles.
pacs:
PACS numbers: 42.70,42.65.Ky,63.50.x,78.20.e]
The ability of optical glass fibers to generate visible (green) light via Second Harmonic Generation (SHG) of intense infrared pump light remained unexplained for a long time since the first experimental detection of the phenomenon in 1985 [1]. Two main reasons made such phenomenon unexpected. Firstly, a fundamental principle derived on symmetry grounds for the second-order susceptibility tensor [2], forbids SHG in an isotropic material, such as amorphous silica. Secondly, a well defined phase matching between the interacting waves is required to allow constructive interference leading to efficient SHG. Even if some symmetry breaking mechanism is assumed, the way in which phase matching waves was automatically forced appeared as almost a “miracle”. The puzzle was essentially solved five years later by Dianov et al. [3] by invoking the emergence of a spatially modulated local dc field, , which, via third-order nonlinearity (), induces a spatially modulated second order nonlinearity (). This so called Electric Field Induced Second Harmonic Generation (EFISHG), which is responsible for the frequency doubling, relies on a third order nonlinearity which is finite in structurally isotropic materials. The dc field is induced by photocurrents originated from ionization of color centers associated with impurities in the glass structure. In the simplest model [3], quantum interference between two and one photon ionization leads to a modulation of the current, resulting in a phase matching (or more properly, quasi-phase matching). Under such conditions the symmetry is broken by the local dc field and no significant changes in the structure are needed.
Given the obvious technological interest of the phenomenon, a substantial effort has been focused towards the achievement of a permanent and to improve the SHG efficiency in glass. Nowadays, the so called thermal poling technique, which consists in applying high voltage ( 5 kV) at elevated temperatures () is able to provide figures for SHG conversion comparable to those shown by some inorganic crystals [4]. It is also possible to implement quasi-phase matching efficiently in periodically thermally poled fibers [5].
Contrary to what could be expected, there is a lack of studies carried out by direct means on structural and/or dynamical alterations associated with poling. Most are either macroscopic [6] or mesoscopic [7] in nature, rendering scarce information of the underlying microscopic physics. Up to now, probably the most direct investigation of the phenomenon comes from Raman spectroscopy studies [8, 9, 10]. In fact, significant changes between treated (photoinduced) and untreated fibers were observed at rather well defined frequencies and associated with changes in the density of topological “defects” in the glass structure. Such structural modifications were assigned as the main microscopic symmetry-breaking mechanism leading to SHG [8, 11]. A direct interpretation of the Raman data is, however, hampered by the need of previous knowledge of the possible structural alterations in order to properly assess the concomitant variations in the intricate couplings between the optical waves and electronic clouds governing the signal intensities. As a matter of fact, the aforementioned defects model cannot completely explain all the experimental results [6]. In spite of this, however, it is sometimes presented in the literature as the way of explaining the phenomenon.
Our aim here is to investigate the microscopic mechanisms leading to the appearance of the second-order non-linear optical response in poled glass, using for the purpose a beam of thermal neutrons as a probe which directly couples to the nuclei. We thus carried out a set of inelastic neutron scattering (INS) measurements of the generalized frequency spectrum (also referred as vibrational density of states) covering the frequency range where previous reports from optical spectroscopies found measurable differences between untreated and poled samples.
We have chosen to work with thermally poled samples (nowadays probably the most promising poling technic in regarding possible technological applications). The samples used in the experiments were made of electrically-fused quartz (Infrasil from Heraeus) with dimensions mm. The thickness (m) was chosen to be the smallest compatible with the polishing in order to increase the ratio poled volume versus unpoled volume. In fact, after thermal poling [4], the nonlinearity is located in a region m deep under the anodic surface independently of the sample thickness, so that it is evident the convenience of using thin samples. A ratio of poled/unpoled material of was estimated. The thermal poling was carried out at with an applied dc voltage of kV for 40 minutes. The poled sample consisted in fifteen plates stacked together. For comparison a similar stack of unpoled samples was used.
The INS experiments were carried out on the MARI chopper spectrometer at the ISIS pulsed neutron source at the Rutherford Appleton Laboratory, Oxfordshire (UK). The spectrometer operates in direct geometry mode, that is the wavelength (energy) of the incident neutron pulse is monochromatized by a set of three rotating devices (choppers) which select neutrons having the required velocity. The energy and momentum analysis of the outgoing neutrons, after scattering from the sample, is carried out by means of time-of-flight measurements once neutrons are detected by a large array of counters which span a large angular range. Two different incident energies were used (220 meV and 150 meV) which enabled the coverage of kinematic ranges with different resolution in energy-transfers (the achieved resolution varies as a smooth function of , being typically of a few per cent). In all the experiments the samples were kept at 20 K in order to reduce the multiple-phonon contribution to the spectrum, a quantity which becomes substantial in measurements of this kind performed at room temperature. The quantity which is directly accessible to a neutron scattering experiment is the double-differential () scattering cross-section given in units of barns meV-1 Sterad-1. For a macroscopically isotropic material such as a glass, the quantity of utmost importance to specify the dynamics is the spectral frequency distribution (or vibrational density of states). For samples where the dominant neutron-nucleus scattering is of incoherent nature, derivation of from the measured cross-section only involves a few corrections. In the case of silica, where scattering from Si and O nuclei gives rise to coherent (interference) effects, the derivation of from the measured data becomes more elaborated. A number of schemes for averaging-out the coherent effects have been developed and are known to lead to reliable estimates of the spectrum. In our particular case we have adopted a procedure described in detail in Ref. [12] which is based on a phonon expansion of the dynamic structure factor and consists in an iterative scheme designed to correct a number of instrumental and sample-dependent (multiphonon) effects. On the other hand, having a coherently-scattering sample is here an additional bonus rather than a nuisance. In fact, the single-differential scattering cross-section derived by integration over energy-transfers of the measured response is directly proportional to the static structure factor and therefore some hints of structural modifications could possibly be derived from the same set of experimental data. Besides, the wavevector dependence of at a given energy transfer provides direct information about the phase relationships of the motion of specific atomic pairs [13], since the Fourier transform of ctant.) is a dynamical pair correlation function ctant.) which serves to identify the atoms taking part in motions at such frequency as well as their relative phases.
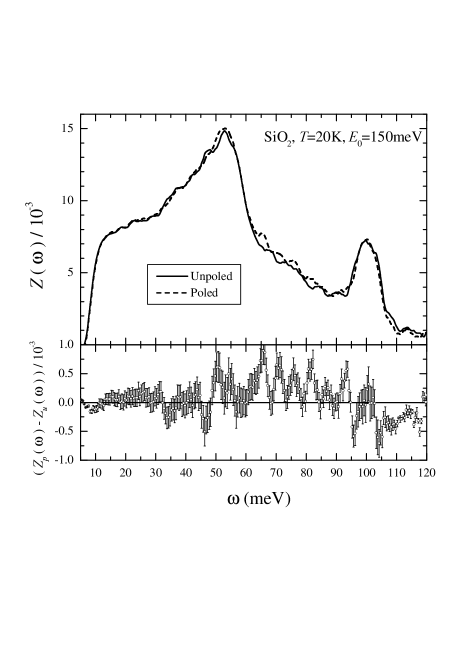
Figure 1 displays a comparison between spectral distributions for the virgin (untreated) and poled samples up to a frequency of 120 meV (). As stated above, such a range comprises the one where the Raman studies reported changes induced by poling. A measurable difference in between the poled and unpoled glasses is readily seen for frequencies about 53 meV (), a band comprising 60 meV () 95 meV () and the peak at 100 meV (). Notice that only 5% of the sample was really poled and therefore the changes are correspondingly scaled down. As can be seen from the lower frame of the graph, the differences are outside error bars and this supports the statistical significance of such findings. The measurements carried out using a larger incident energy (220 meV) confirmed the above mentioned changes and enabled the exploration of the spectral region extending up to 180 meV (), which comprises the strong double-peak structure [13] with maxima at about 135 meV () and 150 meV (). Feeble changes were found within that range of frequencies. However, the lower resolution and statistics prevents to discriminate a reasonably clear difference and therefore, our ensuing discussion will only concern alterations below 110 meV.
To compare the present results with the previous Raman studies, an analysis of the as customary in the Raman literature [14] seems in order. It is based on the band-edge normal modes of a simple analytical model, i.e., a continuous random network of tetrahedra with only central forces [15]. The stronger peak at 53 meV corresponds to the so called mode and is portrayed as a vibration where the oxygens undergo a symmetric stretch whereas the Si atoms are still. The well defined feature at 100 meV would then correspond to the mode where all atoms move and the pair of higher frequency peaks are assigned as arising from LOTO splitting, the higher frequency (150 meV) being identified with the vibration. The model is supplemented by two “defect” modes associated with threefold and fourfold planar rings of SiO bonds in order to explain the so called D1 and D2 narrow Raman lines.
In spite of giving a neat interpretation of many of the Raman spectrum features, the above picture seems fairly oversimplified for the far broader shapes of the INS spectra (which contrary to the Raman do not depend upon intricate coupling-coefficients obeying selection rules). In particular, and central to our case, the D1 and D2 lines cannot be easily identified with clear features in the INS spectra. Instead, a broad irregular structure appears between 60 meV and 85 meV as shown in Figure 1 (also present in previous experiments [16]). From computer simulations using realistic potentials for the interparticle interactions [17], we know that in this frequency range, where the material response is modified by poling, the vibrational dynamics still shows substantial “collective” character, even if what is left at such high frequencies can only be considered as remnants of the long-wavelength phonons which become at these scales heavily damped and hybridized with vibrations of “optical” character. These observations are in contrast with the highly localized modes of the ring-like topological “defects” model. From this new perspective, no structural changes are necessarily implied as the local dc fields are expected to be very high (near the dielectric breakdown value) and the driving of the electronic clouds on the nuclei could well affect their mesh of vibrational dynamics with negligible perturbations on their equilibrium positions.
In addition, two more spectral features are clearly affected by the poling, i.e., the increase in the intensity of the broad peak centered at 53 meV and the narrowing of the 100 meV peak. It is not clear whether the former has been detected in the Raman experiments on photoinduced poling. In Ref. [9] very clear periodic changes in the intensity at 53 meV were observed when a micro Raman was scanned along the fiber but they completely disappeared after averaging. This suggests a modulation of the Raman signal due to changes in the optical wave-electron coupling induced by the dc grating rather than changes in the vibrational density of states itself. For instance, periodic birefringence caused by the grating would affect the Raman intensity at 53 meV as it is strongly polarization dependent. Anyhow, our INS spectra are free from this uncertainty and certainly an increase in the 53 meV intensity is apparent. A recent analysis [18] shows how disorder alters the peak heights of the density of modes owing to coupling between close enough modes. Whether this gives rise to an increase or a decrease depends on the specific case. The observed enhancement of the 50 meV peak could then signal a change in order. Given the high anisotropic nature of the poling process, one would expect an increase in ordering. Such a picture is strongly supported by the narrowing of the 100 meV peak (not reported in the Raman experiments). The fact that ordering should produce narrowing is not only physically very plausible, but is also supported by calculations. Indeed, the results of Ref. [18] predict such an effect too. More explicitly, Bethe lattice calculations demonstrate that the main effect of a reduction on the spread of the inter-tetrahedral angle distribution is a narrowing of the 100 meV peak [14], precisely the most intuitive kind of ordering that would be expected from the thermal poling process. It remains an open question whether such ordering is a significant contribution to the measured optical second order nonlinearity.
In summary, inelastic neutron scattering is capable of monitoring the alterations occurring in fused silica at a microscopic level after the material is submitted to thermal poling. From the present data (the vibrational density of states) two main conclusions may be inferred. Firstly, the modifications in a frequency range encompassing the so called D1 and D2 Raman lines are consistent with dynamical alterations involving rather large groups of atoms. This finding is in contrast with the highly localized features expected from a creation of three-fold and four-fold ring-like “defects” sometimes assumed as possible cause of the second order nonlinear optical response. Secondly, alterations around 53 meV and particularly at 100 meV strongly suggest a higher order in the treated material implying a reduced spread in the inter-tetrahedral angle distribution. Further studies are needed to clarify whether these changes can justify the value of second-order nonlinearities measured after poling.
I Acknowledgments
Work supported in part by grants No. TIC95-0563-C05-03, No. PB96-00819, CICYT, Spain, and Comunidad de Madrid 06T/039/96. V. Pruneri and F. Samoggia acknowledge Pirelli Cavi (Italy) for their fellowship and studentship respectively.
REFERENCES
- [1] U. Osterberg, W. Margulis, Opt. Lett. 11, 516 (1986).
- [2] A. Yariv, P. Yeh, Optical waves in crystals, Wiley, 1984, p. 504.
- [3] E.M. Dianov, P.G. Kazansky, D.Yu. Stepanov, Sov. Lightwave Commun. 1, 247 (1991).
- [4] R. A. Myers, N. Mukherjee and S. R. J. Brueck, Opt. Lett. 16, 1732 (1991).
- [5] V. Pruneri and P. G. Kazansky, Electronics. Lett. 33, 318 (1997).
- [6] V. Mizrahi et al., Opt. Lett. 13, 279 (1988).
- [7] W. Margulis, F. Laurell, B. Lesche, Nature 378, 699 (1995); P. G. Kazansky et al., Appl. Phys. Lett. 68, 269 (1996).
- [8] J.M. Gabriagues, H. Fevrier, Opt. Lett. 12, 720 (1987).
- [9] A. Kamal, D. A. Weinberger and W. H. Weber, Opt. Lett. 15, 613 (1990).
- [10] I.V. Alekandrov, Z.N. Nesterova and G.T. Petrovskii, J. Non-Cryst. Solids, 167, 117 (1994).
- [11] R. H. Stolen and H. W. K. Tom, Opt. Lett. 12, 585 (1987).
- [12] J. Dawidowski, F.J. Bermejo, R. Fayos, R. Fernández Perea, S.M. Bennington, A. Criado, Phys. Rev. E 53, 5079 (1996).
- [13] J.M. Carpenter and D.L. Price, Phys. Rev. Lett. 54, 441 (1985); M. Arai et al., Trans. Am. Cryst. Assoc. 27, 113 (1991).
- [14] F.L. Galeener in Disorder in Condensed Matter Physics, J.A. Blackman and J. Tagüea (Eds.), Oxford Science Publications, The Clarendon Press, Oxford, 1991, p. 45.
- [15] P. N. Sen and M. F. Thorpe, Phys. Rev. B 15, 4030 (1977).
- [16] M. Arai et al., Physica B 180 & 181, 779 (1992).
- [17] S.N. Taraskin and S.R. Elliot, Europhys. Lett. 39, 37 (1997).
- [18] M. Marinov, N. Zotov and L. Konstantinov, Z. Phys. B 101, 219 (1996).