[
Properties of the Bose glass phase in irradiated superconductors
near the matching field
Abstract
Structural and transport properties of interacting localized flux lines in the Bose glass phase of irradiated superconductors are studied by means of Monte Carlo simulations near the matching field , where the densities of vortices and columnar defects are equal. For a completely random columnar pin distribution in the -plane transverse to the magnetic field, our results show that the repulsive vortex interactions destroy the Mott insulator phase which was predicted to occur at . On the other hand, for ratios of the penetration depth to average defect distance , characteristic remnants of the Mott insulator singularities remain visible in experimentally accessible quantities as the magnetization, the bulk modulus, and the magnetization relaxation, when is varied near . For spatially more regular disorder, e.g., a nearly triangular defect distribution, we find that the Mott insulator phase can survive up to considerably large interaction range , and may thus be observable in experiments.
pacs:
PACS numbers: 74.60.Ge, 05.60.+w]
I Introduction
The remarkably rich phase diagram of magnetic flux lines in high- superconductors, especially when subject to point and/or extended disorder, has attracted considerable experimental and theoretical interest. [1] For the purpose of applying type-II superconductors in external magnetic fields, an effective vortex pinning mechanism is essential, in order to minimize dissipative losses caused by the Lorentz-force induced movement of flux lines across the sample. This issue becomes even more important for the high- superconductors, because the strongly enhanced thermal fluctuations in these materials render the Abrikosov flux lattice unstable. Thus, well below the upper critical field , there occurs a first-order melting transition leading to a normal-conducting flux liquid phase. [2] It turns out to be rather difficult to pin such a vortex liquid consisting of strongly fluctuating flexible lines by just intrinsic point disorder (e.g., oxygen vacancies), although asymptotically a truly superconducting low-temperature vortex glass phase was predicted. [3]
Therefore, in addition to point defects, the influence of extended or correlated disorder, promising stronger pinning effects, on vortex transport properties has been considered. Experimentally, linear damage tracks have been produced in oxide superconductors by irradiation with high-energy heavy ions. These columnar defects serve as strong pinning centers for the flux lines, by significantly increasing the critical current and shifting the irreversibility line upwards (see Ref. [[1]], Sec. IX B for references). Theoretically, the statistical mechanics problem of directed lines interacting with columnar pins can be mapped onto the quantum mechanics of two-dimensional bosons subject to static point disorder via the identification of the vortex trajectories with particle world lines in imaginary time [2, 4, 5, 6]. In this mathematical analogy, thermal fluctuations map onto quantum fluctuations , the vortex line tension represents the boson mass, and the sample thickness along the direction parallel to the magnetic field corresponds to the inverse temperature of the quantum system (such that the thermodynamic limit implies zero temperature for the fictitious bosons). The boson picture can then be employed to immediately construct the expected phase diagram for flux lines interacting with columnar defects, as depicted in Fig. 1, [5, 6] and its properties can be analyzed by utilizing the (scaling) theory of bosons subject to static point disorder. [7]
At high temperatures (and in the thermodynamic limit , i.e., for thick samples [8]), one thus finds an entangled liquid of unbound flux lines (corresponding to a boson superfluid), separated by a sharp second-order transition from a low-temperature phase of localized vortices. This Bose glass phase is characterized by an infinite tilt modulus , and turns out to be stable over a certain range of tipping angles of away from the direction (transverse Meissner effect). [6] At low temperatures in the Bose glass, the dominant vortex transport mechanism for low external currents is expected to be the analog of variable-range hopping in disordered semiconductors, [9] namely the formation of double kinks extending from one columar defect to another energetically favorable, but not necessarily adjacent pinning site. [6] Therefore the actual distribution of pinning energies constitutes an important feature of the system that determines its low-energy current-voltage (I-V) characteristics. As in the case of doped semiconductors, [9, 10, 11] long-range repulsive interactions drastically modify the distribution of pinning energies, which is the analog of an (interacting) density of states, and may lead to the emergence of a correlation-induced soft “Coulomb gap” separating the filled and empty states. [12] This effect in turn reduces vortex transport in the variable-range hopping regime considerably. Recent experiments have indeed identified the characteristic signatures of variable-range hopping processes in irradiated superconductors. [13, 14, 15, 16]

At least for weakly interacting flux lines, the theory also suggests a low-temperature Mott insulator phase, occurring when , i.e., the vortex density exactly matches that of the columnar damage tracks. [6] In this situation, all the defects will be occupied by one vortex each, and the introduction of another flux line into the system will require the typical pinning energy (provided the repulsive vortex interactions are negligible — weak repulsive forces will slightly increase this energy cost). Consequently, upon increasing the external field , one expects a “lock-in” effect at , where the internal field remains constant until this energy barrier is overcome, as shown in Fig. 2 (see also Refs. [[17, 18, 19, 20]]). The Mott insulator phase is therefore characterized by a hard gap in the distribution of pinning energies. [6] Correspondingly, the (reversible) magnetization should display a sharp downward jump exactly at ; this can also be seen from the relation , where is the total Gibbs free energy of the system, here dominated by the internal energy , which increases abruptly at as a new vortex enters the sample. The Bose glass and the Mott insulator represent distinct thermodynamic phases, for the latter should be characterized by an infinite tilt modulus , and a diverging compressional modulus . Characteristic minima in the reversible magnetization near the matching field were indeed observed experimentally at low temperatures in single-crystal Tl compounds, [17] and both BSCCO tapes [21] and single-crystals. [22] Furthermore, pronounced minima in the magnetization relaxation at were reported for YBCO single crystals, [23] and for and in a Tl compound, [24] and interpreted as further evidence for vortex “lock-in” behavior characteristic of the Mott insulator phase.


One of the main results of our numerical study will be, however, that the original predictions of a distinct thermodynamic Mott insulator phase are, strictly speaking, applicable only in two limiting cases: (i) For short-range interactions, i.e., when the London penetration depth is considerably smaller than the average defect spacing , and the sole effect of the intervortex repulsion is to prevent double occupancy of columnar pins; but it cannot prevent all the defect sites, even for a spatially random distribution of pinning centers, to be filled with vortices. (ii) For a regular array of columnar defects, e.g., a triangular or square lattice, for which because of the spatial symmetry the interactions merely lead to a constant additive renormalization of the pinning energies, equal for all defect lattice sites. In all intermediate cases, i.e., a disordered spatial defect distribution and a sizeable interaction range , one has to expect that it will be impossible to fill the columnar pins completely. For, the occupation of very close pins will be energetically costly as compared to moving a vortex into a high-symmetry “interstitial” position, at maximum distance from neighboring defect sites. Thus, a departure from both situations (i) and (ii) by either increasing the interaction strength and range, or introducing disorder into the defect configuration, will lead to a softening of the ideal Mott insulator hard gap in the distribution of pinning energies, and smear the corresponding singularities in the free energy , magnetization , and bulk modulus . In the thermodynamic sense, the Mott insulator does therefore not exist as a distinct phase in typical experimental situations. On the other hand, if is not too large, we shall find that very characteristic remnants of the Mott insulator singularities appear in measurable quantities, and we shall indeed be able to explain why and in which direction these maxima or minima are shifted away from , as experimentally observed. [25] Also, recently regular arrays of columnar defects have been produced in high- materials, [26] and in these more artificial samples the Mott insulator phase might play a much more prominent role.
Another important effect of the vortex interactions leads to the distinction of a strongly and a weakly pinned regime, respectively, within the Bose glass phase. [6, 18, 27] For short-range interactions , or for larger , but low filling , the vortices will be strongly bound to the columnar defects, in the latter situation because of the collective “Coulomb gap” correlation effects which render the transfer of a flux line to another equally favorable site extremely unlikely. [12] In the other extreme case, namely at large fillings and for very strong interactions, the pinning potentials actually constitute a rather weak perturbation of the strongly correlated vortex system (with the flux lines arranging themselves as closely as possible to a triangular lattice), and the entire system can be shifted easily through the application of an external current. However, there should also be an intermediate weakly pinned Bose glass regime around the matching field, where some of the flux lines are bound to the strong pinning sites, and the others are held in place through their mutual repulsive interactions with adjacent vortices. [18, 27] In a sample with a spatially random distribution of columnar defects at low temperatures, one would therefore expect a crossover from the Mott insulator to a weakly pinned Bose glass, as is increased. Estimates for the location of this crossover line (denoted there) are given in Ref. [[6]].
Thus, if one aims to design a high- superconducting sample in such a way that its pinning properties are optimized, clearly one needs to understand the influence of the repulsive interactions and the effect of different spatial pinning site distributions in a quantitative manner. Obviously, there are two promising regimes for such a specific material “tailoring”, namely either the underfilled () strongly pinned Bose glass where the ensuing soft correlation gap in the distribution of pinning energies ensures that at least in the variable-range hopping regime vortex transport is effectively reduced, or the incompressible Mott insulator phase with its hard energy barrier preventing flux line motion. It is the purpose of this paper, therefore, to provide a quantitative numerical study of the low-temperature structural and transport properties of the entire Bose glass phase, including and specifically addressing the region near the matching field , as well as the features of the intermediate weakly pinned regime. Our investigations are based on a variant of the Coulomb glass model, which we modify in such a way that high-symmetry interstitial sites are accessible to the vortices in addition to the defect positions themselves, and we may thus utilize the successful algorithms and considerable experience obtained in earlier studies. [9, 10, 11, 12] This model will be described in detail in Sec. II, while in Sec. III we shall introduce and define the quantities of interest to characterize both relevant static and dynamic properties of the Bose glass and Mott insulator phases in irradiated superconductors. Sec. IV is then devoted to the analysis of our simulation data and contains the main results of our numerical study. We shall explore both a random distribution of pinning sites (uniform disorder) and spatially correlated disorder distributions, as obtained by deformations of a perfect triangular defect lattice. Finally, we shall summarize and discuss our results.
II The Model
The theoretical modeling of the Bose glass phase is based on the following free energy for flux lines, described by their two-dimensional trajectories as they traverse the sample of thickness , interacting with each other and with columnar defects parallel to the magnetic field , [5, 6]
| (2) | |||||
The first term in Eq. (2) describes the elastic flux line tension and originates in an expansion of the line energy of nearly straight vortices with respect to small tipping angles. [4] The tilt modulus is given by , where the energy scale is set by , is the average lattice spacing between the flux lines, is the superconducting correlation length, and denotes the London penetration depth.
The second term represents the interaction of all vortex pairs (which we approximate to be local in ), where and is the screened repulsive vortex potential, with the modified Bessel function as , and for .
Finally, the columnar pins are modeled by a sum of -independent attractive potential wells , with average spacing , and centered at randomly distributed positions . Here, denotes the Heaviside step function. The damage track diameters, produced by heavy ion irradiation, are typically Å wide, with a variation induced by the root-mean-square energy dispersion of the ion beam of , where denotes the individual defect radii. The pinning energies are related to the column diameters via the interpolation formula given by Nelson and Vinokur [6]
| (3) |
where Å is the coherence length. The distribution of column diameters thus induces a variation of the pinning energies with the width
| (4) |
Above a certain temperature , the effective radius of the normal-conducting region at the defects will be given by the coherence length, which in mean-field theory grows with temperature according to
| (5) |
Hence, should be inserted into Eq. (3) instead of , whenever , or , with
| (6) |
Consequently, above the fluctuations of the pinning energies will be effectively smoothed out. With Å and Å this will happen at . As we shall describe later, we will not be particularly interested in this regime, since the Mott insulator is predicted to exist deep in the Bose glass phase at low temperatures when thermal fluctuations can be neglected.
The classical statistical mechanics properties of Eq. (2) can be derived from an analysis of the grand-canonical partition function [6] (we set the Boltzmann constant throughout this paper)
| (8) | |||||
where denotes the chemical potential
| (9) |
which changes sign at the lower critical field . The analytic approach to this partition function has made use of a mapping onto a two-dimensional quantum-mechanical problem with a static (i.e., -independent) disorder potential, where the physical direction has been interpreted as imaginary time. [5, 6] In the thermodynamic limit (which tunes the effective temperature of the Bose system to zero), the properties of the model are determined by the lowest-energy eigenstate of the corresponding transfer matrix or equivalent quantum-mechanical problem. The corresponding ground state wave function is symmetric with respect to exchange of flux lines, and thus of bosonic character. The ensuing localization transition found with this method, where the bosons become bound to the static disorder potential (i.e., the flux lines are pinned to the columnar defects), leads to a disorder-dominated low-temperature phase, termed Bose glass.
Here, we will be interested in the low-temperature (ground state, ) properties of Eq. (2), which is a fair approximation to the Bose glass phase for temperatures . denotes the temperature above which entropic corrections associated with thermal fluctuations become relevant for the pinned flux lines. Physically, this means that vortices start to fluctuate around their defect positions and can no longer be thought of as straight lines. Theoretical estimates yield , [6, 12] although in some experiments has been found to be considerably lower. [28, 15] At an even higher depinning temperature , vortices start to leave the columnar defects, but may still be effectively pinned by their mutual interactions with the neighboring occupied defects. We restrict our study to the regime below , where the vortices are essentially straight lines, which simplifies our problem considerably. When comparing our simulation results later with experimental data, will a posteriori prove to be a good approximation.
Since thermal wandering and bending of vortex lines below is suppressed, we can neglect the bending energy term in Eq. (2). This leaves us with a time-independent, two-dimensional problem of interacting “particles” and defects. We also aim to address a possible Mott insulator phase within the Bose glass, near the matching field . Consequently, we want to study a filling fraction
| (10) |
which is why we have to account for the possibility (especially for ) that not all vortices can be accommodated on defect sites. Hence, we represent our problem on an underlying triangular grid with “lattice” sites and interdefect positions (“interstitials”). This is the main new aspect of our simulations in comparison to those reported in Ref. [[12]], where only defect sites were available. Thus, that study was limited to low filling fractions . The effective, two-dimensional Hamiltonian used in our simulations, therefore reads
| (11) |
and its grand-canonical counterpart is
| (12) |
Here, represents the site occupations number; note that . Taking Å (at ) and Å, we obtain for the bare pinning energies , with and width , both in units of . For simplicity, we assume a flat distribution of pinning energies around its mean, . Our choice of an underlying triangular grid is motivated by the fact that without disorder the energetically most favorable state for the vortices is the (triangular) Abrikosov lattice. Thus in effect we take into account the energetically lowest high-symmetry “interstitial” positions between the columnar defects.
Finding the ground state configuration of this system by analytical means constitutes a very difficult task, which has to date not been successfully mastered. Consequently, we have to resort to numerical simulation techniques with a suitable ground state finding algorithm. Fortunately, the Hamiltonian (11) is precisely of the form studied in the context of charge carriers localized at random impurities in doped semiconductors (i.e., the so-called Coulomb glass problem with instead of our logarithmic repulsion), and we can utilize the broad numerical experience gathered in those previous investigations. [9, 10, 11, 12] We shall use Eq. (11) in all of our simulations, and will now introduce the simulation technique and the quantities we intend to measure.
III Simulation Technique and Quantities of Interest
In this section we shall first describe in detail the Monte Carlo algorithm we have employed in all simulations presented in this paper. We then proceed with an introduction to the relevant quantities we have measured, and which can be qualitatively and semi-quantitatively compared with experimental data that aimed to identify a Mott insulator transition in YBCO, BSCCO, and Tl-compounds.
A Energy Minimization Procedure
Our starting Hamiltonian is given in Eq. (11). We will be interested in the ground state properties of this Hamiltonian as a function of the filling fraction , which we shall vary near the predicted Mott insulator value , and as a function of the interaction length scale or, more often, as function of the dimensionless ratio where is the average defect distance. In order to find the ground state configuration of this Hamiltonian, we follow closely an energy minimization scheme described in detail by Shklovskii and Efros in Ref. [[9]], Chap. 14, with some slight modifications according to Davies, Lee, and Rice. [10] Taking a triangular lattice with lattice constant and sites, and imposing periodic boundary conditions, we initially distribute defects randomly on this underlying triangular grid. Each defect site is assigned a randomly chosen energy , from a flat distribution with mean and width . Most of our simulations used and , such that the average defect distance was , in units of the lattice constant .
We then distribute vortices randomly on the grid and follow the algorithm by Shklovskii and Efros in order to minimize the energy. This is done as follows: First, for our interacting system, we define single-particle site energies as
| (13) |
For a filled site, denotes the energy to remove a particle from site to infinity, while, for an empty site, is the energy needed to introduce an additional particle from infinity on site . In thermal equilibrium, the chemical potential energetically separates the occupied from the unoccupied states, i.e., with and with . In the random initial configuration, which usually corresponds to a strongly non-equilibrium situation, many occupied sites will have a higher energy then many unoccupied sites. To approximate the ground state as closely as possible, we proceed in two steps. After the calculation of all we try to relax the initial state by successive particle-hole transitions. To do so, we determine the occupied site with highest energy, and the empty site with lowest energy, . If , the particle on site is moved to site , the site energies are recalculated and the procedure is repeated until eventually . Thus we have now separated the occupied from the unoccupied states energetically and can give a first estimate of the chemical potential by
| (14) |
The ensuing state is, however, still a very poor approximation of the ground state, as it is generally unstable against single-particle hops. To test this, we next compute the hopping energies
| (15) |
This expression can be understood as follows. First, remove a particle from site to infinity, which yields an energy gain of . Then, take the particle back to site , which costs the amount of . The additional contribution of stems from the fact that after removing the particle from site there are only particles left, but is defined in terms of a system with particles. Thus, the fictitious interaction with site has to be accounted for explicitly. Note that a necessary condition for the ground state is for all pairs with .
Thus, in a second step we compute all , and then search for the minimum of all the negative hopping energies: . Then, we perform the particle transfer from site to site , which reduces the total energy of the system further. As this hop typically leads to a non-equilibrium state again, we next recalculate the site energies and repeat the particle-hole transfer procedure of the preceding paragraph. Then, another hopping transfer is attempted until eventually . The ensuing configuration is accepted as a fair approximation of the ground state for a particular defect distribution, filling fraction and ratio . A typical initial and final particle distribution obtained with this procedure is shown in Fig. 3. From the resulting configuration the site energies , the chemical potential , and the total energy of the system can be computed. This procedure is repeated for a number of different initial realizations of the disorder, such that we can obtain an ensemble average of the chemical potential and other quantities of interest, which we shall describe in the following subsections. We typically take which has proven to be sufficient in our simulations.


Of course, with this approximation scheme we still may not have reached the true ground state configuration, but rather a metastable “pseudo”-ground state. In principle, one would have to test that pseudo-ground state against particle hops, in order to obtain the true minimum-energy configuration. Previous investigations have shown, though, that terminating at already gives reliable estimates for the energy-level distribution. [9, 10, 11] To test the algorithm, we have equilibrated different initial configurations of vortices with an identical defect distribution. For example, we chose initially a) a completely random configuration, b) a triangular array, and c) we first occupied all defects with vortices, and then distributed the remaining vortices (if ) randomly, for given and . All different configurations yielded the same energies and within the numerical uncertainties, although the spatial configurations typically looked slightly different. Additional tests of the algorithm will be presented in Sec. IV.
Having introduced our simulation algorithm, we will employ this technique for and [29] in order to investigate whether there exists a Mott insulator within the Bose glass phase, and see if it is stable against increasing the vortex-vortex repulsion as is enhanced, while keeping the pinning strengths fixed. In order to identify the Mott insulator and to compare with experimental data, we need to introduce a number of quantities that we can compute from our ground state configurations. This will be the topic of the next four subsections.
B Distribution of (Interacting) Pinning Energies
From the interacting single-site energies defined in Eq. (13) we can construct a histogram of all energies of the final ground state configuration. The quantity then denotes the number of states per unit area with energies in the interval with the normalizing constraint
| (16) |
The quantity thus defines the interacting boson single-particle density of states or, in the flux line context, the distribution of interacting pinning energies. This quantity is particularly interesting in order to identify a Mott insulator. For a true Mott insulator phase, should display a hard gap near the chemical potential , i.e., the (lower) energies of the occupied states should be separated from the (higher) energies of the unoccupied “band” by a region of finite width which contains no states at all. In the strong screening limit , when there is no interaction between the vortices, the gap should be exactly (see the top left of Fig. 7 below).
Moreover, by further exploiting the analogy to two-dimensional bosons localized at randomly distributed defect sites, one has to consider the possibility that these spatial correlations produce a soft Coulomb gap in the distribution of pinning energies near the chemical potential . Such a Coulomb gap has indeed been found in the Coulomb glass problem of disordered semiconductors, where the interaction is also long-range ( up to the screening length ), [9, 10, 11] and in the Bose glass phase for small fillings and large , i.e., almost logarithmic interactions. [6, 12] In both situations the density of states vanishes precisely at the chemical potential, and in its vicinity increases according to a power law,
| (17) |
Here, we have defined the effective gap exponent , which depends strongly on and on the filling fraction , as we shall see. In fact, for small fillings and short-range interactions , the exponent is trivially , i.e., the density of states near is constant. [6, 12] For , the theoretical prediction within the framework of a mean-field type of analysis would be . With a random distribution of pinning sites, however, one has to expect that local energy fluctuations will play an important role, and thus , with values that may depend on the filling , and the actual energy scale. [11, 12]
For finite , and sufficiently low energies in the utmost vicinity of , one must find a crossover to in an infinite system. In a finite system, however, or at some distance from the chemical potential, one will find a nonzero effective exponent , which can be obtained simply by fitting a power law in the vicinity of (see also Ref. [[12]]). The determination of depending on and is one of the tasks of our work since it affects crucially the experimentally measurable I-V characteristics of superconductors in the Bose glass phase, as we shall see below. Primarily, though, we want to see whether a hard gap in the density of states survives the introduction of long-range interactions.
C Bulk Modulus
From our measurement of the chemical potential as a function of filling fraction and constant interaction scale , we can determine the bulk modulus via
| (18) |
where denotes the compressibility of the system. Physically, the bulk modulus characterizes the stiffness of the system with respect to the insertion of an additional particle into it. A divergence of at the matching field () would indicate the presence of the Mott insulator phase, since the chemical potential should show a sharp jump when one more vortex is put into the system. In the case of , the jump becomes of the size of the hard gap in , , i.e., introducing another vortex into the system costs a finite energy . In this respect, the system becomes similar to a Meissner phase which has zero compressibility as well.
D Reversible Magnetization
Since near the Mott insulator the Bose glass should become more and more diamagnetic due to the diverging bulk modulus, similar to the situation in the Meissner phase, a number of experiments have tried to identify the Mott insulator by measuring the magnetization as a function of the (internal) magnetic field . [17, 21, 22] In our simulations we can also obtain the reversible magnetization as a function of from the total free energy of the system , which becomes identical to the internal energy at , by noting the thermodynamic relation
| (19) |
Whereas in unirradiated samples the magnetization increase with should be proportional to , [31, 22, 21, 19] the signature of a true Mott insulator would be a sharp negative dip in the magnetization at due to the diamagnetic effect (diverging bulk modulus), see Fig. 2 above. Consequently, the bulk modulus and the magnetization are in fact closely related to each other. Noting that , , and , we can write
| (20) |
Thus, the maximum of occurs at the location of the steepest negative slope in , which usually is at a lower value than the minimum in . Only in the true Mott insulator phase will the singularities in and coincide precisely at .
E I-V Characteristics and Magnetization Relaxation
The I-V characteristics measured in the Bose glass phase below have the same form as predicted for the vortex glass, namely
| (21) |
where is the normal state resistivity, is an energy barrier scale, a current density scale and most importantly, denotes the effective glass or transport exponent. [6] Experimentally, one determines the glass exponent in different filling regimes and for different temperatures (effective interaction length scales ). We will see in this section that at low currents is closely connected to (in the variable-range hopping regime, see below) via the (approximate) equation
| (22) |
where is the dimension perpendicular to the applied field (here ). In order to understand how we can extract the glass exponent from our data of the density of states, we first have to distinguish between two current density regimes. The discussion presented here essentially follows Refs. [[6, 12]].
1 Hopping via vortex half-loop formation
Let us first consider fairly strong currents , where is the critical depinning current above which superconductivity is destroyed. We shall see that in this regime, the motion of a single vortex is unaffected by the other flux lines in the sample. [6] A current perpendicular to the vortices will induce a Lorentz force per unit length . Thus we add to our model free energy of Eq. (2) the term
| (23) |
Let us now estimate the effective glass exponent from the saddle-point configuration of Eq. (2), supplemented with Eq. (23). A flux line will start to leave its columnar defect due to the current by detaching a segment of length into the defect-free region, thereby forming a half-loop of characteristic transverse size , see Fig. 4 (left). This costs the bending free energy , and the lost pinning energy . This estimate uses on the average pinning potential . Taking the work by the Lorentz force into account, the free energy of the loop becomes approximately [6]
| (24) |
Optimizing this expression in the absence of external currents leads to the saddle-point configuration , while for finite currents one finds , which after inserting into Eq. (24) yields
| (25) |
We now identify the saddle-point free energy with the typical energy barrier . For a sufficiently low current , the vortex half loop will extend to the nearest-neighbor pin of distance , and hence . The flux line will then form a double kink of width , which costs the free energy . Thus, for , with these expressions and Eq. (25), we arrive at a current-voltage characteristics of the form (21) with the effective exponent . Recent experiments on BSCCO samples have indeed found for intermediate currents, supporting this half-loop nucleation picture. [13, 14, 15]


2 Variable-range hopping of flux lines
For , the most important thermally activated excitations will be double “superkinks”: The vortex will send out a tongue-like pair of kinks to a possibly very distant neighbor, but with almost the same pinning energy; see Fig. 4 (right). Once the tongue is established, the superkinks move outward and the vortex hops to a new site. This process represents the flux-line analog of variable-range charge hopping transport between localized states in semiconductors. [9] The free energy cost of a double superkink of transverse size and extension stems from the elastic term , and the difference of pinning energies between the highest occupied state and the empty site energy at distance . In the presence of a small external current we can thus write the free energy as [6]
| (26) |
The density of available states as a function of with dimension transverse to () on the one hand equals from considering the energetics, and on the other hand is given by from simple statistics in real space. can then be determined from the equation
| (27) |
We now proceed by optimizing Eq. (26) for first, which yields the optimal longitudinal extent , while for a non-zero current one arrives at
| (28) |
which through inversion gives the typical hopping range . Inserting this last result back into Eq. (26), we find the typical barrier for a jump, and consequently [12]
| (29) |
This procedure can be followed numerically, starting with a given distribution of pinning energies , as obtained from the energy-minimization algorithm. In order to determine the I-V exponent explicitly for a density of states of the form , we insert this into Eq. (27) to get
| (30) |
and with Eq. (28) finally arrive at
| (31) |
with given by Eq. (22). Thus, the I-V characteristics will mainly be determined by the interaction-dependent effective exponent , which itself depends on the effective gap exponent , i.e., the amount of depletion of the density of states in the vicinity of . With Eq. (29) we can write the I-V characteristics finally in the form
| (32) |
with . For the non-interacting case (with a constant density of states, i.e., ), which is experimentally realized for very low magnetic fields , and thus , one obtains the Mott variable-range hopping exponent . Thus, we expect to vary in the interval (the upper limit being given by ), depending on the interaction range , and the filling fraction. This has indeed been found in recent experiments, [15, 16] and partly in simulations. [12]
With the distribution of site energies as obtained from our minimizing procedure, we can numerically evaluate the I-V characteristics for any form of . This is done by integrating over starting at and using the relations (27) – (32) to obtain . A typical result derived from the distribution of pinning energies is depicted in Fig. 5, which shows a double-logarithmic plot of the effective hop size as a function of the reduced current . According to Eq. (31), the slope, determined by linear regression, immediately yields the glass exponent . We can thus extract as a function of the filling fraction and from our data, and compare with our estimate of and the relation (22).

Apart from comparing the effective glass exponent measured in our simulations with experimental data, we may also predict certain features of low-temperature magnetization relaxation experiments that have been used to locate a possible Mott insulating phase. [23, 24] As mentioned in Sec. I, these experiments identify a dip in the magnetization relaxation as the signature of a possible Mott insulator. Assuming that the relevant relaxation times are determined by variable-range hopping energy barriers , one finds for the magnetization relaxation rate [1, 18, 25]
| (33) |
and hence . Previous studies of the magnetization relaxation in the Mott insulator regime neglected this dependence of on , and rather investigated quantum fluctuations on the Mott insulator transition, [18] which may well play an important role in addition. Here, with our purely classical description, we argue that there may be some interesting physics in the behavior of , which may already explain recent measurements of the relaxation rate near the expected Mott insulator transition. Thus, from plotting vs , we can at least qualitatively compare our results with these experimental data.
IV Data Analysis
In this section we present a detailed discussion of our simulation data. In the first part, we shall only use uniform, randomly distributed disorder, and discuss the properties of the Bose glass phase as a function of and . More specifically, we shall use and . The main focus here lies on the question whether there exists a Mott insulating phase at , and if and when it is destroyed, as the interaction strength and range between vortices is increased. We will also make contact between a number of experimental results and our simulations. In the second part, we shall in addition investigate a more correlated spatial disorder distribution, which only slightly differs from a triangular lattice. Here we want to investigate whether the Mott insulator can even exist at large ratios .
Before we start our analysis we would like to discuss finite-size effects. First, we want to point out that we do not perform a genuine finite-size scaling analysis of our data in this work. Rather, we intend to see qualitatively and semi-quantitatively whether the Mott insulating phase may exist within the Bose glass phase, and if it is easily destabilized by strong long-range repulsive interactions.
One may worry, however, about two issues in our simulations: (i) There may remain artifacts from the underlying grid structure, which we employ to make interstitial positions for the vortices available. We have tried to render the grid finer by going from to lattice points, keeping fixed. However, we did not observe any significant lattice dependence in our measurements of or the total energy in this case. Hence, we believe that our results should be largely insensitive to the underlying lattice representation and provide a fair approximation to a more realistic continuum description. We therefore used in most of our simulations presented here. (ii) One may worry that the number of defects is too small. To check for strong finite-size effects, we therefore chose and increased from 36 to 100 and 225. We did not detect any significant finite-size effects, as was also observed in the simulations of a continuous defect distribution. [12] Also, we were able to make contact with Ref. [[12]] by choosing and . We could reproduce the previous results in systems of similar sizes, e.g., the values of the chemical potential and the effective exponent . Hence, we believe that for the purpose of our largely semi-quantitative analysis we can neglect artifacts stemming from too small lattice sizes or the underlying grid structure.
A Randomly Distributed Disorder
1 Strongly vs weakly pinned Bose glass
We start our data discussion by asking the question of how many flux lines become depinned as a result of the vortex interactions, depending on the filling fraction and the interaction range . As noted in the introduction, within the Bose glass phase one may discriminate between regimes of strong and weak pinning (strongly and weakly pinned Bose glass, SBG and WBG, respectively), separated by a crossover line. The SBG is characterized by the fact that most vortices are pinned to columnar defects, i.e., single-vortex pinning is the dominant mechanism. In the WBG, on the other hand, only a fraction of lines is pinned by the defects, while many other vortices are held in place owing to the repulsive interaction exerted from other vortices. In this situation, one also speaks of vortex bundle pinning, i.e., an arrangement of flux lines bound to defects effectively form a cage for other vortices, and pin these through their mutual interaction. [6, 18, 27] For the crossover between the two regimes is expected to occur at . [6] Once interactions become strong, however, the WBG should appear well below .

Let us define the filling fraction , at which 10 % of the vortices are depinned in equilibrium as a result of the repulsive interactions. With we tentatively identify the crossover line marking the change from SBG to WBG in our simulations, as a function of . This line may thus be compared with the crossover line as estimated in Ref. [[6]], and experimental results, see Refs. [[28, 15]]. Of course, the specific criteria that are used to characterize the boundary between the SBG and WBG regimes are somewhat arbitrary, but the qualititative features of should not depend too much on the exact manner this crossover line is defined. Figure 6 shows a plot of vs . One observes a rather strong dependence of this line on , which is shifted well below , as soon as the interaction range reaches . Only for does the curve remain above . This fact is already a first indication that the Mott insulator does not exist for , since it is defined by the localization of all vortices on the defects. This is, however, impossible, if already 10 % of the vortices are depinned as a result of their mutual repulsion at . Notice that for , by definition.
2 Site-energy distribution at the matching field
In order to detect the appearance or disappearance of the Mott insulator more clearly, we now turn to the analysis of the (interacting) single-particle density of states at . Remember that by density of states we refer to the distribution of pinning energies in the flux-line picture, i.e., a histogram of the values of for realizations of the disorder distribution. For long-range interactions one expects a soft “Coulomb” gap in at the chemical potential , whereas for short-range interactions a hard gap in the distribution of pinning energies should appear, indicating the presence of the Mott insulating phase.

In Fig. 7 we show four different plots of vs for different interaction regimes. Let us start at the top left of Fig. 7. In the limit one expects a hard gap in the distribution of pinning energies, characteristic of the Mott insulator phase. This can be seen nicely in this plot, with a gap in of width separating the occupied states at from the empty states at , with the chemical potential (by definition) located in the center.
Let us now study whether the Mott insulator survives the introduction of fairly weak repulsive interactions. The smallest interaction range we can use on a lattice with and , hence , is . [29] The top right of Fig. 7 depicts for . We observe a fairly flat density of states for the occupied sites, being somewhat depleted at and rises sharply for . However, the fact that all states below are continuously filled, implies that even rather short-range interactions suffice to destabilize the Mott insulator as a distinct thermodynamic phase, for its unique signature, namely the hard gap in the site-energy distribution, has vanished. Simultaneously, we observe that already 4 % of the vortices (in an average over 50 realizations of the disorder) have left the defect sites, and moved to energetically more favorable interstitial sites. We have also looked at by increasing to 3600 and using only , and hence . Yet even in this case we found some states in the vicinity of and approximately 2 % of vortices on interstitial sites. This result strongly indicates that for the true Mott insulator to appear in the presence of a random, uniform disorder distribution, a necessary condition is . This incompressible phase may, therefore, never be truly realized in e xperiments, where usually . We speculate, though, that for a more correlated disorder distribution the Mott insulator may persist to considerably larger interaction ranges; this suggestion will be further investigated in Sec. IV B.
We now turn to the two bottom graphs of Fig. 7. For (left) there is clearly no gap, but at a narrow, soft gap begins to appear in the distribution of pinning energies . In the bottom right figure for fairly long-range interactions , a wide soft gap of the form has fully developed. Such a Coulomb gap, though narrower, is also found for .


We note that in this situation of strong repulsive interactions and large filling, the effect of the pinning sites themselves has become rather weak. The vortices are largely held in place by the cages formed by the other flux lines, and the overall structure should be rather unstable against a collective drift motion, when an external current is applied. Quite obviously, we are now well in the weakly pinned Bose glass regime. In Fig. 8, we display a typical energy contour plot of an equilibrium configuration at and . The top figure depicts the energy contour, where many circular lines indicate deep energetic minima, corresponding to the defect/vortex configuration of the bottom plot. [30] For this case of fairly long-range interaction, the energetically favorable sites include both the defect and high-symmetry interstitial positions. We observe that pinning via the repulsive forces exerted by neighbors, which are still attached to defects, is very effective. As can be seen in Fig. 8, the potential minima are roughly equally wide and deep, irrespective of the flux line occupying a defect or an interstitial site.
In summary, by analyzing the density of states at we find that even for short-range interactions no distinctive Mott insulator phase appears. It becomes rapidly destabilized by the repulsive forces between flux lines, and only for do we observe a finite hard gap in the density of states near , i.e., a Mott insulator. In the following, we shall investigate if the measurement of other observables corroborates this picture which we obtained by the analysis of the density of states. Furthermore, we discuss the qualititive explanation of recent experiments that identified (albeit rather broad) features near the matching field.
3 Bulk modulus and reversible magnetization
Let us next turn to the determination of the bulk modulus as a function of the filling fraction , while keeping fixed. A divergence of at would indicate the appearance of the Mott insulator, as an incompressible phase (). In order to obtain we have measured the chemical potential defined in Eq. (14) as a function of , i.e., the curve. From this we obtain the bulk modulus by , the derivative being of course replaced by a discrete difference when analyzing our data. As we have seen in our study of the density of states, for a hard gap of size appears. In this case jumps from to as is increased from to plus one additional flux quantum. Thus, a divergence of is trivially connected to a gap in the density of states.
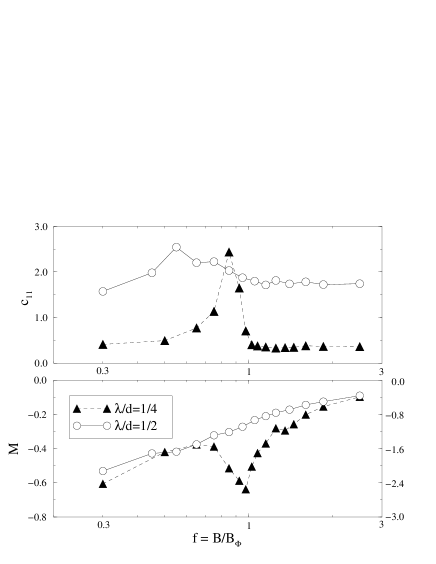
Fig. 9 (top) depicts the bulk modulus vs filling fraction on a log-linear plot. One observes that no divergence appears at for , yet a quite pronounced cusp occurs in , shifted downwards to . For an even larger interaction range () the cusp in is displaced to even smaller and less marked; for , the bulk modulus becomes essentially constant over the entire range of . In both cases depicted here, the location of the peak in coincides with that value of at which a sizeable number of vortices actually leaves the defect sites. The fact that the average bulk modulus is enhanced for larger is simply an energetic effect, since a vortex entering the system has to overcome a higher energy barrier due to the interactions. The behavior of confirms again that no true Mott insulator exists even for comparatively short-range interactions or . We do observe, though, a distinctive “lock-in” structure for , visible as a cusp in . This feature, however, completely disappears for .
In order to make contact with experiments, we measured the total energy , which yields the reversible magnetization via the thermodynamic relation . Fig. 9 (bottom) depicts as a function of on a log-linear plot for and , respectively. The data for show a pronounced minimum in at , embedded in a slow logarithmic growth as increases. The second plot for hardly displays any structure aside from a shallow dip near . This feature is completely absent for , where only the increase remains, resembling the magnetization curve of an unirradiated superconductor. [31, 21, 22, 19] The observed behavior of at qualitatively agrees very well with recent measurements performed by van der Beek et al. in an irradiated BSCCO crystal, [22] where (at ) a pronounced dip in centered near was found. The disappearance of this minimum in the experiments as is increased towards the transition temperature may be at least partially due to the divergence of the London penetration depth , which we capture in our data for large , as well. In addition, the entropic renormalizations studied in Ref. [19] will probably play a significant role. Our simulations cannot explain, however, the magnetization minima found at in BSCCO tapes. [21] We will return to this issue in Sec. V.
We would like to point out that the maximum in occurs at lower value of than the minimum in (compare, e.g., our data for ), which can be understood as follows (see Sec. III D). Starting from the relation and , the bulk modulus may be written as ; thus the maximum of occurs at the location of the steepest negative slope in , which has to be at a smaller than the minimum in . Only in the “true” Mott insulator phase will the singularities in both and coincide precisely at .
In summary, the measurements of the bulk modulus and the reversible magnetization confirm the scenario that no Mott insulator phase exists at finite . There are, however, interesting “lock–in” structures present at , which qualitatively agree with recent experimental findings. We interpret these as remnants of the Mott insulator phase, but not as true signatures of this distinctive thermodynamic phase itself.
4 I-V characteristics and magnetization relaxation
In the last section of our data analysis we now turn to the transport properties of our model, which can be evaluated from the single-particle density of states as described in Sec. III E. The calculation of the effective transport exponent by such means was first used in simulations in Ref. [[12]], where small filling fractions only were analyzed and thus no “interstitial” grid was used as in the present study, but rather a continuous distribution of defect sites. Thus, each vortex was always pinned by an energetically favorable defect site (single-vortex pinning) and hence the equilibrium configurations should be stable against thermal fluctuations or small currents (strongly pinned Bose glass regime). In our case, where we want to analyze as well, we need to see whether our equilibrium configurations are sufficiently stable against such perturbations. But as the above energy-contour plot (Fig. 8) demonstrates, the potential minima for the vortices both at defect and at interstitial positions are about equally deep, and generally well-separated from each other. This gives us confidence that the single-particle density of states may indeed be used to infer low-current transport properties in the variable-range hopping regime. It also justifies a posteriori the quality of our grid description of the problem: The most important low-energy interstitial sites are correctly taken into account.
We have determined the effective glass exponent defined by the equation
| (34) |
via employing the method described in Sec. III E in the range for . We were not able to extract from the density of states for , since the absence of even a small Coulomb gap (cf. Fig. 7, top right) renders the definition of impossible. Our findings are that for interaction ranges we observe a slow, monotonous rise in as is increased: For from to , and for from to . It is interesting to compare these results with the earlier simulations at low filling fractions. [12] For instance, there at and an effective exponent of was found, which then decreased almost to the non-interacting Mott value , as was increased towards . This, however, was due to the fact that the system had to accommodate with the underlying randomness, since no favorable interstitial sites were available. In our case, with these interstitial sites being accessible, the disorder effects are screened by the interactions as the vortex density is increased, which leads to stronger correlations, and presumably more mean-field like behavior (), because of the more uniform spatial distribution of flux lines. Thus, our simulations are presumably more realistic for higher filling fractions, and the tendency of increasing transport exponents with larger magnetic fields is experimentally confirmed in recent I-V measurements on YBCO. [15] In these experiments, a continuous increase of with from to was found.
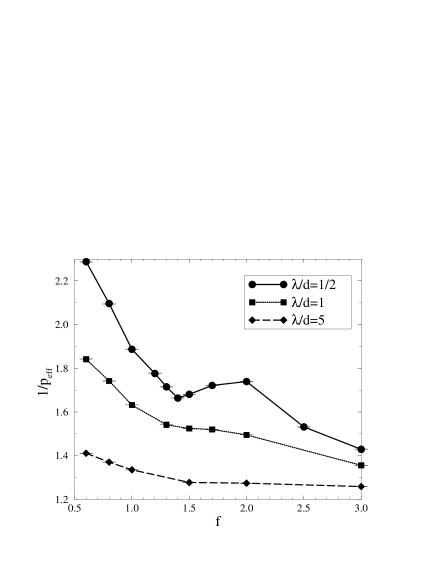
We plot our data for in Fig. (10). For we find a marked minimum in at , which is presumably due to a delicate interplay of disorder and interaction effects. Assuming that relaxation times are determined by the variable-range hopping energy barriers, we found in Sec. III E that the magnetization relaxation rate . Thus, the minimum we find in for might explain low-temperature relaxation experiments on YBCO samples, [23] as well as on Tl-compounds, [24] for which a marked minimum in at wa reported. With the knowledge we have gathered from the above measurements, we would argue that the minimum detected in the magnetization relaxation experiments is not really a signature of a true Mott insulating phase, but rather a remnant of the Mott insulator in the weakly pinned Bose glass near .
In summary, our simulation data suggest that in a sample with a uniform random distribution of columnar defects, a Mott insulating phase is not observable as a consequence of the repulsive interactions between vortices. It may, however, persist up to considerably larger interaction ranges, if the disorder distribution is chosen in a more correlated manner, e.g., almost matching the triangular Abrikosov lattice of a pure type-II superconductor. [32] This way the strong repulsion of vortices on defects, which are located very closely to each other, is avoided, and the interactions basically lead to an overall constant upwards shift of all the site energies. We are going to investigate this possibility in the following section.
B Spatially Correlated Disorder Distribution
In order to investigate the presence of a Mott insulator phase up to larger interaction scales in a spatially more correlated disorder potential, we have constructed a trial disorder distribution as follows: The triangular lattice points with mutual distance are looked up on our underlying grid, and then, with equal probability, the defect is either put on the six nearest neighbors of the original point, or it remains on the original site. Thus, disorder only comes in as a slight distortion of a perfect triangular defect lattice. Related simulations using ideal triangular and square disorder lattices were performed by Anghelache et al., [33] with the remarkable result that at some values of and , a quadratic defect array is apparently more effective in pinning the vortices than a triangular lattice of pins. We remark, however, that the present Monte Carlo algorithm was specifically designed for disordered systems, and does not always faithfully reproduce the correct ground state in ordered structures (typically, regularly ordered subdomains remain separated by dislocations, which cannot be removed by the merely local processes allowed for by the algorithm). Such regular lattices of pins have recently been produced in high- superconductors, and also been investigated experimentally, where the main focus lay on the enhancement of the irreversibility line, i.e., . [26] As for temperatures at least, the pinning efficiency of such regular pin arrays is much improved, we expect the crossover line between the weakly and strongly pinned Bose glass regimes to be drastically shifted upwards. We also remark that the non-equilibrium properties of such regular arrays under conditions of strong drive were studied numerically by Reichhardt et al. [20]
1 Strongly vs weakly pinned Bose glass
We first ask again the question, how many vortices have left their defect positions as a function of ? It is interesting to note that by looking at the defect occupancy at , we find that even for only roughly 1 % of the vortices have left the defect positions, preferring an interstitial position. At the vortices are always located on defect sites. Thus, the crossover line between the strong and the weak Bose glass which we have defined pragmatically in Sec. IV A 1, remains above for the entire range of interactions we study here. This is in striking contrast to Fig. 6, where we observed a quickly decreasing crossover line as soon as was increased above 1/4. This indicates that a more correlated type of disorder enhances single-vortex pinning drastically, which has already been verified in experiments. [26] Moreover, it renders the occurrence of a Mott insulating phase for possible.

2 Site-energy distribution at the matching field
As in the previous section, we set out to detect a possible Mott insulator by looking for a hard gap near the chemical potential in the density of states (distribution of pinning energies). Figure 11 shows four different plots of the density of states at for our more correlated disorder distribution. Starting with the top left of Fig. 11, we see that at there clearly exists a broad hard gap in near the chemical potential . All vortices are localized on defects in all 50 realizations of the disorder and thus a true Mott insulator phase emerges in this interaction regime. This is in contrast to the uniform random disorder distribution of the last section, where for and even smaller values the Mott insulating phase was already destroyed (cf. Fig. 7, top right).
The top right figure with shows a significantly smaller, but still finite gap between the occupied low-lying states and the vacant high-energy states. Only at (left bottom) has the gap closed and a soft Coulomb gap structure has emerged instead. However, all vortices are still bound to defects. Only for (not depicted here) do the first vortices leave their defect positions in favor of low-cost interstitial sites. Finally, for the Coulomb gap structure only insignificantly differs from the one found for the uniform random disorder distribution (see Fig. 7 bottom right); the disorder is now effectively screened by the long-range interaction between vortices.
We thus conclude that the Mott insulator phase can survive the introduction of inter-vortex interactions if the defect structure has a more correlated form, as studied in our example. We find that the Mott insulator can still be found up to , in sharp contrast to the completely random defect distribution, in which case even for no incompressible phase could be identified. Let us now see how the Mott insulator phase appears in the measurement of the bulk modulus and the reversible magnetization.
3 Bulk modulus and reversible magnetization
In order to see the effects of the Mott insulator on the bulk modulus and the reversible magnetization, we consider the interaction regime , where we still observe a finite gap in the density of states. In Fig. 12 we show the chemical potential vs . This function displays a distinct jump near , slightly smeared out due to finite-size effects. Hence, the bulk modulus shows a strong narrow maximum near , which in the limit of an infinitely large system would presumably yield a -function peak. Notice that the bulk modulus stays fairly constant below and above . This behavior in the bulk modulus needs to be contrasted with that of for the uniform random disorder distribution and (cf. Fig. 9 top). There, at an even shorter interaction scale, only a broad and much flatter cusp in was found, and its maximum was even shifted to a lower filling fraction of . This had indicated the absence of a Mott insulator phase, although the system near was clearly fairly stiff with respect to introducing new vortices. Here, however, the narrow and sharp cusp in and the gap in the density of states strongly indicate the presence of the Mott insulator.

The bottom left plot of Fig. 12 shows the total energy vs . Clearly, there is a marked change in the slope of as the filling fraction is tuned through . Consequently, there is a strong dip in the magnetization at , as can be seen in the bottom right plot. This minimum is much more pronounced and sharper as compared to those found for or in the uniform random disorder case (compare the broad dips in Fig. 9 bottom). Also note that both the peak in and the dip in occur at the same location, namely precisely at , as is indicative of the true Mott insulator phase (see our discussion in Sec. III D). To our knowledge, such a sharp dip indicating a real Mott insulating transition has not been seen in experiments so far.
Let us just briefly describe the other interaction regimes. For of course the “divergences” in and at feature even stronger than in the case depicted in Fig. 12 and, therefore, also here the Mott insulator is visible. roughly represents the border line between the occurence of a hard gap in the density of states and the soft Coulomb gap. The cusp in near is still rather narrow, but much less pronounced, and also the dip in the magnetization is less strong. For , the bulk modulus remains flat over the entire range of the filling fraction, and the magnetization shows no significant dip.
In summary, we have seen that a more correlated disorder distribution enhances single-vortex pinning drastically, and may thus even show a Mott insulating transition for moderate interaction ranges. The Mott insulator phase should be observable in measurements of the reversible magnetization, with a sharp dip precisely at being its clear signature. However, this phase might well be rather unstable with respect to thermal fluctuations, because correlated vortex hops would be facilitated by the more regular defect distribution.
V Conclusion
The aim of our study was to investigate how the repulsive forces between vortices affect the properties of the Bose glass phase, and especially the proposed existence of a Mott insulator phase, as the magnetic field is varied near the matching field . Specifically, we set out to explain recent experiments which apparently have found evidence for the Mott insulator transition in irradiated high--superconductors. Our main findings for a uniform random defect distribution, which is realized in most experiments, are:
-
At the matching field , the Mott insulator, being characterized by a hard gap in the distribution of pinning energies near the chemical potential , only exists for extremely short-range interactions . With increasing , the gap quickly fills and, therefore, the Mott insulator phase as well as the singularities of the accompanying phase transition are destroyed. For long-range interactions , a soft Coulomb gap described by emerges with an effective gap exponent .
-
By measuring the reversible magnetization and the effective I-V exponent , which we argue is related to the magnetization relaxation rate, we are able to explain recent experimental results [22, 23, 24] as remnants of the Mott insulator for , but not as true signatures of this thermodynamic phase itself. More specifically, the dip in the magnetization at and the minimum in the relaxation rate near found in the experiments can be reproduced in our simulations, albeit with a simultaneous absence of a hard gap in the density of states.
-
By tuning in the interval for we find a slowly increasing effective glass exponent with , which is in accord with recent measurement on YBCO films. [15]
-
We can identify a crossover line discriminating between the strongly and weakly pinned Bose glass regimes, respectively. This curve is close to the matching field for , but decreases rapidly as the interaction range is increased.
Our simulations cannot explain the experimental finding of Li et al., [21] who observed a minimum in the reversible magnetization at in two samples of irradiated BSCCO. It is, however, intrinsically difficult to guess the correct value of , which is estimated from knowing the average flux density of the heavy-ion beam and some guesses of how effectively these ion columns can create pinning tracks for the vortices. Slight deviations of the estimated from the true defect density may therefore be responsible for this apparent discrepancy of the minimal magnetization and their . [34] In this case there would be no contradiction to our result and that of the experiments of van der Beek et al. [22] Of course, we cannot exclude that thermal fluctuations might also play a role, as these were completely neglected in our algorithm, but these would rather be expected to further smoothen any structures in the magnetization.
Can it be understood microscopically why the Mott insulator is destroyed for even short-range interactions? Due to the random distribution of pinning sites, there is a small probability in the Poisson distribution that two, three, or even four defect sites are clustered closely together, say, three defects on a triangle of our grid. Although these defects present favorable pinning sites for vortices, their mutual (though short-range) repulsion may lead to the effect that one vortex actually leaves in favor of a high-symmetry interstitial site, while the others remain on the pinning centers. Thus, even for short-range interactions, a small but finite percentage of flux may never sit on defect sites due to the clustering of defects. Consequently, the Mott insulator, in which all defects are occupied by vortices, is destroyed.
To cancel this effect we also used a trial disorder distribution, which is basically a slightly distorted triangular defect lattice. We presumed that in this case single-vortex pinning should be enhanced and thus the Mott insulator should be visible for larger interaction regimes. Here our results are as follows:
-
The crossover line discriminating between the weakly and the strongly pinned Bose glass is drastically shifted upwards. It remains above even for .
-
At the matching field the Mott insulator can be found up to , marked by hard gap in the density of states near the chemical potential. The gap fills, and a soft Coulomb gap emerges for .
-
For we find a sharp and narrow peak in the bulk modulus at ; simultaneously, we observe a distinct sharp minimum in the magnetization at . Both signatures are much more pronounced than even for in the uniform random disorder case. The fact that both singularities occur simultaneously at is another strong indication of the existence of a true Mott insulator.
Our simulation results indicate that in most experimental samples studied so far, which have hardly any correlations in their disorder distribution, the Mott insulator is presumably never realized. In most high--superconductors the interaction length scale far below is of the order 1000 Å. The experiments of Li et al. and van der Beek et al. used a fairly high irradiation density, such that the average defect distance was of the order 500 Å, and thus . Presumably a Mott insulator could be produced with a far weaker radiation dose such that . Another possibility would be using a more correlated disorder distribution, like in our simulations, such that repulsive forces from very close vortices occupying defects can be avoided. It would be interesting to investigate both possibilities experimentally. Furthermore, the inclusion of thermal fluctuations in the investigation of the Bose glass properties would be highly desirable. However, this requires highly efficient algorithms that are able to deal with three-dimensional vortex line fluctuations in a disordered environment.
Acknowledgements.
We benefited from discussions with M. Baumann, C.J. van der Beek, J.T. Chalker, E. Frey, J. Kötzler, D.R. Nelson, and L. Radzihovsky. C.W. wishes to thank A.P. Young for his hospitality and stimulating discussions at the Physics Department of the University of California, Santa Cruz, where most of this work has been performed. U.C.T. acknowledges support from the European Commission through a TMR Marie Curie Fellowship, contract no. ERB FMBI-CT96-1189, and from the Deutsche Forschungsgemeinschaft through a Habilitation Fellowship, DFG-Gz. Ta 177/2-1,2.REFERENCES
- [1] For a recent review, see, e.g., G. Blatter, M.V. Feigel’man, V.B. Geshkenbein, A.I. Larkin, and V.M. Vinokur, Rev. Mod. Phys. 66, 1125 (1994).
- [2] D.R. Nelson, Phys. Rev. Lett. 60, 1973 (1988); D.R. Nelson and H.S. Seung, Phys. Rev. B 39, 9153 (1989).
- [3] M.P.A. Fisher, Phys. Rev. Lett. 62, 1415 (1989); D.S. Fisher, M.P.A. Fisher, and D.A. Huse, Phys. Rev. B 43, 130 (1991).
- [4] D.R. Nelson, J. Stat. Phys. 57, 511 (1989).
- [5] I.F. Lyuksyutov, Europhys. Lett. 20, 273 (1992).
- [6] D. R. Nelson and V. M. Vinokur, Phys. Rev. Lett. 68, 2398 (1992); Phys. Rev. B 48, 13 060 (1993).
- [7] See, e.g., M.P.A. Fisher, P.B. Weichman, G. Grinstein, and D.S. Fisher, Phys. Rev. B 40, 546 (1989), and references therein.
- [8] For finite , open boundary conditions are more realistic for a flux-line system than the periodic boundary conditions along required for the boson mapping. Some consequences, e.g., the ensuing different finite-size corrections in the flux liquid phase, are discussed in: U.C. Täuber and D.R. Nelson, Phys. Rep. 289, 157 (1997).
- [9] See B.I. Shklovskii and A.L. Efros, Electronic properties of doped semiconductors (Springer, Berlin 1984); and references therein.
- [10] J.H. Davies, P.A. Lee, and T.M. Rice, Phys. Rev. Lett. 49, 758 (1982); Phys. Rev. B 29, 4260 (1984).
- [11] A. Möbius, M. Richter, and B. Drittler, Phys. Rev. B 45, 11568 (1992).
- [12] U.C. Täuber, H. Dai, D.R. Nelson, and C.M. Lieber, Phys. Rev. Lett. 74, 5132 (1995); U.C. Täuber and D. R. Nelson, Phys. Rev. B 52, 16 106 (1995).
- [13] M. Konczykowski, N. Chikumoto, V.M. Vinokur, and M.V. Feigel’man, Phys. Rev. B 51, 3957 (1995).
- [14] C.J. van der Beek, M. Konczykowski, and V.M. Vinokur, Phys. Rev. Lett. 74, 1214 (1995).
- [15] M. Baumann and J. Kötzler, private communication (1996).
- [16] J.R. Thompson, L. Krusin-Elbaum, L. Civale, G. Blatter, and C. Feild, Phys. Rev. Lett. 78, 3181 (1997).
- [17] A. Wahl, V. Hardy, J. Provost, C. Simon, and A. Buzdin, Physica C 250, 163 (1995).
- [18] L. Radzihovsky, Phys. Rev. Lett. 74, 4919 and 4923 (1995).
- [19] L. N. Bulaevskii, V.M. Vinokur, and M.P. Maley, Phys. Rev. Lett. 77, 936 (1996).
- [20] C. Reichhardt, C.J. Olson, J. Groth, S. Field, and F. Nori, Phys. Rev. B 53, R8898 (1996).
- [21] Q. Li, Y. Fukumoto, Y. Zhu, M. Suenaga, T. Kaneko, K. Sato, and C. Simon, Phys. Rev. B 54, R788 (1996).
- [22] C.J. van der Beek, M. Konczykowski, T.W. Li, P.H. Kes, and W. Benoit, Phys. Rev. B 54, R792 (1996).
- [23] K.M. Beauchamp, T.F. Rosenbaum, U. Welp, G.W. Crabtree, and V.M. Vinokur, Phys. Rev. Lett. 75, 3942 (1995).
- [24] E.R. Nowak, S. Anders, H.M. Jaeger, J.A. Fendrich, W.K. Kwok, R. Mogilevsky, and D.G. Hinks, Phys. Rev. B 54, R12 725 (1996).
- [25] A brief account of these results was already presented in: C. Wengel and U.C. Täuber, Phys. Rev. Lett. 78, 4845 (1997).
- [26] See, e.g., M. Baert, V.V. Metlushko, R. Jonckheere, V.V. Moshchalkov, and Y. Bruynseraede, Phys. Rev. Lett. 74, 3269 (1995); J.-Y. Lin, M. Gurvitch, S.K. Tolpygo, A. Bourdillon, S.Y. Hou, and J.M. Phillips, Phys. Rev. B 54, R12 717 (1996); J.I. Martín, M. Vélez, J. Nogués. and I.K. Schuller, Phys. Rev. Lett. 79, 1929 (1997).
- [27] A.I. Larkin and V.M. Vinokur, Phys. Rev. Lett. 75, 4666 (1995).
- [28] L. Krusin-Elbaum, L. Civale, J.R. Thompson, and C. Feild, Phys. Rev. B 53, 11 744 (1996).
- [29] Using a smaller interaction length renders the interaction range shorter than the underlying grid; this, however, effectively yields and is thus unphysical.
- [30] The top plot should not be considered above a y-axis value of 30, since due to an error of the plot program, the true energy distribution is not represented there.
- [31] M. Tinkham, Introduction to Superconductivity (McGraw-Hill, New York, 1975).
- [32] Taking a perfect triangular defect lattice would not work at non-zero temperatures, since in the quantum-mechanical analogy the localized wave functions of the bosons (at ) would correspond to delocalized Bloch waves, much like electrons in a perfectly regular potential. In the vortex picture, this would lead to correlated hops of flux lines [D.R. Nelson, private communication (1996)].
- [33] R. Anghelache, private communication (1997).
- [34] L. Radzihovsky, private communication (1997).