Is doped BaBiO3 a conventional superconductor?
Abstract
We report density functional calculations based on local density approximation (LDA) of the properties of doped barium bismuthates. Using linear-response approach developed in the framework of the linear muffin-tin-orbital method the phonon spectrum of the Ba0.6K0.4BiO3 system is calculated and is compared with the results of the neutron diffraction measurements. The effect of doping in the calculation is modelled by the virtual crystal and mass approximations. The electron-phonon coupling constant is then evaluated for a grid of phonon wave-vectors using the change in the potential due to phonon distortion found self-consistently. A large coupling of the electrons to the bond-stretching oxygen vibrations and especially to the breathing-like vibrations is established. Also, a strongly anharmonic potential well is found for tilting-like motions of the oxygen octahedra. This mode is not coupled to the electrons to linear order in the displacements, therefore an anharmonic contribution to is estimated using frozen–phonon method. Our total (harmonic plus anharmonic) is found to be 0.34. This is too small to explain high-temperature superconductivity in Ba0.6K0.4BiO3 within the standard mechanism. Finally, based on standard LDA and LDA+U like calculations, a number of properties of pure BaBiO3 such as tilting of the octahedra, breathing distortion, charge disproportionation and semiconducting energy gap value is evaluated and discussed in connection with the negative extended Hubbard model frequently applied to this compound.
pacs:
63.20.KrI. INTRODUCTION.
Since the discovery of superconductivity at 30K in Ba1-xKxBiO3 (BKBO) [1, 2], and from earlier studies of BaPb1-xBixO3 (BPBO) system with 13K, there is a fundamental question whether the conventional phonon mediated pairing mechanism is operative in these high– superconductors (HTSC). Doped barium bismuthates are different from the HTSC cuprates [3], since no antiferromagnetic ordering exists for the parent compound BaBiO This seriously doubts that strong electron correlations exist and are responsible for the pairing. Simple cubic superconducting phase makes BKBO and BPBO similar to the isotropic low superconductors. However, there is a number of features which makes doped bismuthates similar to the cuprates. Both systems are perovskite oxide superconductors with surprisingly low density of states at the Fermi level. This can hardly give high transition temperatures for the BCS–like superconductors. As high– cuprates are originated from antiferromagnetic insulators, the parent BaBiO3 compound is a charge–density wave (CDW) insulator in which oxygen octahedra around the Bi ions exhibit alternating breathing–in and breathing–out distortions. The Bi ions exist in the charge disproportionate state which is chemically interpreted as 2BiBi3++Bi5+. It is therefore tempting to connect the mechanism of superconductivity with the nature of these insulators.
Unfortunately, experimental estimates of the electron–phonon coupling strength do not lead to the firm conclusion on the origin of superconductivity in the bismuthates. Large isotope effect with =0.4 has been reported for BKBO [4]. Other measurements [5] give =0.210.03 for BKBO and =0.220.03 for BPBO. Using their analysis, the authors of Ref. [5] concluded that ”phononic” effects in these materials are only indicative of dressed electronic excitations. From studying the imaginary part of optical conductivity in BKBO the authors of Ref. [6] gave the value of 0.2. Electronic specific heat measurements [7] of Ba0.6K0.4BiO3 have yielded 0.32 states/[spineVcell] giving a mass enhancement factor 1.4 (0.23 states/[spineVcell] for x=0.4). A complicated situation exists with the transport measurements. The temperature dependent resistivities for superconducting BKBO and BPBO have ranged from metallic to semiconducting and two–channel model of the conductivity in the bismuthates was discussed [8]. While good grain–boundary–free thin films and single crystals of BKBO doped well away from the CDW instability seem to exhibit metallic behaviour, the values of the resistivity itself are (like in the cuprates) unusually high and are of the order a few hundred cm at room temperature This could point out that an additional (to standard electron–phonon) scattering mechanism is presented.
The most direct evidence on the importance of electron–phonon interactions in superconductivity of the bismuthates has been given by the tunnelling measurements [9, 10]. Although not identical for different junctions, the deduced Eliashberg spectral functions bear a close resemblance with the phonon density of states determined by inelastic neutron scattering [11]. The estimated values of vary from 0.7 to 1.2 which seem to be sufficient to explain high critical temperatures within the standard mechanism.
The electron–phonon coupling in doped BaBiO3 has been investigated theoretically by several methods. The authors of Ref. [12] study this problem using tight–binding (TB) fit to the energy bands which are obtained from density–functional calculations based on local–density approximation [13] (LDA). The computed Eliashberg spectral function has been found to display prominent features in the frequency range corresponding to the oxygen stretching modes and the value of =1.09 has been reported. Crude calculations based on rigid–muffin–tin approximation (RMTA) also give large 3 indicating a strong–coupling regime [14]. Two estimates of using total–energy frozen–phonon method appeared in the literature [15, 16]. Note that, in contrast to the TB and RMTA methods, the frozen–phonon calculations treat screening of the potential due to lattice distortions self–consistently. The value of the electron–phonon coupling strength equal to 0.3 for the breathing mode has been found [15] and the rough estimate of 0.5 was obtained [16] using 12 =0 phonons for ordered cubic Ba0.5K0.5BiO3.
There was a partial success in predicting structural phase diagram for the parent compound BaBiO3 within the LDA [15, 17, 18, 19]. The experimental structure mainly consists of combined tilting and breathing distortions of the oxygen octahedra corresponding to the instable R–point phonons of the cubic phase [20, 21]. While rotational instability was found in all calculations, the frozen–in breathing mode was not described by pseudopotential calculation [17] and two linear–muffin–tin–orbital (LMTO) calculations [15, 19] give the value for the breathing distortion about 30% off the experimental one. Less rigorous potential–induced–breathing (PIB) model obtained both instabilities [22] with similar accuracy. It is not clear whether these discrepancies are due to sensitivity to computational details or due to the local density approximation itself.
A great amount of work [2] has been done to understand the properties of the barium bismuthates on the basis of the negative extended Hubbard model originally introduced in Ref. [23]. The valence configuration of semiconducting BaBiO3 can be viewed as Ba2Bi3+Bi5+O6 which represents a lattice of electron pairs centred at every second Bi site (Bi3+). The sites occupied with Biions are interpreted as those with no electrons. Rice and co–workers [24] have proposed that such local pairs are stabilised by polarising the O octahedra and the effective on–site becomes negative due to the large electron–phonon coupling. Recently, Varma [25] has pointed out that negative can also be of the electronic origin due to the skipping of the valence ”4+” by the Bi ion. The latter can provide a possible explanation for a well-separated optical and transport energy gap in the bismuthates[26]. The mean–field phase diagram of the negative Hubbard model exhibits several stable phases involving a CDW semiconductor, and a singlet superconductor. This is in qualitative agreement with the experimental phase diagram [27].
The question on the origin of negative is of great interest since it may provide an insight on the superconductivity mechanism in the bismuthates. Recent calculations using constrained density–functional theory have been carried out to obtain the Coulomb interaction parameters for the Bi orbitals [28]. No indication for negative of the electronic origin was reported.
In the present work we try to address several problems seen from the above introduction by means of the state–of–the-art density functional LDA calculations. As a first problem, we study lattice dynamics of the superconducting cubic Ba0.6K0.4BiO3 using recently developed linear-response approach implemented within the LMTO method[29]. The effect of doping is modelled by the virtual crystal and virtual mass approximations. On the basis of this calculation, we estimate electron–phonon coupling in this compound. The linear–response method used by us is advantageous in contrast to the frozen–phonon approach since it allows the treatment of perturbations with arbitrary wave vectors . We have demonstrated its accuracy by calculating lattice–dynamical, superconducting and transport properties for a large variety of metals [30], and we believe that our calculated value of will be a realistic estimate for the electron–phonon coupling strength in this high–superconductor. Also, a recent publication [31] deals with the application of the linear–response method to study the electron–phonon interaction in another high– superconductor CaCuO2.
The second problem, we focus in our work, is studying the effects of anharmonicity in the electron-phonon coupling. It is widely accepted that certain phonon modes are strongly anharmonic in the high– materials. Frozen–phonon calculations produce double–well potentials for buckling motions of oxygen atoms perpendicular to the CuO planes in nearly all HTSC [31, 32, 33], chain–buckling distortions are found to be anharmonic [33] in YBa2Cu3O7, X–point tiltings of the octahedra along (110) directions are instable [34] in La2CuO4, and R–point instabilities corresponding to breathing and tilting exist in the doped barium bismuthates [15, 19, 16]. The influence of anharmonicity to high–temperature superconductivity has been addressed in several publications [35, 36, 37], especially because of the small isotope effect found for HTSC cuprates. Triple–degenerate pure rotational mode at the R point of cubic ordered Ba0.5K0.5BiO3 was predicted to exhibit a double–well potential and some estimates of the anharmonic contributions to have been given [16]. We extend this analysis by solving numerically Schrödinger’s equation for the anharmonic potential well found from frozen–phonon calculations. The anharmonic is then computed along the lines proposed in Refs. [37, 38] by estimating the electron–phonon matrix elements from the energy bands computed for different tilting distortions. We conclude, in accord with the previous findings [16], that this contribution, while not decisive, is not negligible for the total value of .
The third purpose of our work is to study the properties of the undoped parent compound BaBiO3. We try to answer the question whether the LDA gives an adequate description of the ground state properties for this charge–density–wave insulator. Since there was some inconsistency reported in previous calculations [15, 16, 17, 18, 19], we want to rule out possible sensitivity of the final results to the internal parameters used in our band structure calculations with the full–potential LMTO method [39]. We carefully choose our LMTO basis set, number of points, plane wave energy cutoff and other parameters by examining the convergency of the total energy and the calculated properties with respect to them. Based on the well converged data, we come to the conclusion that the breathing distortions are seriously underestimated (ideally, absent) in the LDA, and, therefore, the insulated state is not correctly described. This strongly resembles the situation with the antiferromagnetic ground state of the cuprates superconductors which is also not described by the LDA [40]. We perform a number of model calculations in the spirit of the LDA+U method [41] in order to clarify this problem.
The rest of the paper is organised as follows: In Sec. II, our linear–response calculations of the lattice dynamics and the electron–phonon interactions in doped BaBiO3 are described. Sec. III considers anharmonicity corrections to for the tilting motions of the oxygen octahedra. Sec. IV reports our LDA and model calculations of the ground state properties for pure BaBiO In Sec. IV we give our conclusions.
II. HARMONIC PHONONS AND
This section presents our results on the lattice dynamics and the electron–phonon interaction for the cubic perovskite superconductor Ba0.6K0.4BiO We also summarise the main features of the calculated electronic structure and discuss our predicted equilibrium lattice configuration. The band structure calculations are performed with the highly precise full–potential LMTO method [39]. The details of the calculations are the following: The effect of potassium doping is taking into account using virtual crystal approximation (VCA) by considering a fractional nuclei charge =55.6 at the Ba site. Numerous supercell investigations [16, 42] of the doping influence on the calculated energy bands justify the applicability of the VCA. A multiple, three– LMTO basis set with the tail energies equal to -0.1,-0.8, and -2 Ry. is employed for representing valence wave functions. The valence states include and orbitals of Bi, orbitals of O, and orbitals of Ba. Such semicore states as orbitals of Bi, orbitals of O, and orbitals of Ba are treated as bands and are included in the main valence panel using two LMTO basis with =-0.1,-0.8 Ry. The main panel also includes unoccupied orbitals of Ba with the 2 basis and orbitals of Ba with the 1 basis (=-0.1 Ry). Deeper lying states of Ba are resolved in a separated energy panel. All other states are treated as core levels. The muffin–tin sphere radii were taken to be: =3.25 a.u., =2.25 a.u., and =1.80 a.u. All calculations are performed at the experimental lattice constant a=8.10 a.u. The Barth–Hedin–like exchange–correlation formula after Ref. [43] is used. The valence bands are treated scalar relativistically and the core levels - fully relativistically. A number of points for the Brillouin zone (BZ) integration using an improved tetrahedron method [44] is taken to be 20 perth BZ. The charge density and the potential in the interstitial region are expanded in plane waves with the cutoff corresponding to the (28,28,28) fast–Fourier–transform (FFT) grid in the real space (approximately 10000 plane waves).
We first summarise the main features of the calculated electronic structure in doped BaBiO3. The occupied part of the bands (see Fig. 1) mainly consists of Bi–O hybridised band complex. This is in accord with the previous calculation[42]. For the cubic perovskite phase, there is only one band crossing the Fermi level, which is an antibonding Bi–O band. Similar situation is found in the cuprate superconductors where Cu–O antibonding bands dominate at the Fermi energy . A simple tight–binding model involving Bi, O orbitals, and two–centre nearest–neighbour interaction can be used to understand the principal features of these energy bands[45]. It was early noted [45] that for the case of half–filling (undoped cubic BaBiO3) this model has a perfectly nested Fermi surface for the wave vector corresponding to the R–point. Therefore, it is tempting to interpret the appearance of breathing distortions as commensurate Peierls instability and cubic perovskite Ba0.6K0.4BiO3 as a doped Peierls insulator [46]. To understand whether nesting can bring any effect in static susceptibility, we have analysed –dependence of the function
| (1) |

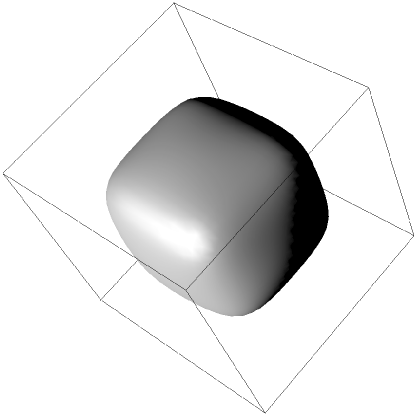
for the realistic energy bands (relative ) using experimental structures. We conclude that the nesting is far from perfect in the case of half–filling and dimerisation of the oxygen octahedra can hardly be connected with it. A realistic TB model should also include Bi orbitals and their nearest–neighbour interaction with O states [45, 28]. Upon potassium doping, the bands hardly change except for a slight lowering of away from half–filling. For Ba0.6K0.4BiO3 the Fermi surface represents a rounded cube centred at the point as shown in Fig. 2. Analysis of the band structure factor given by Eq. (1) as a function of shows featureless behaviour and any effect of the nesting enhancement on the electron–phonon interaction is not expected for this band dispersion.
We second discuss our results for the calculated equilibrium lattice configuration in Ba0.6K0.4BiO3. The theoretical–to–experimental volume ratio is found to be 1.01, and the calculated bulk modulus is equal to 1.25 Mbar. Both neutron diffraction[21] and x–ray–absorption–fine–structure[47] (XAFS) measurements show that frozen–in breathing distortions are absent in the superconducting phase. We have performed frozen–phonon calculations for the doubled cell corresponding to the –point and for several breathing distortions. The total energy minimum shows that the undistorted cubic phase is stable in accord with these experiments. The curvature is well fitted with standard parabola, which shows that the breathing mode is harmonic in the superconducting phase.
We further investigate tilting of the octahedra. Experimentally, for the undoped compound the octahedra rotated[21] at the angle 11.2∘ along (1,1,0) axe. More complicated situation exists in the superconducting phase. According to the neutron diffraction data [20], the average structure is cubic although presence of a weak long–range superstructure characterised by the octahedra rotations at the angles about 3∘ was also found[48, 49]. Recent XAFS measurements [50] report on the locally disordered rotations. From their analysis, the authors of Ref. [50] conclude that the rotations can either be along (1,1,1) or (1,1,0) axe. Previous frozen–phonon calculations [16] performed for the ordered Ba0.5K0.5BiO3 investigate (1,0,0) component of the tilting mode which is found to be unstable with the total energy minimum corresponding to the angle 7∘.
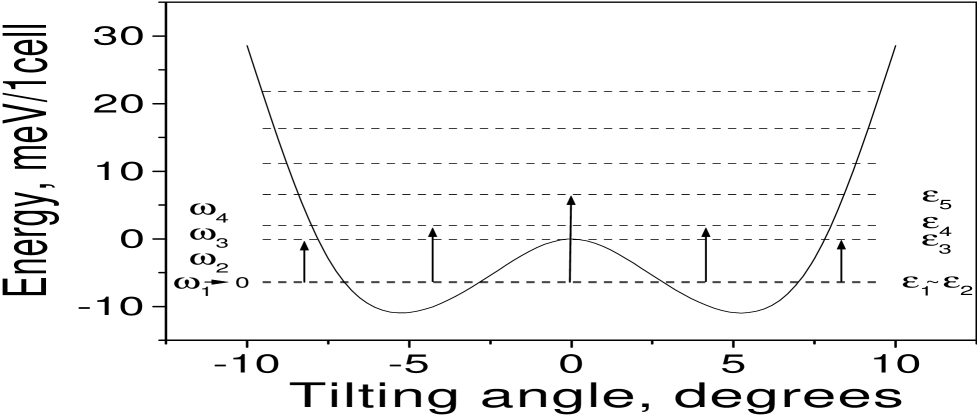
Our own total–energy calculations also confirm the existence of tilting distortions. Fig. 3 shows that the total energy exhibits a double well behaviour as a function of the rotation angle. We choose (1,1,0) axe for the tilting as is the case in the undoped compound. The unit cell in the calculation is doubled according to the R point of the cubic phase. The total energy minimum is found at the angle equal to 5 The energy gain compared to the cubic phase is only 10 meV/(1cell) which indicates that at the temperatures of the order the rotations can be dynamic. The double well behaviour at such small energy scale unambiguously points out on the importance of evaluating anharmonicity contribution in total electron–phonon coupling. This problem will be discussed in the following section.
We now report our main results on the calculated lattice dynamical properties of Ba0.6K0.4BiO3. The density functional linear–response approach [29] implemented on the basis of the full–potential LMTO method [39] is used in this calculation. The dynamical matrix is computed at 20 irreducible points corresponding to the (6,6,6) reciprocal lattice grid of the cubic BZ. The effect of the potassium substitution on the phonon spectrum is taken into account by virtual mass approximation. The LMTO basis set and other technique details have been described above. One more comment should be said on evaluating BZ integrals in the linear–response calculation. Here, one can essentially improve the accuracy of the integration by using a multigrid technique [29]. A (6,6,6) grid (20 irreducible –points) is used for finding linear–response functions while the effects of the energy bands and the Fermi surface are taken into account using a (30,30,30) grid (816 irreducible –points).
The calculated phonon spectrum along major symmetry directions of the cubic BZ is plotted in Fig. 4 . Solid circles denote the calculated points and the lines result from interpolation between the circles. Several features can be seen from these phonon dispersions. Three high–frequency optical branches around the 17 THz are well separated from the other modes distributed in the frequency range from 0 to 10 THz. The high–frequency modes mainly consist of the oxygen bond–stretching vibrations. The longitudinal branch at the point corresponds to the breathing mode which in our calculation has a frequency 15.7 THz. From the analysis of our polarisation vectors, we conclude that oxygen bond–bending vibrations dominate in the frequency interval between 6 and 10 THz. The octahedra tilting modes are at the low–frequency interval. They exhibit significant softening near the –point =(1,1,1). Due to symmetry, one can talk about pure tilting at the line between –point =(1,1,0) and the point. Exactly at the point nearest octahedra tilt in–phase and they tilt out–of–phase at the R–point. A nearly–zero–frequency triple–degenerate mode exists at =(1,1,1) which corresponds to the pure rotational phonon. In fact, for =0 this mode should have a slightly imaginary frequency for the cubic structure according to our frozen–phonon analysis illustrated in Fig. 3 . But, due to numerical inaccuracies the linear–response calculation gives very small positive =0.5 THz. No significant softening of the tilting modes near the point is predicted by our calculation.
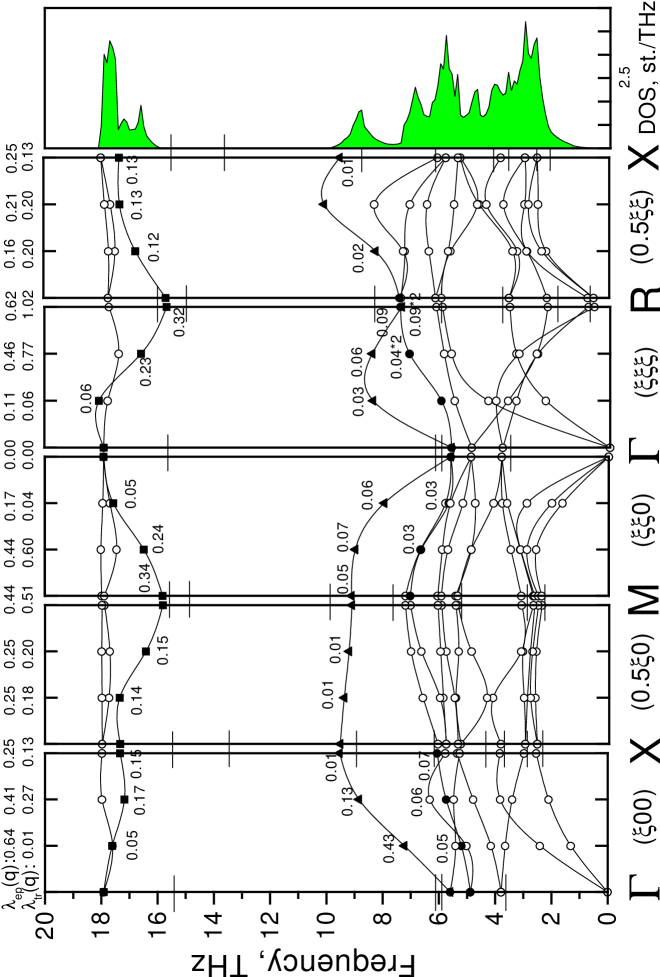
The phonon dispersion curves along , and symmetry directions for Ba0.6K0.4BiOhave been very recently measured by inelastic neutron scattering [48, 49]. Horizontal lines in Fig. 4 indicate measured phonon frequencies at the symmetry points , , and e as we were able to deduce them from Fig. 1 of Ref. [49]. The existence of soft rotational modes near can be directly seen from the measured phonon dispersions. The authors of Ref. [49] have reported that their samples still have a week long–range superstructure characterised by the tilting of the octahedra. An extremely low frequency 0.9 THz of these modes was measured. This is in agreement with our calculations.
Two other comments should be said on the comparison between our theory and the experiment. One comment concerns frequency interval from 0 to 10 THz. Here, our calculation is seen to reproduce measured phonon dispersions with the accuracy of the order 10%. In particular, the lowest mode in has =3.79 THz which can be compared with 3.5 THz. This mode mainly involves Ba(K) and Bi vibrations. The next mode in is the oxygen out–of–phase mode. Here, =4.88 THz and the measured frequency is less than 6 THz. The so–called ferroelectric mode has a frequency 5.59 THz in our calculation which is close to found near 6 THz. This mode is bond–bending longitudinal and it has the strongest polar character. Usually it exhibits large splitting from the TO mode at in cubic perovskites. The presence of free charge carriers screens Coulomb interaction at long distances, and therefore, the LO–TO splitting is absent in our calculation. The dispersion of the ferroelectric mode as a function of is also seen to be correctly reproduced.
The second comment concerns our comparison for the high–frequency interval, where the results of the calculations are found to be less accurate and the overall discrepancy consists about 20%. The highest mode at is Bi–O bond–stretching mode. Here, we report the value of equal to 17.91 THz and the value only slightly larger than 15 THz was found experimentally. The authors of Ref. [48] discuss an anomalous dispersion for the longitudinal optical branch of the one–dimensional breathing mode along with its pronounced frequency renormalisation. Our calculation, on the other hand, gives much less dispersive optical branches along this direction as can be seen from Fig. 4. It is not clear whether this result is due to inhomogeneity of the potassium distribution or other imperfectness of the samples used in the experiment or due to drawbacks in our calculation connected with the virtual crystal approximation. In fact, it is clearly seen that all our high–frequency branches are overestimated by 20% in contrast to the experimental ones (except eventually the breathing vibrations near the point ). This result also follows from the comparison of our calculated and the measured[11] phonon density of state [see Fig.5(a)]. It was found experimentally [11] that the oxygen bond–stretching modes exhibit softening with the substitution of Ba by K. These modes are located at the energies 70meV (or 17 THz) in undoped BaBiO3. Therefore it is tempting to connect possible source for the discrepancies with our poor treatment of doping. The authors of Ref. [11] discuss doping induced appearance of localised holes on the oxygen 2p orbitals which screen the charge on the oxygen anions. This charge reduction will lower the energy of these modes. If the localised hole picture is correct, the VCA will not capture this since it removes electrons from the conduction band by(uniform distributing the holes between O() and Bi() orbitals.
We now report our results for the calculated electron–phonon interaction. Based on our screened potentials which are induced by nuclei displacements and are found self–consistently, we evaluate matrix elements of the electron–phonon interaction, . The standard expression [51] for the electron–phonon matrix elements reads as
| (2) |
where are the orthonormalised polarisation vectors associated with the mode , are the atomic masses, runs over basis atoms in the unit cell and runs over directions ,,; denotes self–consistent change in the potential associated with the –wave displacements of atoms along axe. In practical calculations we have also added so–called incomplete basis set corrections to the matrix elements (2) according to the method developed in Ref. [30]
The coupling strength for the electrons with the phonon of wave vector and branch is given by the following integral
| (3) |
where is the density of states at =0 per cell and per one spin. Indexes and numerate the bands (not spins) and spin degenerate case is assumed throughout the paper. The total coupling constant results by summing over and by averaging over BZ. Two delta functions in (3) impose integration over the space curve resulting from the crossing of two Fermi surfaces separated by . For this integral we have used as many as 816 –points per irreducible BZ.
The calculated values of at the symmetry directions of the BZ are indicated in Fig. 4 along with the calculated phonon dispersions. (We emphasise only the values larger than 0.01.) On top of the figure shown are the values of which are summed over all branches for given . It is seen that the electron–phonon coupling is large for the high–frequency bond–stretching longitudinal branch. This result is expectable from band structure calculations[45] since bond–stretching and especially breathing vibrations produce modest changes in the energy bands near . Coupling is strongly enhanced near the points and , where it reaches the values 0.3. Here, the mode corresponds to two– or three–dimensional breathing. The value of =0.3 for the breathing mode at R is in accord with the previous frozen–phonon calculation[15]. The authors of Ref. [16], on the other hand, give much lower value for equal to 0.04. For other bond–stretching vibrations, we find of the order 0.1.
From Fig. 4 we conclude that the electron–phonon coupling is not small for the bond–bending oxygen modes. It is seen that is enhanced for the wave vectors near and also along direction. In the latter case, the vibrations correspond to the ferroelectric mode and the value of as high as 0.43 is found for the –point (1/3,0,0). Strongly anharmonic tilting modes, on the other hand, do not exhibit noticeable electron–phonon coupling in the linear order with respect to the displacements. Exactly at the point , these modes have electron–phonon matrix element equal to zero by symmetry, and, therefore, small values of do not bring any effect on enhancing the coupling. We refer to the following section on our evaluated anharmonicity corrections.
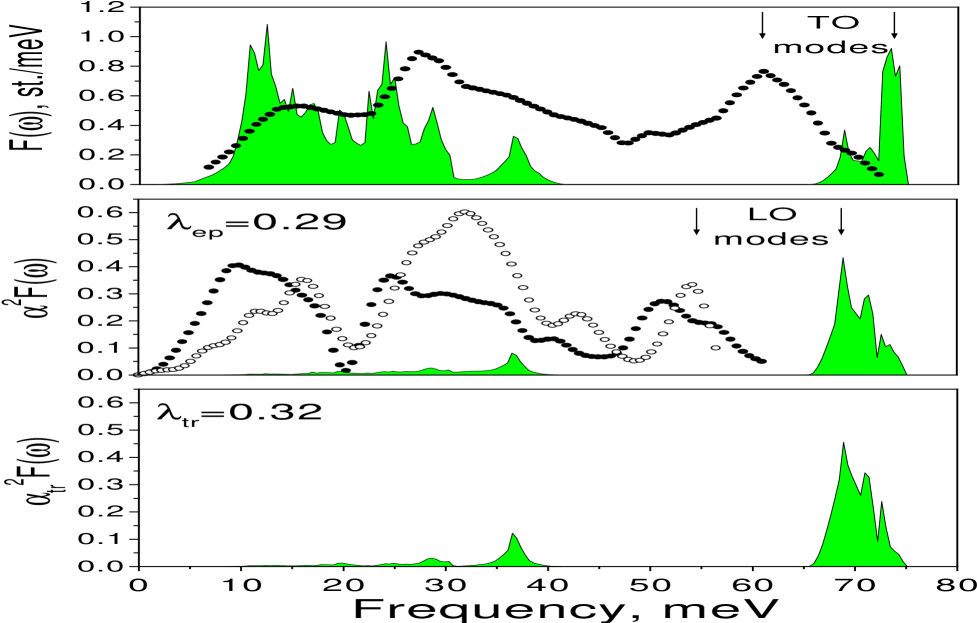
On the basis of our evaluated phonon dispersion and –dependent electron–phonon interaction we calculate the Eliashberg spectral function . This is plotted in Fig. 5(b) by full lines. There, we also show by symbols two which were deduced from the tunnelling measurements[9]. Comparing the experiment with our calculations, it is first seen that the intensities of high–energy peaks are approximately the same which means that we reproduce the coupling for these phonons sufficiently accurate. It is also seen both from the theory and the experiment that while in the phonon density of states [Fig. 5(a)] mainly the TO phonons contribute to the high–energy structure, for the these are the LO phonon modes. Our tendency to overestimate the phonon frequencies at high energies is again clearly distinguishable.
The most prominent feature seen from our calculated is the absence of any structure for the low–frequency interval below 40 meV. This strongly contradicts with the experimental which exhibits two intensive peaks in this region centred at 15 and 30 meV. According to our analysis of partial , the origin of the first peak could be due to low energy Ba(K) and Bi vibrations together with the tilting modes, and the second peak can result from the bond–bending oxygen modes. It is not clear however why the calculation seriously underestimates the electron–phonon coupling for these phonons, while it correctly describes the coupling for the bond–stretching modes. From the band structure arguments[45] one can expect that only bond–stretching modes will have large interaction with electrons. The bond–bending modes cannot produce any significant changes in the bands near since interaction for these kind of distortions is not changed in linear order. The same is true for the tilting modes. Since there is no partial weight of the Ba(K) orbitals at we also do not expect strong electron–phonon coupling for the low–frequency interval.
Another possible explanation for the observed peaks is due to the contributions connected with anharmonicity. For the anharmonic phonons, not only one–phonon virtual transitions must be seen in the , but also higher order virtual states. The detailed discussion on this subject will be presented in the next section, here we only give the value 0.04 as our final answer for the anharmonic contribution to resulting from the tilting motions. While not negligible, this value alone again does not explain the intensity of the experimental at low–energies.
Our calculated total value of resulting from the harmonic phonons and linear electron–phonon coupling is found to be 0.29. This is too small to account for the superconductivity at 30K in the compound Ba0.6K0.4BiO3. In fact, only the high–energy phonons contribute to our coupling. As a result, our estimated value of as high as 550K is found. Using McMillan’s expression[52] with =0 we however find the critical temperature with our set of parameters as low as 4.5K. One can try to estimate the error in our value due to the overestimation of the frequencies for the bond–stretching modes. Using the expression [52]: , where is the electronic prefactor and is an average force constant, one sees that should increase with lowering Our 20% error in results in 30% error in , and this can lead to the actual values which are 30% higher than we calculate. However, 0.4 is also not sufficient to explain the value of .
Our calculated electron–phonon contribution to the transport properties is a final subject of this section. The quantities responsible for the electronic transport are easily deduced from the linear–response calculations [30]. By inserting the electron velocity factor to the expression (3), we calculate transport constant . Its –dependence is shown at the top of Fig. 4 along with the –dependence of the electron–phonon . We see that both functions exhibit very similar behaviour in the BZ. The transport spectral function is the central quantity needed for evaluating temperature–dependent electrical and thermal resistivity as low–order variational solutions of the Boltzmann equation [53]. Our calculated is shown in Fig. 5(c). It is seen that this function behaves closely to the superconducting which is usually the case in metals[30]. The total average is found to be 0.32. Based on these data, we evaluate electron–phonon limited electrical resistivity to be 14.3 at =273K. This is at least one order of magnitude lower than the values of reported in the literature[8]. It is clear that the source for this discrepancy is the same as in our describing superconducting properties. It is unlikely that the strong electronic correlations are presented in these materials because the parent compounds are diamagnetic (not antiferromagnetic) insulators. Therefore, it is unlikely that other (than electron–phonon) scattering mechanisms take place, as spin fluctuations, for example, in HTSC cuprates. Taking into account anharmonic phonons, polarons, or bipolarons may be decisive for describing the superconductivity and transport phenomena here. Our basic conclusion is that the conventional ideas on the electron–phonon mechanism are not operative in the bismuthates.
III. TILTING AND ANHARMONIC
Towards further understanding of superconductivity in the bismuthates, we try to evaluate anharmonicity corrections in the electron–phonon interaction. As we have mentioned in the introduction, several experiments and numerous frozen–phonon calculations point on possible importance of these effects in the theory of HTSC cuprates[33, 34, 35, 36, 37]. In the bismuthates, the first candidate to study anharmonicity is the tilting mode: Our linear–response calculations give nearly zero–frequency vibrations for this mode at the –point of cubic BZ. Our own (and previous[16]) frozen–phonon calculations predict here a double–potential–well behaviour with very shallow energy minimum at 5∘ as illustrated in Fig. 3. Despite the reported average structure for the superconducting phase is cubic [21], some experiments [48] discuss the existence of long–range superstructure characterised by the rotations of the octahedra. Recent XAFS measurements [50] report on the presence of locally disordered rotations.
Unfortunately, though formulated [54], the problem of the influence of anharmonicity to superconductivity is not tractable numerically in a full volume. Our simplified treatment is based on the expression introduced by Hui and Allen [38] which generalises zero–temperature electron-phonon coupling to the anharmonic case by including matrix elements over all phonon excited states. The phonon states and their energies are obtained by solving the Schrödinger equation for an oscillatory mode characterised by and . (We will not label the states with ( for simplicity). For harmonic potential wells is just (in atomic units), where is the phonon frequency. This leads only to the one–phonon virtual states (=1) which are involved in the matrix elements of the electron–phonon interaction. For anharmonic potential wells the spectrum is generally different from the set of equidistant levels. One example is a double well of the tilting mode which is shown in Fig. 3 The real spectrum obtained as the solution of the Schrödinger equation is plotted in Fig. 3 by horizontal lines. Therefore, our first purpose is to examine what effect in our would bring the proper treatment of all virtual phonon states. The second problem is connected with the modification of the electron–phonon matrix elements due to higher–order terms in the expansion of the change in the ground state potential with respect to the atomic displacements. Since we wish to examine these effects only for the tilting mode at the point of the cubic BZ, we make an essential approximation by assuming that the tilting mode is not coupled to the other modes of either this wave vector or other wave vectors which is generally not true when anharmonic terms are included into the lattice dynamical problem. We assume that the polarisation vectors for this mode are known and are given by exactly the out–of–phase rotations of the nearest octahedra along the (1,1,0) axe. Any processes of phonon–phonon interactions will be neglected in this treatment. We also neglect by the finite–temperature effects using the arguments given in Ref. [37] In the double–well problem one expects that the modifications due to frequency and electron–phonon–matrix–elements renormalisation are quite dramatic [35, 37] and bring the largest effect in the values of .
We start from a general zero–temperature expression for the electron–phonon coupling in anharmonic case, which can be written as follows [38]
| (4) |
where . For the moment we will not assume as in Ref. [38] that are small at the electron energy scale. (The latter reduces the integral with the Fermi step functions to the integral with the delta functions as given by Eq. 3.) We introduce a generalised matrix element for the virtual transition to the ’s phonon state:
| (5) |
The electron–phonon matrix element in (5) involves the transitions between the states and near the Fermi surface
| (6) |
where is the total change in the ground state potential induced by the lattice distortion associated with the mode . We have especially included in the notation since is not a derivative of the potential with respect to the displacements but it is the difference between the self–consistent potential for the distorted crystal and the potential for the undistorted crystal. The atomic positions at the equilibrium are given by the vectors , where denote the translations and are the basis vectors. The displacements associated with the mode are described by the vector field . Therefore is proportional to and so does . By introducing complex (infinitesimal) polarisation vectors of the mode [55] , the displacements in any atomic cell can be found using the formula:
| (7) |
where runs over directions , and stands for the complex conjugate. (The quantities , , and should, in principle, be labelled with but we omit this for simplicity.)
The phonon states are the functions of the displacements or . In order to compute the matrix element over the phonon states we should expand with respect to the displacements. Keeping the terms up to second order, this expansion reads as
| (10) | |||||
Here, is associated with the first–order derivative of the potential when a single nucleus centred at experiences an infinitesimal displacement along –th direction, and stands for the second–order derivative. [Notation is shorthand for ] Obviously, both these response functions have no dependence on the mode If has a periodicity of the original lattice, the change is a function of general type. One expects that is only not zero in the vicinity of the displaced atom and it goes to zero when departs from the site . However, because of the translational invariance of the original crystal, considering the response at the point due to the movement of atom in must be equivalent to considering the response at the point due to the movement of atom at (when =0). Therefore we can write that We now introduce the lattice sum
| (11) |
which represent a variation of the potential per unit displacement induced by to the movements of atoms along –th axe by infinitesimal amount proportional to in every cell It is easy to prove that the expression (11) translates like a Bloch wave with wave vector in the original lattice, i.e. . (We will sometimes omit indexes Notation refers to the travelling wave of vector while complex conjugated quantity would refer to the travelling wave of vector .
One can analogously define lattice sums associated with the second–order changes of the potential. These enter the second and third contributions in (11). Consider, for example, the lattice sum associated with the second contribution:
| (12) |
This expression translates like a Bloch wave of vector because
| (13) | |||
| (14) | |||
| (15) |
Analogously, the lattice sum associated with the third contribution in (11) can be denoted as . It represents a travelling wave of wave vector , i.e. it is periodical at original lattice.
Using the notations (11), and (12), the change in the potential given by the formula (10) now has the form
| (18) | |||||
It is clear that when this expansion is used in the matrix element (6), certain selection rule will occur for the wave vectors and . Namely, the matrix element is equal to zero unless , =0 unless , and =0 unless .
Let us now introduce the electron–phonon matrix element associated with the first–order change in the potential
| (19) |
The electron–phonon matrix elements associated with the second–order changes in the potential have two forms according to the second and third contributions in (18)
| (20) |
| (21) |
Then, the expression (4) for splits into three contributions
| (22) |
associated with one electron–phonon matrix element from the first order, Eq. (19), and two matrix elements from the second–order, Eqs. (20), and (21), i.e.
| (23) | |||||
| (24) | |||||
| (25) |
The double sums over and appeared in (4) are now reduced to the single sums over according to the selection rules in the matrix elements (19), (20), and (21). Taking into account matrix elements coming from the complex conjugated quantities , , and gives contributions with wave vectors , and However making substitutions and in the –space integrals of (4) results in extra factor of 2 which appears in (23), (24), and (25) compared to (4).
We now discuss the derived expressions. First, it is instructive to see how Eq.23 for goes to the standard formula (3). For the case of harmonic oscillator we can use the properties of Hermite polynomials and prove that the matrix element over the phonon states appeared in (19) is reduced to
| (26) |
where denote ortho normalised polarisation vectors of the mode in contrast to which are related to the actual nuclei displacements [55]. The matrix element (26) is only not zero for the transitions including one–phonon virtual state. Substituting (26) into (19) gives exactly the formula (2). By placing (19) to (23) we see that only =1 term in the sum over survives, and the energy difference is equal to . The standard formula (3) is then recovered [51] by replacing ( to which is valid for small .
Second, it should be noted that the number of matrix elements necessary to reach the convergency in the sum over is actually not large. From the numerical estimates of the oscillator strengths for the transitions from the phonon ground state to excited states the authors of Ref. [38] concluded that the f–sum rule (sum over all oscillator strengths gives unity) is closely satisfied by taking into account only single term Even for infinite rectangular well which represents an extreme case for anharmonicity, =5 is sufficient[38]. Our own numerical experiments with the double–potential well of the form shown in Fig. 3 confirms this conclusion both for the dipole matrix elements and for quadrupole ones. This implies that the phonon excitation energies appeared in the expressions (23), (24), and (25) are still too small at the electronic energy scale and, therefore, all integrals over are reduced to the integrals over the space curve resulting from the crossing of two Fermi surfaces separated by . It then follows that the expression for is always equal to zero unless there are electronic inter band transitions with zero momentum transfer at the phonon energies. The latter standardly is not assumed. We therefore left with the following formulae for and :
| (27) | |||||
| (28) |
Another comment concerns the expressions (24) and (28) for which involves electronic intraband transitions with momentum transfer equal to . If wave vector is such zone–boundary vector that , where is one of the reciprocal lattice vectors, then it is obvious that =0 according to the arguments given above. The situation here is analogous to the discussion of contributions to from the optical phonons (see, for example Ref. [32, 56]). It is well known that exactly =0–phonons do not couple to the electrons since the energy cannot be conserved. Therefore, small but finite vectors , where is the Fermi velocity, must be considered.
We now discuss implications of the theory given above for the tilting mode in Ba0.6K0.4BiO3. Exactly for the –point =(1,1,1) the contribution to connected with the first–order changes in the potential, , vanishes due to symmetry of the matrix elements. Also the contribution connected with the second–order changes, , is zero since vector is equivalent to the point. The contribution is always zero since there is only one band crossing and there is no interband transitions near . In the higher orders, there are contributions to connected with the odd–order changes in the potential and with the even–order changes. In the odd orders, changes in the potential would represent travelling waves of vectors etc., and the contributions to would be equal to zero due to symmetry of the matrix elements. In the even orders, changes in the potential would represent travelling waves of vectors etc., which are all equivalent to the point when =(1,1,1), and corresponding contributions to also vanish. Therefore, we conclude that pure rotational mode at does not couple to the electrons in any order.
In order to obtain an estimate of the effect, we must, in principle, step out from the point . Unfortunately, for general we cannot perform frozen–phonon calculations of anharmonic coefficients, and the problem looses its numerical tractability. Another approach is to discuss quantities resulting from the integration of the expressions (27), and (28) over . In this way, we should assume that the matrix elements and have no –dependence (which is generally not true but the order of magnitude of the effect will be certainly captured) and can be approximated by the values at the point . Therefore, the contribution resulting from the integration of disappears due to symmetry of at , and integration of over gives:
| (29) |
(Here we have assumed that is equivalent to .) The obtained expression is an average of squared deformation potential which is induced by the tilting of the octahedra in the second order with respect to the displacements. It has the same meaning as discussed in the literature [32, 56] magnitude of the change of the phonon self–energy due to transitions across the gap in the superconducting state (so called superconducting ).
The value of can be readily evaluated using the frozen–phonon method. Let us measure [55] the tilting distortions by tilting angle Quadrupole matrix elements between the phonon states are then given by and the electron–phonon matrix elements are where is the second–order derivative of the potential with respect to the tilting angle taken at =0. The matrix elements can be approximated [58] by the second–order derivatives of the one–electron energies relative to They are accessible from band structure calculations. Using this, the formula (29) for can be rewritten as follows
| (30) |
where the quadrupole matrix elements and the energy differences are obtained by solving the Schrödinger equation for the double potential well shown in Fig. 3. Only even–order matrix elements are allowed by symmetry of our distortion, and therefore, the transition between nearly degenerate first and second states shown in Fig. 3 (i.e. ) does not contribute [57] to .
In order to evaluate (30), we first calculate energy bands relative to for a set of distortions , and then integrate
| (31) |
over the unperturbed Fermi surface. Due to symmetry, the energy bands have only even terms in the Taylor’s expansion over around =0. The function is fitted to the polynomial starting with Then, our is
| (32) |
Using frozen–phonon calculation, we evaluate =2.991 Ry/rad4. Solving the Schrödinger equation for the double well, we also evaluate the sum over in (32) equal to 0.0044 radRy. This gives the total estimated =0.013. Since the tilting mode is triple degenerate, the final result is obtained. It can be compared with the value 0.11 previously reported by Kunc and Zeyher [16] who used a somewhat analogous approach. Unfortunately no details were presented in Ref. [16] and, therefore, it is difficult to determine the main source of our discrepancies.
Despite several approximations were made in the above derivation, we think that the values of the order (to 0.11) can be realistic for anharmonic contribution to from the tilting modes involving large ionic excursions. This constitutes about 20% of the value 0.29 found by the linear–response method. Unfortunately, our total harmonic plus anharmonic =0.33 is still too small to account for the superconductivity at 30K in Ba0.6K0.4BiO3.
In order to have large effect in due to anharmonicity, one has to analyse three contributions in Eq. 30. The first one is connected with the changes in the energy bands. The second contribution goes from the matrix elements which can be large if large atomic displacements are possible due to the flatness of the potential well of the oscillator. This is exactly the case for tilting distortions. The third contribution can go from the energy denominator in case values =become sufficiently small [57].
The fact that our anharmonic is small is due to small changes in the one–electron energies associated with tilting. This is so because the tilting distortions do not change the distance between Bi and O atoms, thus keeping nearest–neighbour interaction nearly constant. Possible large contribution from the energy bands would be expected for breathing distortions. Unfortunately we have not found strong anharmonicity for the breathing potential well in doped BaBiO3. It is however known that in the undoped compound there exist frozen breathing distortions which correspond to a deep–double–well situation. It could be possible that our LDA description of breathing distortions is not completely correct. The following section is devoted to this question.
IV. BREATHING AND LDA
So far we have discussed the compound Ba0.6K0.4BiO3 which is a metal in its normal state. Our calculations show that such ground state properties as equilibrium structure and lattice dynamics in the adiabatic approximation are reproduced by the density functional LDA method reasonably well. This suggests that our description of the electron–phonon interactions based on the LDA energy bands is realistic. We now turn to the discussion of the undoped parent compound BaBiO It is known for many years that pure BaBiO3 is a charge–density–wave semiconductor in a sense that two bismuth atoms exist in the charge disproportionate state Bi4±q. This leads to the modulated Bi–O distances (breathing distortions) in the cubic perovskite lattice. In addition, there are strong tilting distortions [20]. The nature of the disproportionate state is still not very well understood and several explanations involving Fermi surface nesting [45], a real space pairing based on strong electron–phonon interaction [24], and the existence of negative electronic due to Bi4+ valence skipping [25] have been suggested in the past. It is also unclear whether there is any connection between the origin of the semiconducting behaviour and the doping induced superconductivity a the border of metal–insulator transition.
If intra atomic correlations of Bi electrons are strong and responsible for the appearance of negative , one expects that the LDA theory will fail to describe the charge–disproportionate state. This exactly happens in HTSC cuprates where due to large positive of Cu electrons, an antiferromagnetic ground state of undoped cuprates was not predicted by the LDA [40]. If, on the other hand, negative is due to strong electron–lattice coupling [24], the LDA should quantitatively explain the observed instabilities. (It is likely that the nesting idea is not very convincing as we discussed in Sec.II of this paper. The breathing instability, for example, has not been found in La2CuO4 where the same logic is valid.)
Several total energy LDA calculations of the structural phase diagram for pure BaBiO3 exist in the literature [15, 17, 18, 19] and the results seem to be inconsistent. Pseudopotential calculations [17] predicted rotational but not a breathing instability. In contrast to that, pure breathing distortion with large energy lowering -50 meV/(1cell) has been found [18] by the linear–augmented–plane–wave (LAPW) calculation. A third calculation [15] based on the full–potential LMTO method [59] gives here nearly zero 0.7 meV/(1cell) with the equilibrium value for pure breathing. Using the same method [59], the authors of Ref. [19] calculate 20 meV/(1cell) and The calculations of the total energy as a function of combined tilting plus breathing ( distortions have also been reported. The first such calculation [15] predicts -14 meV/(1cell) relative to rotational energy minimum, and . The second calculation [19] gives -40 meV/(1cell), and . Note that the experimental values found for =150K are: and A less rigorous potential–induced–breathing model predicts [22, 60] these properties with similar accuracy. In addition, the reported [15] frequency =46 meV of the breathing mode is too low comparing to the measured [11, 48] values meV.
These large discrepancies in predicting structural properties of BaBiO3 seem to contradict with the accuracy of LDA which standardly is of the order a few per cent. This could already signalise that the ground state of this semiconductor is not completely captured within mean–field LDA solution. Also, another possible reason for the obtained discrepancies could be due to unusual sensitivity of the calculated properties to the computational details.
We have performed our own studies of the structural phase diagram for pure BaBiO3 based on the highly–precise full–potential LMTO method [39]. We have indeed found that there is a sensitivity of the final results to the details of the calculations, and we will discuss this due course. However, we have also found that serious errors are introduced by the LDA. Our general set–up for the calculations is the same as was used for the doped compound Ba0.6K0.4BiO3. It has been described at the beginning of Sec. II of this paper.
As a first step we check an equilibrium cell volume. The value of is found and the calculated bulk modulus is equal to 1.29 Mbar. These values essentially depend on the treatment of the semicore states. Especially, treating deep lying Bi states in the main valence panel, i.e. allowing their full hybridisation with the valence states, is found to be crucial for the appearance of the total energy minimum itself. Such sensitivity is due to the fact that the ground state potential is highly not spherical. In the Bi–O directions, the potential exhibits a pronounced minimum ( Ry down its average value at the Bi MT–sphere), and the average kinetic energy of Bi orbitals in the interstitial region is nearly zero. As a consequence, the character of Bi electrons appears at O atoms. In the Bi–Ba directions the potential exhibits large maximum ( Ry up its average value at the Bi MT–sphere), and the kinetic energy here is large negative. Kinetic energy variation about 1 Ry leads to necessity to use multiple LMTO basis even for semicore states.
We now report our results for the calculated tilting instability. The unit cell is doubled in this calculation according to the –point of the cubic phase. The rotations of the octahedra are performed along the direction (1,1,0) as in the experiment [20]. The calculated versus tilting angle is shown in Fig. 6. A pronounced minimum corresponding to the angle is found by our calculation, and large energy lowering 200 meV/(1cell) is predicted. Note that for the doped compound, the calculated energy lowering becomes only -10 meV/(1cell) as can be seen from Fig. 3. The tilting angle calculated by us agrees with the experiment [20] within the same accuracy as previously reported [15, 19]. However, our calculated disagrees with =24 meV/(1cell) of Ref. [15] and with =60 meV/(1cell) of Ref. [19]. To check the sensitivity of our values to the treatment of semicore states, we have performed the calculations by placing Bi orbitals into a separate energy panel. This indeed has an effect in the equilibrium tilting angle equal now and =50 meV/(1cell). Four times change in the latter value looks very unusual and again shows the importance of proper handling with the semicore. We have also tried to increase the number of –points in the integration over the BZ but this hardly has any effect to the final results.

We now discuss our studies for the breathing distortions. The dimerisations of the octahedra are performed for a set of tilting angles from 0 to 15∘ in order to search for a global total–energy minimum at the plane. The crystalline structure consists of two formula units and has now a monoclinic symmetry. Our calculations do not predict pure breathing distortions ( leaving cubic structure stable against this perturbation. However, for our total energy displays very flat highly anharmonic potential well assuming closeness to the instability. When tilting appears, the potential well starts to exhibit a double minimum indicating weak but non–zero breathing distortion. We have found that global total–energy minimum occurs when The calculated versus for this angle is shown in Fig. 7. A very shallow minimum can be seen from this figure located at The corresponding energy lowering is only equal to -7 meV/(1cell) relative to the structure which is purely tilted. These results are in contradictions with the experimental findings [20] which give Moreover such low gives us the breathing phonon frequency nearly equal to zero in contrast to the measured values [11, 48] of the order meV. This indicates that real energy lowering is much larger than we evaluate.
Furthermore, the LDA one–electron spectrum calculated at our minimum still corresponds to metallic ground state. We have found that the energy gap opens at larger values of . At the calculated minimal gap is indirect and occurs between the points and (see also Ref. [15]). Its value is approximately equal to 0.1 eV. The minimal direct gap is found at the point and is about 1 eV. These values are lower than the corresponding experimental values [26] most likely due to systematic underestimation of gaps by the LDA.. The measured transport activation gap is 0.24 eV. However, it does not show up in photoconductivity, optical absorption or photo-acoustic measurements. Sometimes this is interpreted [27] as bosonic bound state of two electrons due to negative electronic . Therefore it is unclear whether transport activation gap can be related to the minimal indirect gap of our calculation. The gap seen from the optical measurements is about 2 eV which is substantially larger than our 1 eV direct gap. We have however not performed the calculations of the optical properties, therefore an exact comparison between the theory and experiment is not currently possible.
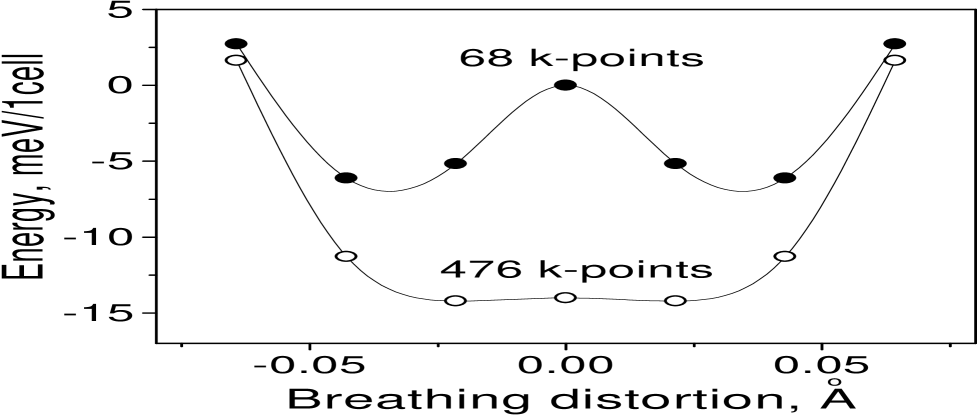
Several test calculations have been made to check our results. This mostly concerns the breathing instability, the energy bands were found to be insensitive to the computational details. First, we place Bi orbitals into a separate energy panel. This has an interesting effect that the breathing become more pronounced, the calculated value of becomes much closer to the experiment, and the energy lowering is now -17 meV/(1cell) relative to the purely tilted structure. This result, however, should be considered as artificial, since separate treatment of Bi states does not allow us to reproduce the equilibrium cell volume. We second tried to analyse the convergency with respect to the multiple LMTO basis. We have used up to 5 basis functions for representing valence wave functions but this practically does not affect the final results. Adding higher lying Ba and Bi orbitals has no effect either. This indicates that the basis set described above (see Sec. II) is sufficiently complete. We third try to investigate the relativistic effects due to heavy Bi atoms. Inclusion of spin–orbit coupling along with the scalar relativistic terms was found to have a negligible effect at the calculated equilibrium structure. Fourth, we increased the number of –points to 476 per th BZ of the monoclinic lattice. This has an effect of lowering total energy for metallic states (i.e. when and practically does not change the values of for semiconducting energy bands. As a result, total energy as a function of becomes even more shallow (see Fig. 7) and predicted breathing at the equilibrium is extremely small.
Based on our findings we conclude that the breathing distortions are seriously underestimated (ideally absent) in the LDA, the predicted ground state is metallic and, therefore, the charge–density-wave instability is not correctly described. This situation is analogous to that with HTSC cuprates where antiferromagnetic ground state was also not found within LDA [40]. (It therefore seems that LDA may, generally, have problems with both spin–density waves and charge–density waves.) We also think that due to either improper handling with Bi orbitals or approximate treatment of the full–potential terms in the LMTO method of Ref. [59], previous calculations [15, 19] did not converge to the true LDA ground state.
Following to the Hohenberg–Kohn theorem [13] we know that more proper treatment of exchange–correlation effects beyond LDA should in principle reproduce semiconducting ground state of BaBiO3 and the correct values for breathing distortions. At the same time, the energy gap will not necessarily be reproduced since it is not a ground state property of a single system. However, in such systems as BaBiO3 the energy gap is directly related to the charge disproportionation between two Bi atoms since the splitting between occupied and empty Bi levels is proportional to the occupancies of these orbitals. The latter is related to the charge density distribution which is a ground state property. It is therefore seems that until the correct theory will not reproduce the energy gap values, the correct breathing distortions will not be obtained. Speculating on this, (i) we do not see how the LDA can describe the correct ground state and, at the same time, strongly underestimate the gap value, (ii) we think the exact density functional theory would describe both the ground state and the energy gap in this system.
It worth to mention in this context an example with antiferromagnetic oxides like NiO. It is known that LDA calculations underestimate both the magnetic moment and the energy gap value in this compound. It is also clear that the magnetic moment is given by the occupancies of and orbitals of Ni, and the same factor defines the splitting between occupied and empty states which is directly related to the energy gap. A so–called LDA plus method [41] provides more proper treatment of the systems with strong electronic correlations. It has been shown [41] that this method predicts correct ground state for many Mott–Hubbard insulators and, at the same time, gives more accurate values for the energy gaps comparing to the LDA. Also, similar improvements are obtained with the use of self–interaction corrected density functional [61]. If we would interpret these results as using a better energy functional, then the situation with NiO should be completely analogous to BaBiO3 with the exception that not the spin transfer but the charge transfer defines the properties of this system.
These conclusions may bring an attention to the existence of intra atomic correlations of Bi electrons not captured by the LDA. It does not necessarily follows from our calculations that the Coulomb is negative in these systems. What only follows from our calculations is that there exists a correction term to the LDA in which the parameter responsible for the attraction of two electrons at the Bi sites is negative. To illustrate this, let us restrict ourselves for the moment by only Bi orbitals. The correction energy for the doubled unit cell Ba2Bi4+qBi4-qO6 can be represented in the form (see Appendix)
| (33) |
where is the occupancy of the Bi1=Bi4+q or Bi2=Bi4-q state and The charge disproportionation parameter When , the correction (33) to the LDA total energy is negative for any non–zero , and therefore the charge disproportionate state becomes favourable. This construction is purely heuristic and is built on the analogy to the LDA+U density functional [41]. (A better name here could be ”LDA minus U”.) In order to avoid double counting effects we interpret as , where is a part of the on–site interaction taken into account in the LDA. (In this way, when the LDA is adequate for describing the correlations, the correction term becomes automatically zero.) Therefore, from our calculations follows that the LDA overestimates Coulomb for Bi electrons, and the difference is less than zero. Adding to the LDA functional will obviously result in obtaining the charge disproportionation.
Unfortunately this simplified illustrational model has several drawbacks. First, the antibonding band crossing the Fermi level (see Fig. 1) consists not only of the Bi electrons but also has a substantial character of the O and Bi electrons. Therefore, in Eq. (33) should be interpreted as the on–site interaction between the correspondingly constructed Wanier functions. Second, since these Wanier functions are long ranged, intersite Coulomb interaction parameters must be introduced into the expression (33). (In fact, by Fourier transforming the antibonding band at we evaluate the range of Wanier states to be 4 lattice constants of the cubic phase.) Another possibility is to consider a multiband model involving charge fluctuations and Coulomb interactions between Bi , O and Bi states.
The Coulomb interaction parameters can, in principle, be calculated using constrained density functional method [62, 63]. However, the number of parameters required for our system seems to be much larger than just one number . This gives a lot of extra freedom and complicates their finding. Despite this difficulty, some progress has already been made in this direction [28]. We also plan to investigate the parameters required for the extended multiband Hubbard model using constrained LDA calculations. This question will be addressed in the future publications.
In the following, we take the simplified model (33) to illustrate which features will bring the inclusion of the correction energy to the LDA functional. Using a variational principle to minimise our LDA– expression for the total energy leads to solving the single–particle equations with the potential where is the contribution which has an orbital dependence. It is clear that the value determines the effective splitting between two non–equivalent Bi levels. If our LDA calculation gives this splitting nearly equal to zero (unless we set the breathing distortion to the experimental one), then its real value should be of the order of optical gap experimentally determined as 2 eV. (Simple connection between the charge disproportionation and the gap value is clearly seen from here, and we again state, that we do not see the way how the LDA can obtain the correct breathing and at the same time seriously underestimate )
We perform the calculations involving using our full–potential LMTO method [39]. The calculations are analogous to the constrained LDA calculations described in Ref. [63]. Using projector operator technique we define the corrections to the Bi diagonal matrix elements of the LMTO Hamiltonian. The projection is simply taken to the spherical harmonic inside the MT sphere of the Bi site and zero everywhere else. According to our model, the difference between two non–equivalent Bi occupation numbers should be associated with the charge disproportionation If we now fix to some value, the self–consistent procedure will define this charge disproportionation, and the correction to the LDA total energy can be estimated. In this way, we can find a new equilibrium structure and compare that with the experiment. Choosing such to reproduce the experimental breathing distortion can give some insight on this value.
We have performed a set of self–consistent calculations of the total energy as a function of breathing distortion for different values of . We have indeed found that for of the order minus 10 eV, the experimental breathing distortion is fairly well reproduced and the correct breathing phonon frequency is obtained. Also, the energy gap becomes much closer to the experiment. It is interesting to note that the form (33) of the functional assumes broken symmetry, i.e. the existence of the charge disproportionation regardless the presence of breathing distortions. As a consequence, the double–potential well does not exhibit a smooth behaviour at =0 and has a kink there.
The value of –10 eV required to describe the experimental structure seems to be unphysically large. This is mainly due to small self–consistent values of of the order 0.1 electrons which are obtained in our calculations. (Even smaller values are obtained for the charge transfer between two Bi MT–spheres because of the screening by the tails of O 2p orbitals). In fact, if we take a simple relationship eV, the same –10 eV is obtained. This again shows that our logic is valid. As we discussed above, a better way would be to interpret as a charge transfer between two Wanier states centred in the sites of cubic lattice with two non–equivalent Bi atoms. (We associate these Wanier states with the Bi atoms, but it is clear that they represent a mixture of a whole set of orbitals.) Indeed, our tight–binding calculations for a one–band model with long–range interactions (fitted to describe the dispersion of the band crossing the Fermi level) show that introducing a small splitting between the effective Bi levels gives the charge transfer of the order . (The chemical interpretation of the charge disproportionation 2BiBi3++Bi5+ is thus valid for the Wanier functions and is, of course, wrong for the real charge densities.) Unfortunately, implementing the Wanier representation in our LDA- functional is not straightforward and we postpone this for the future work. However, a rough estimate of operative between the Wanier states can be found by setting to 1 in the relationship eV. This will result in more realistic value of =–1 eV. Such values are expectable from the errors introduced by the LDA, for example, due to self–interaction effects.
This discussion shows that the proper treatment of the parameters of the model (33) is required. It is also clear that inclusion of the intersite Coulomb interactions is necessary to obtain a quantitative description of the ground state in BaBiO The above calculations cannot be considered as estimates of Therefore we would await of making the conclusion that negative on–site of Bi orbitals is of the electronic origin until we will not evaluate the errors introducing by the LDA. In the above discussion we were trying to argue that the insulating behaviour and breathing distortions in this system are directly related to the charge disproportionation, and the LDA must fail in describing this ground state already because it is not able to reproduce the energy gap. On the other hand, the LDA like techniques were seen to be very perspective for performing accurate calculations, and we will try to address this subject in the future work.
V. CONCLUSION.
In the present paper we have reported our density functional LDA studies of the compound Ba1-xKxBiO For its superconducting phase (=0.4) we have performed the calculations of full wave–vector–dependent lattice dynamical properties and the electron–phonon interactions. These calculations were based on recently developed linear–response approach implemented in the framework of the full–potential LMTO method. The following conclusions are made on the basis of our studies: The calculated phonon dispersion curves along major symmetry directions agree reasonably well with the results of the neutron–scattering experiments. Some discrepancies have been found to occur in reproducing the bond–stretching oxygen modes. They were attributed to the virtual crystal approximation used for the treatment of potassium doping. It was found that the bond–stretching modes have large coupling to the electrons. Especially the breathing modes at the R and M points of the cubic Brillouin zone have large coupling equal to 0.3. Relatively strong coupling is also predicted for the bond–bending oxygen modes. However, our calculated averaged value of was found to be 0.29 which is too small to account for the high–temperature superconductivity in the doped barium bismuthates. These results were supported by the calculated transport properties such, e.g., as electron–phonon limited electrical resistivity.
Our own and previous frozen–phonon calculations predicted highly anharmonic double–potential well behaviour for the tilting of oxygen octahedra corresponding to the point R. We have performed detailed studies on the influence of anharmonicity corrections to the electron–phonon coupling. By neglecting the processes of phonon–phonon interactions and utilising zero–temperature treatment of Hui and Allen [38], we have worked out the formula for anharmonic contribution to up to the second–order with respect to the displacements. It was found that anharmonic can be not small if large ionic excursions take place as in the case of the tilting vibrations. Using the full–potential LMTO method and frozen–phonon approach, we have estimated that contribution equal to 0.04. Our total is thus 0.33. We concluded that while not negligible, anharmonicity corrections due to tiling modes do not help to explain the superconductivity in the bismuthates, and therefore, its origin still remains open and intriguing problem.
As a final issue, we have done the calculations of the structural phase diagram for the undoped parent compound BaBiO A low–temperature experimental structure consists of combined breathing plus tilting distortions. In agreement with the previous conclusions, we have found that tilting distortions are reasonably well reproduced by the LDA calculation. However, we have also found that the breathing distortions are seriously underestimated (if not absent) within the LDA. This contradicts with the previous findings most likely due to improper handling with the semicore states. The underestimation of breathing leads to the predicted ground state which is metallic while it should be insulating of the charge–density–wave type. This situation closely resembles antiferromagnetism of HTSC cuprates which was also not predicted by the LDA. Using a simple correctional scheme in the spirit of the LDA method we have tried to argue that the problem of breathing is most likely due to underestimation of energy gap by the LDA. While we cannot make any definite conclusions on whether negative in the bismuthates is of the electronic origin, the failure of the LDA indicates that the electron correlations of the Bi electrons are not properly treated. Since, LDA calculations contain all electron–lattice coupling effects, we conclude that in order to recover an insulating state, an existence of the correction to the LDA with some negative of the electronic origin must be assumed. We believe that LDA like approaches will help in further understanding of the physics in these systems from density functional point of view.
ACKNOWLEDGEMENTS
The authors are indebted to O. K. Andersen, O. Gunnarsson, O. Jepsen, A. Liechtenstein, E. G. Maksimov, Y. Yacoby, and R. Zeyher, for many helpful discussions. The work was performed under the Research Contract No. I 0457-222.07/95 supported by the German–Israel Foundation for scientific research and development.
Appendix.
The form of the correction can be understood using the following arguments: Suppose the LDA total energy gives non–degenerate ground state described by the density as is the case of predicting BaBiO3 without breathing distortions. Let us expand around its minimum. Due to extremal property, this expansion starts from the second–order variations:
If the predicted ground state is wrong, then the first candidate which can take responsibility for this is the second–order derivative. The value of at is positively defined since has a minimum here. On the other hand, the true density functional at would indeed have a local maximum or, more generally, a saddle point, since the true ground state is double degenerate corresponding to either breathing–in and breathing–out distortions or vice versa. Therefore, should be negatively defined at . (We assume that the first–order variation is equal to zero at due to symmetry of the saddle point.) It is thus tempting to construct a density functional with the corrected second–order variation, i.e.
| (34) | |||
| (35) |
Assuming that kinetic energies of both and functionals are the same, the difference between the second–order derivatives is described by effective Coulomb interactions. This leads to the form (33) of the correction.
REFERENCES
- [1] L. F. Mattheiss. E. M. Gyorgy, and D. W. Johnston, Jr., Phys. Rev. B 37, 3745 (1988); R. J. Cava, B. Batlogg, J. J. Krajewski, R. Farrow, L. W. Rupp, Jr., A. E. White, K. Short, W. F. Peck, and T. Kometani, Nature 332, 814 (1988).
- [2] For a recent review, see, A. Taraphder, R. Pandit, H. R. Krishnamurthy, and T. V. Ramakrishnan, Int. J. Mod. Phys. B 10, 863 (1996).
- [3] For a recent review, see, N. M. Plakida, High–Temperature Superconductivity (Springer–Verlag, Berlin, 1995).
- [4] D. G. Hinks, D. R. Richards, B. Dabrowski, D. T. Marx, and A. W. Mitchell, Nature 335, 419 (1988).
- [5] B. Batlogg, R. J. Cava, L. W. Rupp, Jr., A. M. Mujsce, J. J. Remeika, W. F. Peck, Jr., A. S. Cooper, and G. P. Espinosa, Phys. Rev. Lett. 61, 1670 (1988).
- [6] F. Marsiglo, J. P. Carbotte, A. Puchkov, and T. Timusk, Phys. Rev. B 53, 9433 (1996).
- [7] J. E. Graebner, L. F. Schneemeyer, and J. K. Thomas, Phys. Rev. B 39, 9682 (1989).
- [8] E. S. Hellman and E. H. Hartford, Jr., Phys. Rev. B 47, 11346 (1993).
- [9] Q. Huang, J. F. Zasadzinski, N. Tralshawala, K. E. Gray, D. G. Hinks, J. L. Peng, and R. L. Greene, Nature 347, 369 (1990); N. Tralshawala, J. F. Zasadzinski, L. Coffey, W. Gai, M. Romalis, Q. Huang, R. Vaglio, and K. E. Gray, Phys. Rev. B 51, 3812 (1995).
- [10] P. Samuely, N. L. Bobrov, A. G. M. Jansen, P. Wyder, S. N. Barilo, and S. V. Shiryaev, Phys. Rev. B 48, 13904 (1993).
- [11] C. –K. Loong, P. Vashishta, R. K. Kalia, Wei Jin, M. H. Degani, D. G. Hinks, D. L. Price, J. D. Jorgensen, B. Dabrowski, A. W. Mitchell, D. R. Richards, and. Y. Zheng, Phys. Rev. B 45, 8052 (1992).
- [12] M. Shirai, N. Suzuki, and K. Motizuki, J. Phys.: Condens. Matter 1, 3553 (1990).
- [13] P. Hohenberg and W. Kohn, Phys. Rev. 136, B864 (1964); W. Kohn and L. J. Sham, Phys. Rev. 140, A1133 (1965); For review, see, also, Theory of Inhomogeneous Electron Gas, edited by S. Lundqvist and S. H. March (Plenum, New York, 1963).
- [14] N. Hamada, S. Massida, A. Freeman, and J. Redinger, Phys. Rev. B 40, 4442 (1989).
- [15] A. I. Leiechtenstein, I. I. Mazin, C. O. Rodriguez, O. Jepsen, O. K. Andersen, and M. Methfessel, Phys. Rev. B 44, 5388 (1991).
- [16] K. Kunc and R. Zeyher, Phys. Rev. B 49, 12216 (1994).
- [17] R. Zeyher and K. Kunc, Solid State Commun. 74, 805 (1990).
- [18] P. Blaha, K. Schwarz, G. Vielsack, and W. Weber, in Electronic Properties of High–Superconductors and Related Compounds, edited by H. Kuzmany, M. Mehring, and J. Fink (Springer, Berlin, 1990).
- [19] K. Kunc, R. Zeyher, A. I. Liechtenstein, M. Methfessel, and O. K. Andersen, Solid State Comm. 80, 325 (1991).
- [20] D. E. Cox and A. W. Sleight, Acta Cryst. B 35, 1 (1979).
- [21] S. Pei, J. D. Jorgensen, B. Dabrowski, D. G. Hinks, D. R. Richards, A. W. Mitchel, J. M. Newsam, S. K. Sinka, D. Vaknin, and A. J. Jacobsen, Phys. Rev. B 41, 4126 (1990).
- [22] O. Ivanov, E. G. Maksimov, and I. I. Mazin, Solid State Commun. 76, 1267 (1990).
- [23] P. W. Anderson, Phys. Rev. Lett. 34, 953 (1975).
- [24] T. M. Rice and L. Sneddon, Phys. Rev. Lett. 47, 689 (1981); E. Jurczek and T. M. Rice, Europhys. Lett. 1, 225 (1986); E. Jurczek, Phys. Rev. B 32, 4708 (1985).
- [25] C. M. Varma, Phys. Rev. Lett. 61, 2713 (1988).
- [26] For a review, see, e.g., S. Uchida, K. Kitazawa, and S. Tanaka, Phase Trans. 8, 95 (1988).
- [27] A. Taraphder, H. R. Krishnamurty, R. Pandit, and T. V. Ramakrishnan, Phys. Rev. B 52, 1368 (1995).
- [28] G. Vielsack, and W. Weber, Phys. Rev. B 54, 6614 (1996).
- [29] S. Y. Savrasov, Phys. Rev. Lett. 69, 2819 (1992); ibid., Phys. Rev. B 54, 16470 (1996).
- [30] S. Y. Savrasov, D. Y. Savrasov, and O. K. Andersen , Phys. Rev. Lett. 72, 372 (1994); ibid., Phys. Rev. B 54, 16487 (1996).
- [31] S. Y. Savrasov and O. K. Andersen , Phys. Rev. Lett. 77, 4430 (1996); O. K. Andersen, S. Y. Savrasov, O. Jepsen, and A. Liechtenstein, J. Low Temp. Phys. 105, 285 (1996).
- [32] C.O. Rodriguez, A.I. Liechtenstein, I.I. Mazin, O. Jepsen, O.K. Andersen and M. Methfessel, Phys. Rev. B 42, 2691 (1990).
- [33] R. E. Cohen, W. E. Pickett, and H. Krakauer, Phys. Rev. Lett. 64, 2575 (1990); ibid, Physica B 169, 45 (1991).
- [34] W. E. Pickett, R. E. Cohen, and H. Krakauer, Phys. Rev. Lett. 67, 228 (1991); ibid, Phys. Rev. B 47, 1002 (1993).
- [35] J. R. Hardy and J. W. Flocken, Phys.. Rev. Lett. 60, 2191 (1988), N.M. Plakida, V.L. Aksenov, and S.-L. Drechsler, ”Anharmonic Model for High- Superconductors”, Europhysics Letters 4, 1309-1314 (1987).
- [36] H.–B. Schüttler and C.–H. Pao, Phys. Rev. Lett. 75, 4504 (1995).
- [37] V. H. Crespi and M. L. Cohen, and D. Penn, Phys. Rev. B 43, 12921 (1991); ibid, 48, 398 (1993).
- [38] J. C. K. Hui and P. B. Allen, J. Phys. F: Metal Phys. 4, L42, (1974).
- [39] In the LMTO method used for our band structure calculations, the non–spherical terms of the density and the potential are represented as one–center spherical–harmonics expansions inside non–overlapping muffin–tin spheres and are expanded in plane waves in the interstitial region. The method is analogous to that developed by K. H. Weyrich, Phys. Rev. B 37, 10269 (1988) and J. Wills (unpublished). A brief description of the present implementation can be found in: S. Y. Savrasov, Phys. Rev. B 54, 16470 (1996). A relevant information can be also found under the WEB address: http://www.mpi–stuttgart.mpg.de/docs/ANDERSEN/.
- [40] For a review, see, e.g., W. E. Pickett, Rev. Mod. Phys. 61, 433 (1989).
- [41] V. I. Anisimov, J. Zaanen, and O. K. Andersen, Phys. Rev. B 44, 943 (1991); See also V. I. Anisimov, F. Aryasetiawan, and A. I. Liechtensteien, J. Phys.: Condens. Matter 9, 767 (1997).
- [42] L. F. Mattheiss and D. R. Hamann, Phys. Rev. Lett. 60, 2681 (1988).
- [43] U. von Barth and L. Hedin, J. Phyts. C 5, 1629 (1972); V. L. Moruzzi, J. F. Janak, and A. R. Williams, Calculated Electronic Properties of Metals (Pergamon, New York, 1978).
- [44] P. Blöchl, O. Jepsen, and O. K. Andersen, Phys. Rev. B 49, 16223 (1994).
- [45] L. F. Mattheiss and D. R. Hamann, Phys. Rev. B 28, 4227 (1983).
- [46] M. J. Rice and Y. R. Wang, Physica C 157, 192 (1989).
- [47] S. M. Heald, D. DiMarizo, M. Croft, M. S. Hegde, S. Li, and M. Greenblatt, Phys. Rev. B 40, 8828 (1989); O. Durmeyer, E. Beaurepaire, J. P. Kappler, C. Hornick, and M. Drillon, J. Less Common Met. 164&165, 934 (1990); S. Salem–Sugui, Jr., E. E. Alp, S. M. Mini, M. Ramanathan, J. C. Campuzano, G. Jennings, M. Faiz, S. Pei, B. Dabrowski, Y. Zheng, D. R. Richards, and D. G. Hinks, Phys. Rev. B 43, 5511 (1991).
- [48] M. Braden, W. Reichardt, A. S. Ivanov, and A. Y. Rumiantsev, Europhys. Lett. 34, 531 (1996).
- [49] M. Braden, W. Reichardt, W. Schmidbauer, A. S. Ivanov, and A. Y. Rumiantsev, J. Supercond. 8, 595 (1995).
- [50] Y. Jacoby, S. M. Heald, and E. A. Stern, Solid State Commun. 101, 801 (1997).
- [51] This definition is different from that we have used in Ref. [30] (no factor of 2 appeared in the denominator of the matrix element). However it is now more easy to make a comparison with the matrix element over the phonon states (26) discussed in Sec. III.
- [52] W. L. McMillan, Phys. Rev. 167, 331 (1968); P. B. Allen and R. C. Dynes, Phys. Rev. B 12, 905 (1975).
- [53] P. B. Allen, Phys. Rev. B 17, 3725 (1978);
- [54] A. E. Karakozov and E. G. Maksimov, Zh. Eksp. Teor. Fiz. 74, 681 (1978) [Engl. transl.: Sov. Phys. JETP 47, 358 (1978)].
- [55] For the tilting at =(1,1,1), =0 unless points to the oxygen atom. There are three O atoms centered at , , and in the cubic perovskite lattice. For the rotations along (1,1,0) axe, the vectors are equal to times where is expressed via the tilting angle as follows: for small . The normalized polarization vectors are: .
- [56] O. K. Andersen, A. I. Liechtenstein, O. Rodriguez, I. I. Mazin, O. Jepsen, V. P. Antropov, O. Gunnarsson, and S. Gopalan, Physica C 185–189, 147 (1991).
- [57] It should be noted that Eq. 30 does not work when (a case of two separated potential wells) since the starting expression (4) is only valid when energy levels are not degenerate and well separated from each other. The corresponding criterium of applicability of (4) is that the distance between levels should be much larger than applied perturbation described by electron–phonon interactions. In the case close to degeneracy, another formula should be used which is based on the perturbation theory allowing degenerate states.
- [58] It is not generally true that is equal to the second–order change in the eigenvalue because, following to standard perturbation theory, there also is a contribution of the same second order. However, for the tilting mode, all contributions to connected with vanish.
- [59] M. Methfessel, Phys. Rev B 38, 1537 (1988).
- [60] I. I. Mazin, A. I. Liechtenstein, and O. V. Ivanov, Ferroelectrics 164, 169 (1995).
- [61] A. Svane and O. Gunnarsson, Phys. Rev. Lett. 65, 1148 (1990).
- [62] O. Gunnarsson, O. K. Andersen, O. Jepsen, and J. Zaanen, Phys. Rev. B 39, 1708 (1989).
- [63] M. S. Hybertsen, M. Schlüter, and N. E. Christensen, Phys. Rev. B 39, 9028 (1989).