[
Study of spin-Peierls transition in -NaV2O5 by infrared reflectivity
Abstract
Polarized infrared reflectivity measurements have been performed on single crystals of the spin-Peierls compound -NaV2O5 in the temperature range 20–300 K. Pronounced spectral features associated with the formation of the dimerized phase were detected both in the - and -polarizations (perpendicular and parallel to the spin-1/2 chains, respectively). The temperature dependence of a salient spectral line at 718 cm-1 sharply rising below the transition temperature obeys a law with T K and . In addition, a continuum signal is observed in the whole temperature range in the -polarized optical conductivity spectra. In order to interpret these results, calculations of the static dimerization and of the optical conductivity based on a mean-field and a dynamical treatment of the lattice respectively are proposed.
pacs:
78.30.Hv, 75.50.Ee, 63.20.-e, 64.70.Kb]
The spin-Peierls (SP) transition has become a revived challenging effect in quasi-one dimensional magnetism since the recent discovery of two inorganic transition metal oxides compounds, first copper germanate CuGeO3 (Ref.[2]) and more recently sodium vanadate NaV2O5 (Ref.[3]). These compounds contain linear spin- chains coupled to three-dimensional phonons. At low temperatures this coupling leads to the SP phase transition characterized by a lattice dimerization together with the opening of a spin gap.
The revival of the subject already investigated before in numbers of organic salts[4] is due to the availability of large size and high quality crystals offering the possibility to carry out a number of relevant experiments [5] including x-rays and neutron scattering [6, 7, 8].
Optical spectroscopy is known to be a sensitive tool to investigate properties of magnetic compounds[9] and provides a detailed knowledge of phonons, magnons and their fluctuation states. IR transmission and reflectance experiments have been used to study the undistorted and SP phases in CuGeO3 (Ref.[10, 11, 12]). The SP phase of NaV2O5 has been recently studied by IR absorption in the frequency region 50–400 cm-1. New phonon lines have been found to accompany the SP transition[13, 14]. Recently, the activation of a zone boundary phonon in the SP phase of CuGeO3 has been observed as a new single tiny line in low temperature reflectivity spectra [12]. A distinctive feature of NaV2O5 in comparison with CuGeO3 is the negligible magnetic interaction between the chains because of their isolation by V5+O5 non magnetic chains. Frustration ratios (Ref.[15, 16]) have been suggested for CuGeO3 and for NaV2O5 (Ref.[3]). In addition, the nearest-neighbor intrachain exchange constant J440 K, the transition temperature TSP= 35 K and the spin gap = 79 cm-1 in NaV2O5 are typically 3-4 times larger than in CuGeO3 (Ref.[14]). Also the dimerization , estimated in the adiabatic approximation from the spin gap, has the value (Ref.[15]) and (Ref.[17]) for CuGeO3 and NaV2O5, respectively. Thus, the magneto-elastic coupling plays a larger role in NaV2O5 and enhanced spectral signatures of this coupling are expected in this system.
In the following, we report on infrared reflectivity measurements of NaV2O5 single crystals over frequencies between 100 and 10000 cm-1 and for temperatures between 20 and 300 K. The study focuses first on the room temperature display of the excitation spectrum for the incident polarization along the - and -axes (perpendicular and parallel to the spin-1/2 chains, respectively). Then, prominent new lines giving salient evidence of the dimerized phase below 34 K are reported. A detailed study of the temperature dependence of the line at 718 cm-1 is presented. Finally, the outline of a calculation using Exact Diagonalization (ED) and Quantum Monte-Carlo (QMC) algorithms based on a mean-field or a dynamical treatment of the lattice is given.
High-quality single crystals NaV2O5 with size up to 2.75.10.3 mm3 were prepared according to the procedure described in Ref.[18]. The optical measurements were done with a Bruker IFS 113V spectrometer at nearly normal incidence of infrared radiation polarized along the - and -axes and . Room temperature transmission and reflection infrared spectra were measured in a spectral range between 90 and 10000 cm-1 with a resolution ranging from 1 cm-1 in the far-infrared region to 5 cm-1 in the near-infrared region. The low temperature far-infrared spectra were measured with a continuous He flow cryostat down to 20 K with the absolute accuracy of temperature control about 0.1 K. The spectral range was 90–700 cm-1 for -polarization and 90–1000 cm-1 for -polarization with the resolution 1 cm-1.
We can distinguish three different regions in the measured infrared spectra of NaV2O5 at 300 K. A rich phonon structure at frequencies below 1000 cm-1 is followed by transmission windows at 1500–5150 cm-1 for -polarization and at 1120–5320 cm-1 for -polarization. At higher frequencies, a wide maximum centered at approximately 7100 cm-1 was observed in the -polarized reflectivity spectra. We have here restricted the discussion to the phonon part of the spectra.
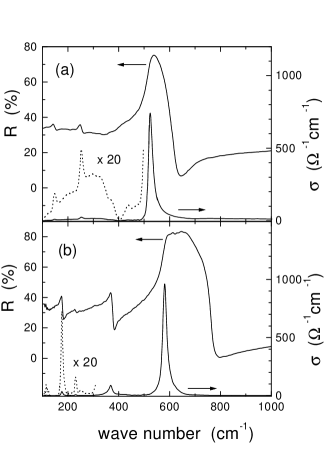
In Fig. 1 the room temperature - and -axes reflectivity spectra (R) and the frequency-dependent conductivity () derived via Kramers-Kronig analysis are shown in the region of lattice vibration frequencies up to 1000 cm-1. Three phonons are detected for the -polarization ( 524, 251, 145 cm-1) and four for the -polarization ( 581, 367, 229, 175 cm-1). -axis polarized reflectivity spectra have a typical form of phonon bands in an insulator which manifests in dynamical conductivity as Lorentzian peaks. Obvious features in the -polarized spectrum are the occurrence of a broad excitation band ending at 400 cm-1 and an asymmetric line at 524 cm-1 with an underlying continuum extended above 1000 cm-1 (Fig. 1a). However, since the line shape depends strongly on the high- approximation of the data ( cm-1), reflectivity measurements in the visible and ultraviolet regions are necessary for a definite analysis.
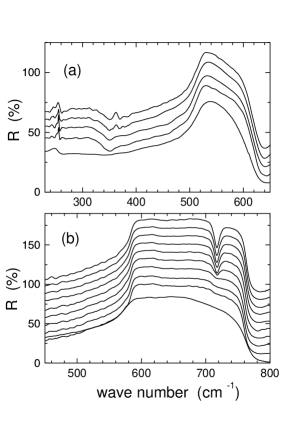
Below , a pronounced modification of the reflectivity spectra is observed with sharply rising new features at 363, 200 cm-1 (), 718 cm-1 () and 138 cm-1 (the polarization is unknown because of a poor signal-to-noise ratio in the very far-infrared region). The -axis polarized broad band at cm-1 is enhanced at low temperatures, but neither the position nor the intensity changes at (Fig. 2).
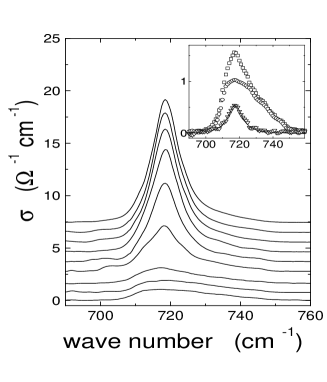
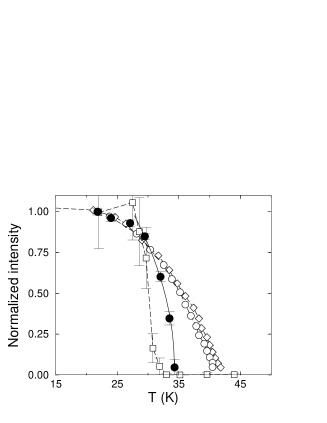
We performed a careful investigation of the 718 cm-1 line in the conductivity over temperatures between 20 and 38 K since this line is clearly associated to the lattice transformation at (Fig. 3). At low temperatures (T=21.8, 24, 27 K) this peak is well described as a single Lorentz line with a constant linewidth. On the other hand, above 29 K the line profile is well described as superposition of a temperature-dependent Lorentz peak on top of a temperature-independent asymmetric broad line which can be clearly seen at 35.3 K and 38 K. This broad line might well be the signature of structural fluctuations growing in the vicinity of . Indeed, after subtraction of the temperature-independent part, a perfect Lorentz line with constant linewidth (8.20.5) cm-1 is obtained for all T below the transition. We believe that the Lorentz-type line corresponds to a folded zone boundary phonon mode activated by the structural distortion and, therefore, the intensity of this line should be proportional to the squared dimerization. The temperature dependence of the normalized line intensity is shown in Fig. 4 as well as the result of a fit with the law. This fit in the temperature range 30–35 K gives =(34.30.2) K, =0.250.1. One should note that the relatively small error on achieved with only few points near the is due to the correction procedure described above together with the low dispersion of experimental data as evident in Fig. 3 (insert).
We proceed now to discuss the above results in the context of existing theoretical approaches. The crudest description of the spin-Peierls ground state (GS) is based on the dimerized Heisenberg model: the antiferromagnetic coupling between nearest neighbor spins is assumed to be statically modulated (see Eq. (2) below) along each spin-1/2 chain. In fact, the physical origin of such a modulation relies on the dynamical magneto-elastic coupling. One of the simplest model including dynamical effects of phonons read [19, 20, 21] (omitting the chain index),
| (1) |
where is the magneto-elastic coupling constant and correspond to atomic displacements which modulate the exchange integral . Here, we restrict ourselves to a single polarization of the phonon modes. Assuming independent optical phonons, the phonon hamiltonian takes the usual form, . An interchain elastic coupling is required to account for the three-dimensional coherence of the phonons and involves an additional elastic coupling between neighboring chains. is needed to obtain a finite value of . Note that and depend strongly on the actual direction in space of the displacements which is not explicitely specified in (1) (Ref. [22]).
The optical conductivity is theoretically defined as the GS correlation where the operator describes the coupling between the () photons and the medium. Quite generally, one expects , where is the electric field of the light, is the polarization of the phonon mode and is the IR tensor which might include local spin fluctuations [23].
In lowest order, corresponds to the emission of a phonon i.e. . According to Ref.[13], at there are 15 and 7 phonons which should be active in the first order IR processes. We did not observe all the predicted modes probably because some of them have small oscillator strengths. The group theoretical analysis in the SP phase is not available yet.
Calculated optical conductivity spectra () obtained by ED of a N=12 site ring are shown in Fig. 5 for a typical phonon frequency and several values of the dimensionless coupling constant ( is neglected here and a variational basis is used for the phonons [21]). As shown in the insert, the spin gap (and hence the dimerization) increases strongly with the coupling . The doubling of the unit cell leads to an additional peak in corresponding to a new phonon mode at higher energy resulting from a folding of the Brillouin zone. This mechanism can then explain the experimental observation of the new line at 718 cm-1 if one assumes that the atomic displacements have a component along the chains direction (-axis).

As suggested theoretically [23] and observed experimentally [24], higher order processes involving one phonon and two-magnon scattering can also take place with, e.g., an IR tensor like , where is the unit vector along the chain direction. In this case, the maximum absorption would occur for polarized along . A continuous background is indeed observed for such a geometry (see Fig. 1(a)) and could be associated to a two magnon phonon assisted absorption. More detailed theoretical and experimental investigations of this effect are left for a future study.
Although the treatment of the phonon dynamics at finite T is beyond the scope of this work, a simpler mean field treatment of the lattice is justified if the relevant phonons have a pronounced 3D character (i.e. is not too small compared to ) and if . In the adiabatic approximation (which corresponds, strictly speaking, to the limit ) the hamiltonian reads [15],
| (2) |
where is the number of sites, K an effective elastic constant and the static dimerization which depends on the system size. The value of is obtained by minimizing the total free energy , where corresponds to the spin part of hamiltonian (2). The zero temperature value is imposed by the actual value of the ratio known from experiments [14]. The value of , in turn, enforces the value of the ratio . Note that and are the only two free parameters of the model ( K is determined from a fit of the high-T spin susceptibility[14]) and, hence, the theoretical value for comes as an output of the model. The QMC calculation suggests K, a value very close to the experimental one. The explicit temperature dependence obtained by ED and QMC techniques[25] agrees reasonably with the experimental data, as shown in Fig. 4, apart from the value of the critical exponent [26].
In summary, we have studied the infrared reflectivity on NaV2O5 single crystals at temperatures down to 20K. The SP transition order parameter was measured through the phonon spectrum temperature dependence. These results are compared with calculations based on mean field or dynamical treatments of the lattice.
We acknowledge A. Damascelli and D. van der Marel for communicating their results of a similar study prior to publication.
REFERENCES
- [1] Permanent address: A. F. Ioffe Physical Technical Institute, 194021 St. Petersburg, Russia
- [2] M. Hase et al., Phys. Rev. Lett. 70, 3651 (1993).
- [3] M. Isobe and Y. Ueda, J. Phys. Soc. Jpn. 65, 1178 (1996).
- [4] For a review on organic SP systems see e.g. J. W. Bray, L. V. Interrante, I. S. Jacobs and J. C. Bonner, in Extended Linear Chain Compounds, edited by J. S. Miller (Plenum Press, New York, 1983), Vol. 3.
- [5] For a review on CuGeO3 see e.g. J. P. Boucher and L. P. Regnault, J. Phys. I (Paris) 6, 1939 (1996).
- [6] J. P. Pouget et al., Phys. Rev. Lett. 72, 4037 (1994).
- [7] L. P. Regnault et al., Phys. Rev. B 53, 5579 (1996).
- [8] Y. Fujii et al., J. Phys. Soc. Jpn. 66, 326 (1997).
- [9] M. Cottam and D. Lockwood, Light Scattering in Magnetic Solids (John Wiley & Sons, New York, 1986)
- [10] P. H. M. Van Loosdrecht, cond-mat/9711091 (unpublished).
- [11] G. Li et al., Phys. Rev. B 54, R15 633 (1996).
- [12] A. Damascelli et al., Phys. Rev. B 56, R11 373(1997).
- [13] M. N. Popova et al., Pis’ma v ZhETF 65, 711 (1997).
- [14] M. Weiden et al., Z. Phys. B 103, 1 (1997).
- [15] J. Riera and A. Dobry, Phys. Rev. B 51, 16 098 (1995); A. Feiguin et al., Phys. Rev. B 56, 14 607 (1997).
- [16] G. Castilla et al., Phys. Rev. Lett. 75, 1823 (1995).
- [17] D. Augier, D. Poilblanc, S. Haas, A. Delia and E. Dagotto, Phys. Rev. B 56, R5732 (1997).
- [18] M. Isobe et al., submitted to J. Cryst. Growth (1998).
- [19] D. Khomskii, W. Geerstma and M. Mostovoy, Czech. J. of Phys. 46, Suppl S6, 32 (1996).
- [20] I. Affleck, proceedings of the NATO ASI “Dynamical Properties of Unconventional Magnetic Systems”, April 97, preprint cond-mat/9705127, to be published.
- [21] D. Augier, D. Poilblanc, E. Sørensen and I. Affleck, submitted to Phys. Rev. Lett. For results using a truncation procedure in momentum space see also D. Augier and D. Poilblanc, Eur. Phys. J. B 1, 19 (1998).
- [22] The dimerization can be defined within this model by .
- [23] T. Moriya, J. Appl. Phys. 39, 1042 (1968), J. Lorenzana and G. A. Sawatzky, Phys. Rev. B 52, 9576 (1995) and J. Lorenzana and R. Eder, Phys. Rev. B 55, R3358 (1997).
- [24] H. Suzuura, H. Yasuhara, A. Furusaki, N. Nagaosa and Y. Tokura, Phys. Rev. Lett. 76, 2579 (1996).
- [25] ED deals with smaller rings than QMC and, hence, has larger finite size effects and therefore overestimate .
- [26] Deviations from the mean-field behavior () have also been seen in CuGeO3; see e.g. Ref. [7], [12] and M.C. Martin et al., Phys. Rev. B 53, 14713 (1996).