Structural Transitions and Global Minima of Sodium Chloride Clusters
Abstract
In recent experiments on sodium chloride clusters structural transitions between nanocrystals with different cuboidal shapes were detected. Here we determine reaction pathways between the low energy isomers of one of these clusters, (NaCl)35Cl-. The key process in these structural transitions is a highly cooperative rearrangement in which two parts of the nanocrystal slip past one another on a plane in a 11̄0 direction. In this way the nanocrystals can plastically deform, in contrast to the brittle behaviour of bulk sodium chloride crystals at the same temperatures; the nanocrystals have mechanical properties which are a unique feature of their finite size. We also report and compare the global potential energy minima for using two empirical potentials, and comment on the effect of polarization.
pacs:
61.46.+w,36.40.Sx,82.30.QtI Introduction
There has been much interest in phase-like transitions in clusters. Most of this research has been directed at the finite analogue of the solid-liquid transition [1], whereas the possibility of transitions between different solid forms has received less attention [2, 3, 4]. Some examples are known: when supported metal clusters are observed by electron microscopy, their structure can change between icosahedral, decahedral and close-packed [5, 6]. However, the role of the electron beam and the surface is uncertain. Similar transitions have also been suggested for free atomic clusters of certain sizes, which are driven by entropy differences between the icosahedral, decahedral and close-packed morphologies [7, 8, 9]. However, it is not clear how these changes could be detected even if the large free energy barriers involved [10] are surmountable.
Coexistence between solid-like isomers of small binary salt clusters has previously been described by Rose and Berry [2]. More recently, clear examples of structural transitions have emerged from experiments on NaCl clusters. These clusters have only one energetically favourable morphology: the magic numbers that appear in mass spectra correspond to cuboidal fragments of the bulk crystal (rocksalt) lattice [11, 12, 13], hence the term nanocrystals. Indirect structural information comes from the experiments of Jarrold and coworkers which probe the mobility of size-selected cluster ions. For most (NaCl)NCl- with , multiple isomers were detected which were assigned as nanocrystals with different cuboidal shapes [14]. The populations in the different isomers were not initially equilibrated, but slowly evolved, allowing rates and activation energies for the structural transitions between the nanocrystals to be obtained [15]. Based on the small values of the activation energies, Hudgins et al. suggested that the rearrangement mechanisms might involve a sequence of surface diffusion steps.
The aim of the present work is to examine this hypothesis by identifying the mechanisms for one of the clusters that was studied experimentally, (NaCl)35Cl-. We also report the global potential energy minima of (NaCl)NCl- for two different empirical potentials which enables us to comment on the effects of including polarizabilities and hence induction energies. Methods are outlined in section II and the global minima are discussed in III. Then in section IV we describe the mechanism that we found to mediate the structural transitions in (NaCl)35Cl-. Finally, in section V we discuss the implications of this mechanism for the mechanical properties of NaCl nanocrystals and its relevance to other alkali halides.
II Methods
A Searching the PES
The identification of mechanisms for the structural transitions of presents a considerable challenge to the theoretician since the half-lives of the least stable isomers are of the order of milliseconds [15], whereas the time scales that can be probed by conventional molecular dynamics simulation are only on the order of nanoseconds. The difficulty is that in molecular dynamics or Monte Carlo simulations the system spends most of the time vibrating about a minimum on the PES with transitions between minima occurring only rarely. One approach to enhancing the rate of occurrence of rare events, such as these structural transitions, is to bias the system towards the transition regions using umbrella sampling [16]; this method is particularly suited to calculating free energy barriers. Here we use an approach which is ideal for finding reaction pathways for complex processes. Previously it has been used to find a pathway between the face-centred cubic global minimum and the lowest energy icosahedral minimum of a 38-atom Lennard-Jones cluster [17], and to identify relaxation mechanisms in amorphous silicon [18]. Steps are taken directly between minima [17, 19, 20], thus allowing large distances on the PES to be traversed. To do this, we first find a transition state connected to the current minimum using the eigenvector-following technique [21, 22, 23, 24, 25, 26]. We then calculate the corresponding rearrangement mechanism and thereby obtain the new minimum. Finally, we decide whether to accept the step to the new minimum, typically on the basis of a Metropolis criterion [27]. By repeating this process the system performs a walk amongst connected minima on the PES.
The steps between adjacent minima are not biased to go in any particular direction. Nevertheless, by performing an extensive search of the low-lying minima we were able to find paths between the various rocksalt-type isomers of . In the process over 4500 minima and 5500 transition states were characterized. Although there is no guarantee that we have found the shortest or lowest barrier rearrangements between the nanocrystals, we are confident that our paths are good estimates and representative of the optimal paths.
B Potentials and geometry optimization
Two popular empirical potentials for NaCl were considered in the present work. The first is the Tosi-Fumi parameterization of the Coulomb plus Born-Meyer (C+BM) potential [28]:
where is the charge on ion , is the distance between ions and and and and parameters [28]. We have also considered the more complex potential fitted by Welch et al. [29] for which the full vector form has previously been given by Phillips et al. [30]:
where
and . (There is a small typographical error in equation (3) of reference [30].) The above formulae are given in atomic units. Adopting the notation of Stone [31], component of the induced dipole vector at site due to site , , is:
where A and B are the position vectors of the respective sites. The total induced moment in the present case is:
where
Two approaches are available for finding the dipole moments, namely iterating the equations for to self-consistency or rearranging the equation as
where . In the present work matrix inversion was used to obtain the self-consistent dipole moments and the first analytic derivatives of the energy.
The inclusion of polarizabilities in the Welch potential makes this functional form much more expensive to evaluate than the simple C+BM form. Hence we conducted the most extensive searches of the PES with the latter potential and then reoptimized stationary points and pathways with the Welch form. Global minima were located using a guiding function approach for the Welch potential, as discussed in the next section. Transition states were located using a modified eigenvector-following approach. The basic algorithm has been described before [66, 33], and was used in the present work with numerical second derivatives for the Welch potential. We also employed a new approach which does not require second derivatives and is more efficient [34].
III Global Optimization
Global potential energy minima were located for up to for both of the empirical potentials described above. We employed the ‘basin-hopping’ or Monte Carlo minimization[35] technique which has recently been investigated for a variety of atomic and molecular clusters[8, 36, 37, 38, 39, 40, 41].
Canonical Monte Carlo (MC) sampling was used to explore the transformed PES, as described elsewhere [8, 36]. For the C+BM potential five runs of 5000 MC steps were performed for every cluster size with each run starting from a random point. Two short runs of 200 steps each were also initiated using the lowest minima for and as seeds. The maximum step size for the displacement of any Cartesian coordinate was dynamically adjusted to give an acceptance ratio of 0.5 for a temperature corresponding to 316 K (474 K for the larger clusters). Final values for the maximum displacement were typically around 1.5 Å. To restrict the configuration space to bound clusters we reset the coordinates to those of the current minimum in the Markov chain at each step [42].
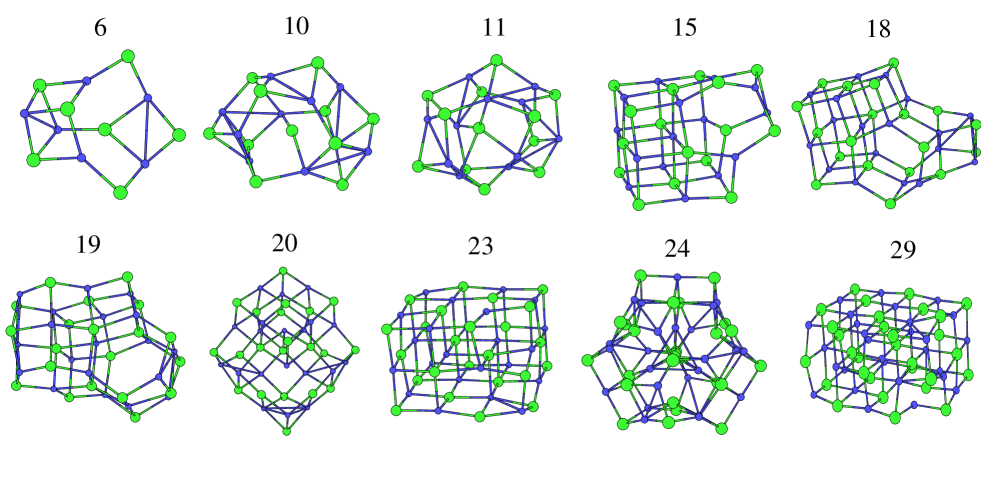
Since the Coulomb potential is long-ranged these clusters actually represent a rather easy global optimization problem because there are fewer minima on their potential energy surfaces [7, 37, 43]. Hence we are confident that most of the lowest energy structures we have identified for the simpler potential are the true global minima. In fact, the lowest minimum was usually the same for each of the five runs at every size considered. The Welch potential is much more time consuming to evaluate, and in this case only three runs of 4000 steps each were performed. We also employed a guiding function technique, as suggested by Hartke [44], where the simpler C+BM was used for partial geometry optimization followed by relaxation with the full Welch potential in every quench. Once again the same lowest energy structures were usually found in each of the three runs for every size. The results also agree with calculations performed without a guiding function up to , and with those of Phillips et al. [30] up to , although our energies are systematically lower than theirs, presumably due to different unit conversion factors. Our energies and geometries are all well converged with the root-mean-square force reduced to less than hartree/bohr for every minimum. The most difficult case in this size range appears to be where the rocksalt global minimum was only found in two out of three runs for the Welch potential.
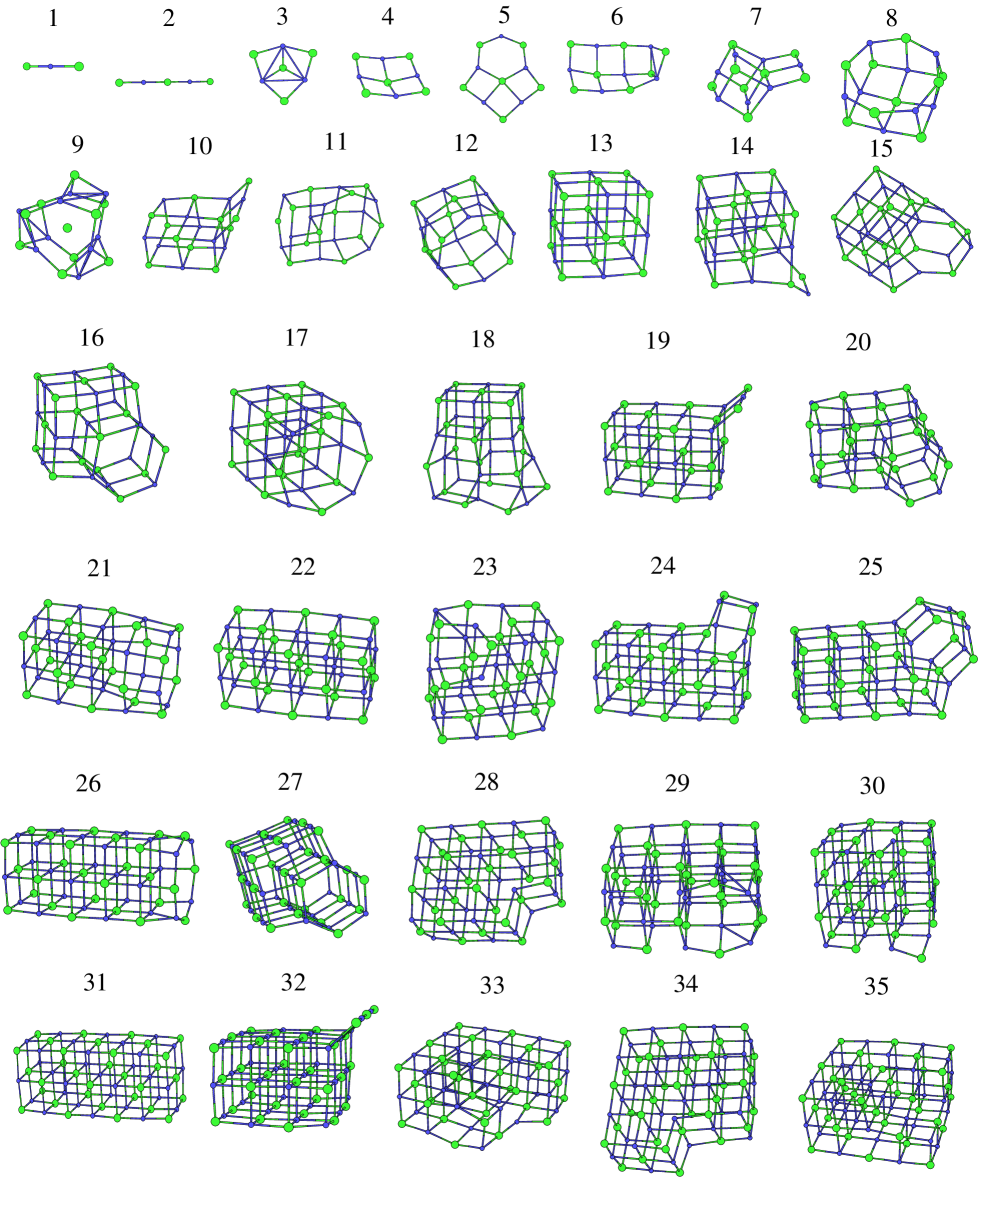
All the results will be provided in a downloadable format from the Cambridge Cluster Database [45]. The energies of the lowest minima found for both the C+BM and Welch potentials are given in Table I and the structures are illustrated in Figures 1 and 2. The lowest ten or so local minima found for the B+CM potential were also relaxed separately under the Welch potential to establish the correspondence between local minima.
For most sizes in the present range the structure of the global potential minimum is the same for the two potentials. However, the global minimum of one potential is only a local minimum for the other potential at and 29. For the global minimum is linear for C+BM but somewhat bent for Welch. For the Welch global minimum has lower symmetry than the C+BM structure; the apparent symmetry is actually slightly broken on close inspection. The similarity of the results for the two potentials shows that the C+BM form, despite its simplicity, can give a reasonably reliable guide to the structure of these clusters and provides justification for our use of the C+BM potential to perform surveys of the energy landscape.
As expected, the lowest energy structures have predominantly rock-salt structures, and the particularly stable sizes occur when complete cuboids can be formed (Figure 3). These sizes () agree with the magic numbers observed in the mass spectral abundance distributions[13]. It is interesting to note that at a number of sizes when complete cuboids cannot be formed a column of hexagonal rings appears (e.g. ). One of the more unusual structures is the (NaCl)24Cl- global minimum for the Welch potential. It has threefold symmetry with a trigonal bipyramid in the middle containing three (equatorial) Na+ ions and two (axial) Cl- ions.

IV Rearrangements of
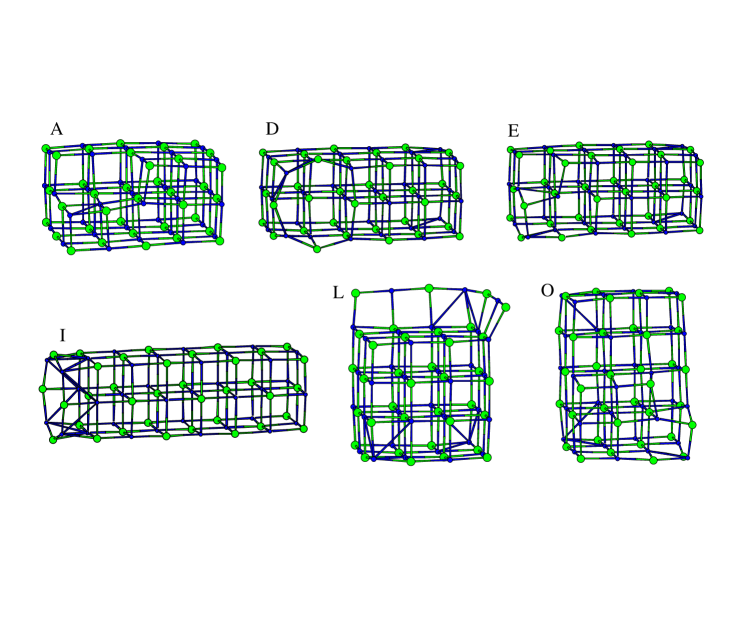
In the experiments on (NaCl)35Cl- three peaks were resolved in the arrival time distribution. These peaks were assigned on the basis of calculated mobilities as an incomplete cuboid, an incomplete cuboid, and an cuboid with a single vacancy [14, 15]. However, the lowest energy minima that we found for this cluster could be divided into four types (Table II and Figure 4), namely the above three nanocrystals and a cuboid with a single vacancy. As the latter structure was not considered when the structural assignments were made, its mobility has now been calculated using the exact hard-spheres scattering model [46, 47].
With these new data better agreement between the calculated and observed mobilities can be obtained by assigning the three experimental peaks to the , and nanocrystals in order of increasing drift time [47]. Furthermore, this reassignment gives better agreement with the energetics. In the experiment the clusters convert to (what we now assign as) the nanocrystal as time progresses, indicating that this structure has the lowest free energy. In our calculations the global potential energy minimum is also a isomer. Moreover, the nanocrystal is second lowest in energy; it is 0.06 eV (0.10 eV for the Welch potential) above the global minimum, whereas the corresponding value for the lowest energy isomer is eV (eV).
The disconnectivity graph (or tree) [48, 49] in Figure 5 provides a graphical representation of the PES. It shows which minima are connected by pathways below any given total energy. The end of each line represents a minimum on the PES and each node occurs at the energy of the transition state which first connects the two (sets of) minima. The tree separates the minima according to the particular rocksalt cuboid quite cleanly. This result shows that the barriers between minima with the same basic cuboidal shape are generally smaller than those between the different types of nanocrystal. This separation holds least well for the nanocrystals because of the many different ways that the nine vacant sites can be arranged. For example, the two lowest energy minima, L and O, have very different structures (Figure 4) and the energy at which the set of minima associated with O becomes connected to the minima is lower than the energy at which it becomes connected to the set of minima associated with L. Minimum O is also much closer in configuration space to the lowest energy minimum than it is to minimum L (Table III). Another example is provided by the two isomers on the left of the figure which are separated by a very large barrier from the rest of the structures because the ions occupy the opposite lattice sites to the other minima (i.e. the sodium ions, not the chloride ions, are located at the corners of the nanocrystal).
One helpful way to characterize the topography of an energy landscape that has come from the protein folding community is in terms of funnels [50, 51]. A funnel is a set of pathways that converge to a low energy minimum. It has been suggested that a single deep funnel underlies the ability of proteins to fold to a unique native structure. Figure 5 shows that on the (NaCl)35Cl- PES there are separate funnels corresponding to the , and nanocrystals and a number of small funnels associated with the nanocrystal.


This characterization of the PES helps to explain the initial presence of the metastable isomers in the experiments by Jarrold and coworkers.[14, 15] The energy landscape efficiently ‘funnels’ high energy structures into rocksalt-type minima [52, 53]. However, the barriers between the different funnels are large, leading to a separation of time scales for relaxation down the PES to a rocksalt structure and conversion of the metastable nanocrystals to the global minimum. In Ref. [54] we predicted that this behaviour would occur for alkali halide clusters.
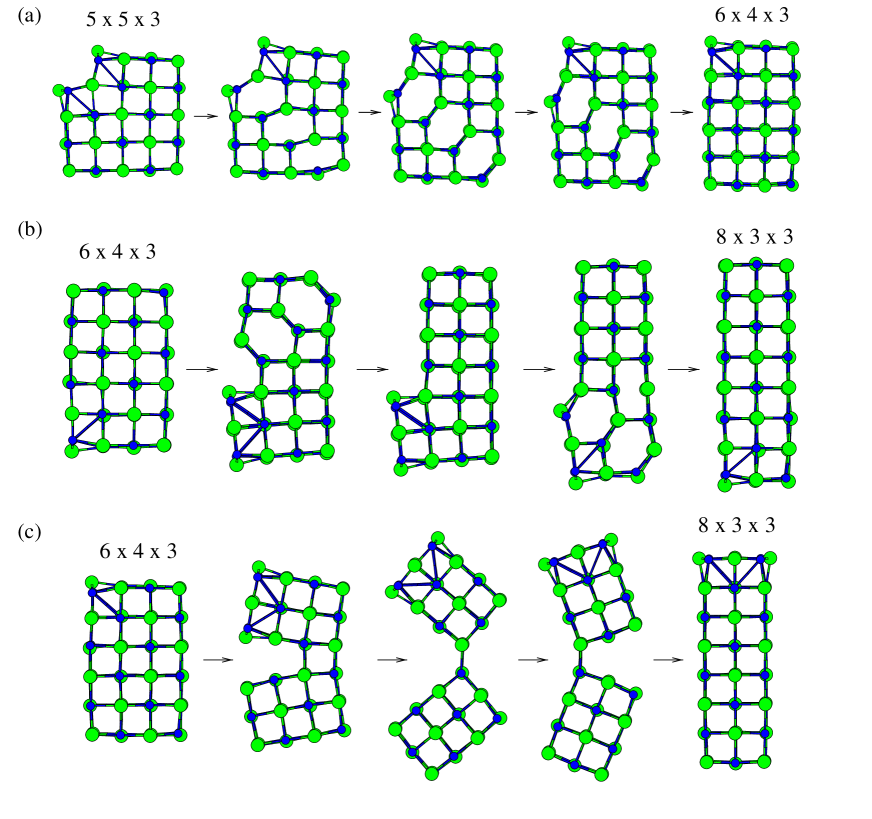
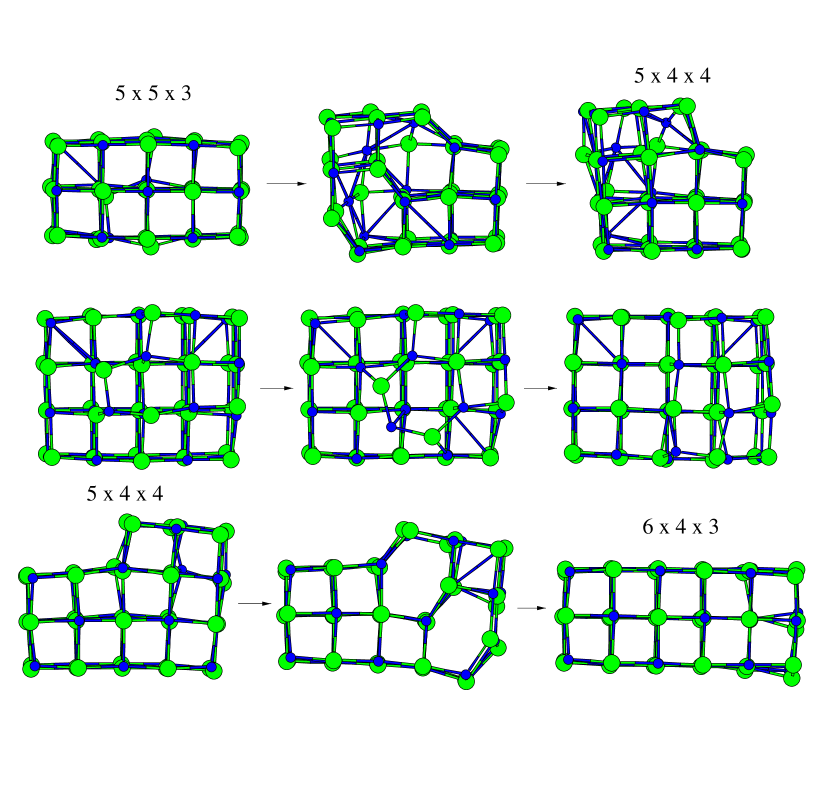
To understand the mechanisms for the structural transitions we have visualized many pathways connecting nanocrystals with different dimensions. In virtually all the pathways the major shape changes are achieved by the same type of mechanism. A typical example of this process occurs in the shortest path between the lowest energy and isomers. The path involves four sequential transition states (Fig. 6a), the first three of which mediate local rearrangements of the empty sites in the cuboid. The fourth rearrangement causes the major shape change and is depicted in Fig. 7a. In this ‘glide’ mechanism the two halves of the cluster slide past one another on a plane in a 11̄0 direction. Other examples of this mechanism are illustrated in Figures 7b and 8.
Although the path shown in Figure 6a and 7a is the shortest between the lowest energy and minima it is not the lowest in energy. The latter pathway (Figure 6b and 8) is more complicated; rather than passing directly between the two nanocrystals it goes via a number of minima, some of which are structurally similar to minimum O. Again the glide mechanism mediates the main structural changes between a and a nanocrystal (top of Figure 8) and from a to a nanocrystal (bottom of Figure 8). The former mechanism is not quite so clear-cut since the glide is coupled with local defect motion on the far side of the crystal. The middle rearrangement in Figure 8 actually involves the highest energy transition state on the pathway. In this rearrangement a triangle of ions slides over the surface of the nanocrystal. The final rearrangement in the pathway (not depicted in Figure 8) is the conversion of minimum E to D by the motion of a single sodium ion.
The lowest energy pathways to the nanocrystal all occur via the same transition state The pathway from the nanocrystal is illustrated in Figures 6c and 7b. Two glide rearrangements convert the lowest energy isomer into an isomer. In the final rearrangement on this pathway a single sodium ion moves so that the vacancy in the nanocrystal occupies the site of lowest energy.
It is not hard to see why the glide mechanism is favourable. On either side of the plane are rows of oppositely-charged ions (these can be clearly seen on the top face of the nanocrystals in Fig. 7a and b). When the nanocrystal slides on this plane in the direction of these rows, no ion comes any closer to the nearest ion of the same charge. This situation only holds for planes and the direction. The activation barrier arises from the loss of some favourable contacts between oppositely-charged ions. It is also interesting to note that this plane and direction correspond to the primary slip system for dislocation motion in bulk NaCl crystals [55].
One other mechanism by which major shape changes can occur is illustrated in Figure 7c. In this ‘hinge’ process the two halves of the cluster split apart and rotate about a common edge until they meet up again. Although spectacular this mechanism is unlikely to be relevant to the experiments because the barrier is probably too large (Fig. 6b) to be surmountable at the appropriate temperature; the transition state is 1.57 eV (1.21 eV for the Welch potential) above the minimum.
From the experiments of Jarrold and coworkers rates and activation energies were obtained for the conversion of the metastable nanocrystals to the global minimum [15]. Therefore, it would be useful if we could make estimates of the activation energies to provide independent support for our results. However, this is non-trivial. There are a number of possible approaches. For a complex process one needs to consider not the energy barrier, but the free energy barrier. The latter barrier could be computed by umbrella sampling [16] if a suitable order parameter was found which could distinguish the different nanocrystals. The rate of barrier crossing could then be calculated by performing a series of simulations which start from the top of the barrier [56, 57]. A second approach is to use a master equation to model the flow of probability between the minima on the PES [58]. However, to achieve reasonable results one would need a larger set of minima and transition states than we have obtained here. Furthermore, this approach also requires an expression for the rate constants for transitions between minima. Although these are easily calculated within the harmonic approximation using RRKM theory, more accurate rate constants which include the effects of anharmonicity are far harder to obtain. There are also two recently-developed techniques which could possibly be applied to calculate the rate constants: the macrostate variational method[59] and the transition path sampling approach of Chandler and coworkers[60, 61].
All these approaches are computationally demanding and beyond the scope of the present work. However, we can obtain an estimate of the activation energy if we make the approximation that the only important path between the nanocrystals is the one with lowest energy. The activation energy can then be equated with the energy difference between the highest energy transition state on this path and the starting minimum. At absolute zero this energy barrier is equal to the free energy barrier, however at non-zero temperatures the free energy barrier is likely to be reduced by the entropy associated with the multiplicity of paths between the two states. This interplay of energy and entropy has been observed in the free energy barrier between the lowest energy face-centred-cubic and icosahedral minima for a 38-atom Lennard-Jones cluster [10].
In Table III we give our estimates for the activation energies of pathways between the lowest energy isomers of each cuboidal nanocrystal. In the experiment it was only possible to find the activation energies for rearrangements between the and nanocrystals and the nanocrystal; the values were eV and eV, respectively [15]. These values are of the same order of magnitude as our estimates of the activation energies (Table III), although somewhat lower than we find for these specific transformations. The differences could be due to the empirical potentials employed or the approximations involved in our estimation of the activation energy, which would probably produce overestimates, as observed. It is also possible that we may not have found the lowest energy pathways. Furthermore, the barriers are calculated with respect to the lowest energy minima for a particular type of nanocrystal. However, as the barriers between minima with the same cuboidal shape can be quite large (e.g. in Figure 6a there is a barrier between two isomers which is 0.66eV) it is not certain that the nanocrystals in the experiment are in the lowest energy minimum for that shape.
Given these uncertainties it is not yet possible to use comparison of the experimental and estimated activation energies to provide additional confirmation of the glide mechanism. However, the universality of the glide mechanism amongst the many low energy paths that we have discovered strongly suggests that this process does mediate the structural transitions.
Although most of the results in this section are for the C+BM potential those we have obtained using the Welch potential encourage us to believe that the C+BM form provides a reasonable description of the interactions. The global minimum for is the same for the two potentials. Furthermore, the low energy minima are similar (Table II). There are a few changes in the energetic ordering of the minima; most significantly the minimum O is significantly lower than minimum L for the Welch potential. It is also interesting to note that the estimates of the activation energy are systematically lower when the Welch potential is used (Table III) bringing the values closer to those found in experiment[15].
V Discussion
At the transition state of the glide mechanism there are stacks of hexagonal rings perpendicular to the direction of sliding (Figure 7). Hexagonal rings are a common motif in small alkali halide clusters [62], and when the ratio of the cation to anion size is smaller than for NaCl, e.g. in the lithium halides, NaBr and NaI, the hexagonal structures are more stable than for NaCl [63]. Hence the glide mechanism might be even more favourable in these systems. To prove this supposition calculations similar to those in this paper could be performed. Furthermore, if this suggestion is correct the dependence of the kinetics of structural transformation on the particular alkali halide could be then used as an experimental test of the mechanism we have found here.
As the glide mechanism is a cooperative mechanism, unlike the surface diffusion mechanism originally suggested[15], it is expected that the barriers for this type of rearrangement would generally increase with size (although as with any cluster property it is likely that specific size effects would also be superimposed on this trend). The structural transitions would become more difficult with increasing size. Again this could probably be used as an experimental test of the mechanism.
The glide mechanism also has implications for the mechanical properties of these nanocrystals. It allows them to deform spontaneously and plastically to a thermodynamically more stable structure; in other words, the nanocrystals are soft. Similar homogeneous slip mechanisms, where whole planes of atoms slide past one another, have been seen in simulations of strained metal nanowires [64, 65]. As the barrier to these cooperative processes increases with the area of the sliding surface, they become less feasible as the size of the system increases. For the metal nanowires the increased barrier leads to a change in the slip mechanism to a more localized process, namely dislocation motion, with increasing size [65]; the dislocations maintain the ductility of the metal nanowire. In contrast, for NaCl nanocrystals, at temperatures relevant to the experiments considered here (7-67∘C [14]), dislocation motion is much more difficult than for metals. Therefore, the increasing barrier appears to lead to a dramatic change in mechanical properties. The nanocrystals become harder as their size increases, until a point is reached where an applied stress is more likely to cause fracture than plastic deformation, and the typical brittle behaviour of bulk NaCl crystals is recovered.
The mechanical properties of these NaCl nanocrystals provide another example of the unique finite-size properties of clusters. It might be possible to confirm the increased plasticity we predict using a microscope tip to deform NaCl nanocrystals soft-landed on a surface.
Previously, Ball et al. have compared relaxation to the global minimum of with Ar19 in terms of ‘monotonic sequences’ [52]. On this basis the salt cluster was described as a ‘structure-seeker’ because rapid removal of kinetic energy usually leads to rocksalt structures; in contrast it is relatively easy to quench Ar19 into a defective double icosahedron. The present results for are relevant to this relation between the energy landscape and relaxation dynamics, regardless of whether the glide mechanism is operative in .
Assuming that the model cluster discussed elsewhere has a landscape similar to we would expect different cuboidal rocksalt morphologies to lie at the bottom of separate funnels. Relaxation within each funnel is efficient, but relaxation between funnels will probably occur on a much longer time scale. Hence we can call the salt clusters ‘structure-seekers’ if by ‘structure’ we mean any of the cuboidal minima. By the same token, then, we should perhaps have bunched the defective double icosahedra together with the global minimum for Ar19 in the previous study [52]. In fact Ar19 is a ‘magic number’ cluster with an essentially single funnel landscape and so Ar19 is also quite an efficient ‘structure-seeker’. A better contrast would be provided by a cluster bound by a short range potential, where the landscape would be rougher, or by Ar38, whose double funnel landscape we have investigated elsewhere [8, 9, 10, 17, 49]. The point is that the salt cluster relaxes faster down any one funnel than Ar19, but may not reach the global minimum except over a longer time scale.
Acknowledgements.
We would like to thank Alex Shvartsburg and Martin Jarrold for calculating the mobilities of some of the structures and for helpful discussions. D.J.W. is grateful to the Royal Society for financial support. The work of the FOM Institute is part of the scientific program of FOM and is supported by the Nederlandse Organisatie voor Wetenschappelijk Onderzoek (NWO).REFERENCES
- [1] R. S. Berry, T. L. Beck, H. L. Davis, and J. Jellinek, Adv. Chem. Phys. 70, 75 (1988).
- [2] J. P. Rose and R. S. Berry, J. Chem. Phys. 96, 517 (1992).
- [3] L. S. Bartell, J. Phys. Chem. 99, 1080 (1995).
- [4] A. Proykova and R. S. Berry, Z. Phys. D 40, 215 (1997).
- [5] P. M. Ajayan and L. D. Marks, Phys. Rev. Lett. 60, 585 (1988).
- [6] L. D. Marks, Rep. Prog. Phys. 57, 603 (1994).
- [7] J. P. K. Doye, D. J. Wales, and R. S. Berry, J. Chem. Phys. 103, 4234 (1995).
- [8] J. P. K. Doye and D. J. Wales, Phys. Rev. Lett. 80, 1357 (1998).
- [9] J. P. K. Doye, D. J. Wales, and M. A. Miller, J. Chem. Phys. in press (cond-mat/9806020).
- [10] J. P. K. Doye, M. A. Miller, and D. J. Wales, in preparation .
- [11] J. E. Campana et al., Phys. Rev. Lett. 47, 1046 (1981).
- [12] R. Pflaum, P. Pfau, K. Sattler, and E. Recknagel, Surf. Sci. 156, 165 (1985).
- [13] Y. J. Twu, C. W. S. Conover, Y. A. Yang, and L. A. Bloomfield, Phys. Rev. B 42, 5306 (1990).
- [14] P. Dugourd, R. R. Hudgins, and M. F. Jarrold, Chem. Phys. Lett. 267, 186 (1997).
- [15] R. R. Hudgins, P. Dugourd, J. M. Tenenbaum, and M. F. Jarrold, Phys. Rev. Lett. 78, 4213 (1997).
- [16] G. M. Torrie and J. P. Valleau, Chem. Phys. Lett. 28, 578 (1974).
- [17] J. P. K. Doye and D. J. Wales, Z. Phys. D 40, 194 (1997).
- [18] G. T. Barkema and N. Mousseau, (cond-mat/9804317).
- [19] G. T. Barkema and N. Mousseau, Phys. Rev. Lett. 77, 4358 (1996).
- [20] N. Mousseau and G. T. Barkema, Phys. Rev. E 57, 2419 (1998).
- [21] C. J. Cerjan and W. H. Miller, J. Chem. Phys. 75, 2800 (1981).
- [22] J. Simons, P. Jorgensen, H. Taylor, and J. Ozment, J. Phys. Chem. 87, 2745 (1983).
- [23] D. O’Neal, H. Taylor, and J. Simons, J. Phys. Chem. 88, 1510 (1984).
- [24] A. Banerjee, N. Adams, J. Simons, and R. Shepard, J. Phys. Chem. 89, 52 (1985).
- [25] J. Baker, J. Comp. Chem. 7, 385 (1986).
- [26] J. Baker, J. Comp. Chem. 8, 563 (1987).
- [27] N. Metropolis et al., J. Chem. Phys. 21, 1087 (1953).
- [28] M. P. Tosi and F. G. Fumi, J. Phys. Chem. Solids 25, 45 (1964).
- [29] D. O. Welch, O. W. Lazareth, G. J. Dienes, and R. Hatcher, J. Chem. Phys. 64, 835 (1975).
- [30] N. G. Phillips, C. W. S. Conover, and L. A. Bloomfield, J. Chem. Phys. 94, 4980 (1991).
- [31] A. J. Stone, The Theory of Intermolecular Forces (Clarendon Press, Oxford, 1996).
- [32] D. J. Wales, Chem. Phys. Lett. 166, 419 (1990).
- [33] D. J. Wales and T. R. Walsh, J. Chem. Phys. 105, 6957 (1996).
- [34] D. J. Wales and L. J. Munro, in preparation (1998).
- [35] Z. Li and H. A. Scheraga, Proc. Natl. Acad. Sci. USA 84, 6611 (1987).
- [36] D. J. Wales and J. P. K. Doye, J. Phys. Chem. A 101, 5111 (1997).
- [37] J. P. K. Doye and D. J. Wales, J. Chem. Soc., Faraday Trans. 93, 4233 (1997).
- [38] J. P. K. Doye and D. J. Wales, New J. Chem. in press (1998).
- [39] D. J. Wales and M. P. Hodges, Chem. Phys. Lett. 286, 65 (1998).
- [40] F. Y. Naumkin and D. J. Wales, Mol. Phys. 93, 633 (1998).
- [41] F. Y. Naumkin and D. J. Wales, Chem. Phys. Lett. 290, 164 (1998).
- [42] R. P. White and H. R. Mayne, Chem. Phys. Lett. 289, 463 (1998).
- [43] J. P. K. Doye and D. J. Wales, J. Phys. B 29, 4859 (1996).
- [44] B. Hartke, Chem. Phys. Lett. 258, 144 (1996).
- [45] D. J. Wales, J. P. K. Doye, A. Dullweber and F. Y. Naumkin, The Cambridge Cluster Database, URL http://brian.ch.cam.ac.uk/CCD.html.
- [46] A. A. Shvartsburg and M. F. Jarrold, Chem. Phys. Lett. 86, 261 (1996).
- [47] A. A. Shvartsburg, personal communication.
- [48] O. M. Becker and M. Karplus, J. Chem. Phys. 106, 1495 (1997).
- [49] D. J. Wales, M. A. Miller, and T. R. Walsh, Nature in press .
- [50] P. E. Leopold, M. Montal, and J. N. Onuchic, Proc. Natl. Acad. Sci. USA 89, 8271 (1992).
- [51] J. D. Bryngelson, J. N. Onuchic, N. D. Socci, and P. G. Wolynes, Proteins: Structure, Function and Genetics 21, 167 (1995).
- [52] K. D. Ball et al., Science 271, 963 (1996).
- [53] J. P. Rose and R. S. Berry, J. Chem. Phys. 98, 3262 (1993).
- [54] J. P. K. Doye and D. J. Wales, J. Chem. Phys. 105, 8428 (1996).
- [55] M. T. Sprackling, The plastic deformation of simple ionic crystals (Academic Press, London, 1976).
- [56] D. Chandler, Introduction to Modern Statistical Mechanics (Oxford University Press, Oxford, 1987).
- [57] M. J. Ruiz-Montero, D. Frenkel, and J. J. Brey, Mol. Phys. 90, 925 (1997).
- [58] R. E. Kunz and R. S. Berry, J. Chem. Phys. 103, 1904 (1995).
- [59] A. Ulitsky and D. Shalloway, J. Chem. Phys. 109, 1670 (1998).
- [60] C. Dellago, P. G. Bolhuis, F. S. Csajka, and D. Chandler, J. Chem. Phys. 108, 1964 (1998).
- [61] C. Dellago, P. G. Bolhuis, and D. Chandler, J. Chem. Phys. 108, 9236 (1998).
- [62] N. G. Phillips, C. W. S. Conover, and L. A. Bloomfield, J. Chem. Phys. 94, 4980 (1991).
- [63] A. Aguado, A. Ayueal, J. M. López, and J. A. Alonso, Phys. Rev. B 56, 15353 (1997).
- [64] G. M. Finbow, R. M. Lynden-Bell, and I. R. McDonald, Mol. Phys. 92, 705 (1997).
- [65] M. R. Sørensen, M. Brandbyge, and K. W. Jacobsen, Phys. Rev. B 57, 3295 (1998).
- [66] D. J. Wales, J. Chem. Phys. 101, 3750 (1994).
| C+BM | Welch | |||
|---|---|---|---|---|
| Energy/eV | PG | Energy/eV | PG | |
| 1 | ||||
| 2 | ||||
| 3 | ||||
| 4 | ||||
| 5 | ||||
| 6 | ||||
| 7 | ||||
| 8 | ||||
| 9 | ||||
| 10 | ||||
| 11 | ||||
| 12 | ||||
| 13 | ||||
| 14 | ||||
| 15 | ||||
| 16 | ||||
| 17 | ||||
| 18 | ||||
| 19 | ||||
| 20 | ||||
| 21 | ||||
| 22 | ||||
| 23 | ||||
| 24 | ||||
| 25 | ||||
| 26 | ||||
| 27 | ||||
| 28 | ||||
| 29 | ||||
| 30 | ||||
| 31 | ||||
| 32 | ||||
| 33 | ||||
| 34 | ||||
| 35 | ||||
| Rank | Energy/eV | PG | structure | |||
|---|---|---|---|---|---|---|
| C+BM | Welch | C+BM | Welch | |||
| A | 1 | 1 | -265.748 | -267.756 | ||
| B | 2 | 4 | -265.741 | -267.653 | ||
| C | 3 | 2 | -265.739 | -267.721 | ||
| D | 4 | 6 | -265.685 | -267.582 | ||
| E | 5 | 3 | -265.658 | -267.656 | ||
| F | 6 | 5 | -265.652 | -267.588 | ||
| G | 7 | 8 | -265.606 | -267.524 | ||
| H | 8 | 7 | -265.601 | -267.573 | ||
| I | 9 | 12 | -265.592 | -267.476 | ||
| J | 10 | 25 | -265.573 | -267.417 | ||
| K | 11 | 13 | -265.557 | -267.467 | ||
| L | 12 | 29 | -265.543 | -267.400 | ||
| M | 13 | 15 | -265.542 | -267.465 | ||
| N | 14 | 16 | -265.519 | -267.445 | ||
| O | 15 | 9 | -265.507 | -267.502 | ||
| From | To | barrier/eV | path length/Å |
|---|---|---|---|
| 0.78 (0.69) | 33.5 | ||
| 1.06 (0.91) | 69.8 | ||
| L | 0.62 (0.41) | 66.3 | |
| O | 0.60 (0.54) | 46.6 | |
| 1.06 (0.91) | 36.3 | ||
| L | 0.63 (0.44) | 57.1 | |
| O | 0.56 (0.54) | 14.4 | |
| L | 1.01 (0.83) | 92.6 | |
| O | 0.97 (0.91) | 50.7 | |
| O | L | 0.60 (0.43) | 42.8 |