[
Phases of the one-dimensional Bose-Hubbard model
Abstract
The zero-temperature phase diagram of the one-dimensional Bose-Hubbard model with nearest-neighbor interaction is investigated using the Density-Matrix Renormalization Group. Recently normal phases without long-range order have been conjectured between the charge density wave phase and the superfluid phase in one-dimensional bosonic systems without disorder. Our calculations demonstrate that there is no intermediate phase in the one-dimensional Bose-Hubbard model but a simultaneous vanishing of crystalline order and appearance of superfluid order. The complete phase diagrams with and without nearest-neighbor interaction are obtained. Both phase diagrams show reentrance from the superfluid phase to the insulator phase.
pacs:
PACS numbers: 05.30.Jp, 05.70.Jk, 67.40.Db]
Quantum phase transitions in strongly correlated systems have attracted a lot of interest in recent years. Usually the basic particles are electrons, but in some interesting cases the relevant particles are not fermions but bosons. Examples of experimental systems with superfluid and insulating phases are Cooper pairs in thin granular superconducting films [1] and cooper pairs or fluxes in Josephson junction arrays[2]. While in dimensions greater than one the existence of supersolids [3], i.e. phases with simultaneous superfluid and crystalline order, has been established in theoretical work, the situation in one dimension is less clear. Recently normal phases that are neither crystalline nor superfluid have been found in a one-dimensional model of Josephson junction arrays [4] in the region where supersolids are found in higher dimensions. In this paper we will verify whether supersolids or normal phases exist in the more general Bose-Hubbard model in one dimension.
The Bose-Hubbard model contains the basic physics of interacting bosons on a lattice. It is a minimal bosonic many-particle model that cannot be reduced to a single particle model. The bosons have repulsive interactions, and they can gain energy by hopping to neighboring sites on the lattice. The Hamiltonian with on-site and nearest-neighbor interactions is
| (1) | |||||
| (2) |
where are the annihilation operators of bosons on site i, the number of particles on site i, is the hopping matrix element. and are on-site and nearest-neighbor repulsion, and is the chemical potential. The energy scale is set by choosing .
The range of the interactions depends on the individual experimental situation. In general the lattice underlying the system is not an atomic lattice, but a larger structure like a Josephson-junction or a grain in a superconductor. In Josephson-junctions the relevant bosons can be cooper pairs or fluxes, resulting in different interactions.
As a starting point we first consider the case of on-site repulsion only. In the -plane Mott-insulating regions are surrounded by the superfluid phase [5]. These phases are separated by two types of phase transitions. On the constant density line the transition is driven by phase fluctuations and is of the Berezinskii-Kosterlitz-Thouless (BKT) type. The phase transition at the sides of the insulator, the generic phase transition[5], is driven by density fluctuations.
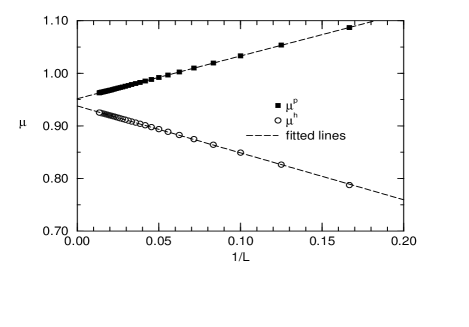
The Mott-insulating phases have integer densities and are incompressible, at the generic phase transition to the compressible superfluid phase the density of the system changes from commensurate to incommensurate. The characteristic energy of this transition is the energy it costs to create a particle (p) or hole (h) exitation in the system. To calculate this energy we use defect states [6] with the density of the Mott-insulator plus one additional particle or hole. Since the defect states and the insulator groundstate have fixed densities, a change in the chemical potential by does not change the states themselves, but shifts their energy by , where is the total particle number. Taking into account that the characteristic energy is zero at the phase transition, this gives , where is the chemical potential at the phase transition and the critical exponent [5].
We use the infinite-size algorithm of the density-matrix renormalization group (DMRG) [7] with periodic boundary conditions to determine . While the maximum number of particles per site in the Bose-Hubbard model is , it has to be cut off for practical calculations with the DMRG. A maximum occupation number of [8] turned out to be sufficient.
Since the two defect states, one with an additional particle, one with an additional hole, are needed to calculate the energy , they are used as additional target states in the DMRG. Systems of up to 76 sites are calculated, keeping states in each iteration. The chemical potential of the phase transition is calculated for various system sizes. The thermodynamic limit is found by extrapolating to infinite system size (Fig.1). Repeating this calculation for various gives the phase boundaries.
At the tips of the insulator lobes the phase transition is driven by phase fluctuations. The characteristic length of this transition is the correlation length
| (3) |
of the correlation function
| (4) |
The corresponding energy is the energy gap between the groundstate and the first excited state with the same density: with the critical dynamical exponent .
The correlation length in the thermodynamic limit can be found by extrapolating from finite systems: , where is the system size and are fitting constants. The exponential term is small (), with , the results are not changed significantly by neglecting the exponential term. The phase transition is of the BKT type, where the correlation length diverges like
| (5) |
One way to find the critical point is fitting (5) to the calculated data [9, 10, 11]. But by changing the fitting parameters, this function can go to zero arbitrarily slow, hence this method is very sensible to numerical errors and the choice of data points, and we will not use it.
Instead we locate the BKT transition using the analogy of the superfluid phase to the Luttinger liquid [12]. In the superfluid phase the correlation function decays algebraically:
| (6) |
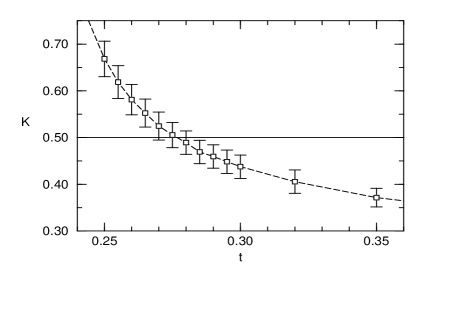
The exponents at the phase transitions are known from Luttinger liquid theory [13]. At the BKT transition with , is expected to be . An algebraic function is fitted to the correlation functions calculated with DMRG for different system sizes. Due to the periodic boundary conditions the decay of is very close to algebraic even in small systems. The thermodynamic limit of is found by extrapolating . Since the decay of is very close to (6), the main source of errors in is this extrapolation from finite system sizes. We find the phase transition at .
This is in good agreement with found in an exact diagonalization approach[9], and in qualitative agreement with the Bethe-Ansatz solution for the truncated model with a maximum of particles per site [14]. Three works find somewhat bigger values [11], [15] and [10]. Early QMC simulations resulted in [16]. The range of these results demonstrates that determining the location of the BKT transition is ill-conditioned.
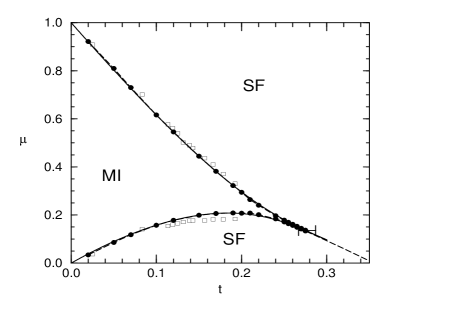
Fig. 3 shows the phasediagram in the -plane, including the generic phase boundaries and the location of the BKT transition. For we find that the lower phase boundary is bending down. This means that the Mott-insulator phase is reentrant as a function of , an unusual feature that has not been observed before. It implies that increasing , which corresponds to increasing the kinetic energy, can lead to a reentrance phase transition from the superfluid phase to the insulator phase.
In a study inspired by this work a high order strong coupling expansion [17] was used to determine the phase diagram. The phase boundaries found in that work are in excellent agreement with our DMRG results, demonstrating the high numerical accuracy that can be achieved with the DMRG. The strong coupling expansion study confirms the existence of the reentrant phase transition first found in this work.
One experimental realization of a one dimensional bosonic lattice system is provided by fluxes in a Josephson-junction array. In a recent experiment [2] Mott-insulators with flux densities , , , .. were found. In the Bose-Hubbard model insulators with these densities can only appear in the presence of longer ranged interactions. A first step in understanding these longer ranged interactions is studying the effect of repulsion between nearest neighbors.
In the presence of nearest-neighbor interaction a new insulator phase appears at half integer densities. It is a charge density wave phase (CDW) with a wavelength of two sites, and like the Mott-insulator at integer density it has an excitation gap and is incompressible. The crystalline order is characterized by the non-zero structure factor
| (7) |
in the thermodynamic limit is determined by extrapolating from DMRG calculations for finite systems. A maximum particle number of four particles per site is chosen for . Since the groundstate and the first exited state in the CDW are degenerate in the thermodynamic limit, and close to degeneracy in finite systems, the first exited state is used as an additional target state. is found to scale like . The exponential term gives only a very small contribution (), is of the order .
In contrast to the transition from the Mott insulator to the superfluid, which is governed by superfluid order only, the transition from the CDW to the superfluid is governed by superfluid and crystalline order.
There are three possible scenarios for this transition: a) There is a direct phase transition - the vanishing of crystalline order and the appearance of superfluid order coincide. b) There is an intermediate phase with simultaneous superfluid and crystalline order, the so-called supersolid phase [3]. c) There is an intermediate normal phase with neither superfluid nor crystalline order.
In higher dimensional bosonic systems supersolids exist, but they have not been observed in one-dimensional systems so far[18]. Recently a normal phase (scenario c) was found in a numerical study of the one-dimensional Quantum-Phase model [4], which is the high density limit of the Bose-Hubbard model. This raises the question whether such a normal phase also exists in the Bose-Hubbard model.
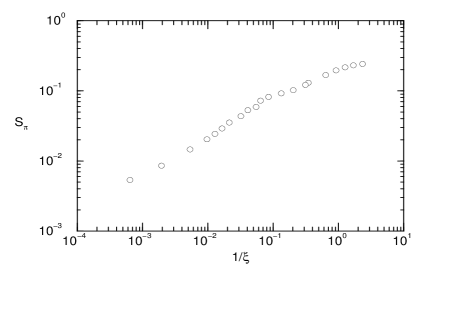
The correlation length (3) characterizing superfluid order diverges in the superfluid phase. If the structure factor is also governed by this correlation length, there is a direct phase transition from the CDW phase to the superfluid phase. In that case, close to the phase transition , where is a scaling function. Note that this functional form cannot be transformed to a power law behavior depending on due to the BKT behavior of (5). To verify the existence of at the CDW to superfluid transition, we plot versus (Fig.4). We find , which shows that there is a direct phase transition and no normal or supersolid phase.
The superfluid stiffness in the Luttinger Liquid is always non-zero, even for large [5]. It has been shown that for a single weak link or barrier [19, 20] becomes relevant, reducing the superfluid stiffness to zero by effectively cutting the system in two parts. Since at the sides and at the tip of the CDW[13], this means that the CDW is surrounded by a region with . The normal phase found by Baltin and Wagenblast [4] was observed in a Quantum Monte Carlo study at finite temperatures, where the zero-temperature phase diagram was extracted with finite-size scaling. Baltin and Wagenblast suggested that the normal phase might be the region of the Luttinger Liquid with . But since their calculations were for a system without impurities, which at incommensurate densities always has a superfluid stiffness, they should not have observed an effect caused by an impurity. A possible explanation of their result is that thermal fluctuations might have a similar effect as a weak link. This is supported by the fact that Baltin and Wagenblast could not determine the scaling function for the dependence of the superfluid stiffness on system size and temperature.

The onset of superfluidity is again determined by the decay of the correlation functions. At the CDW the critical exponent is . The BKT transition is found at . This is in agreement with found with QMC [18]. For the Mott-insulator with density the exponent is found to change very slowly close to the phase transition, causing a high error margin in our calculation. We find the critical value at . This indicates that the critical point is shifted to higher ratios of by increasing . Within the numerical accuracy the critical point may also be independent of . This contradicts QMC results that is reduced if is increased[18]. For they found .
Fig. 5 shows the phase diagram of the Bose-Hubbard model with nearest-neighbor interaction in one dimension. To our knowledge this is the first time this phase diagram has been calculated. The tips of the insulating regions are bending down towards smaller chemical potentials, which shows the reentrant behavior already observed in the case without nearest-neighbor interaction.
In conclusion, we have presented methods to determine the generic as well as the BKT phase transitions of the Bose-Hubbard model with the DMRG. At the tips of the insulating regions we found a reentrant phase transition from the superfluid phase to the insulator. Including nearest-neighbor interactions we obtained the new phase diagram and demonstrated that there is no normal or supersolid phase, but a direct phase transition from the CDW to the superfluid phase.
We would like to thank T. Giamarchi, A. J. Millis, R. Noack, A. v. Otterlo, G. Schön, H. Schulz and S. R. White for useful and interesting discussions.
REFERENCES
- [1] B. G. Orr et al., Phys. Rev. Lett. 56, 378 (1986); D. B. Haviland et al., Phys. Rev. Lett. 62, 2180 (1989); H. M. Jaeger et al., Phys. Rev. B 40, 182 (1989).
- [2] A. van Oudenaarden and J. E. Mooij, Phys. Rev. Lett. 76, 4947 (1996); A. van Oudenaarden et al., Phys. Rev. B 57, 11684 (1998).
- [3] M. W. Meisel, Physica B 178, 121 (1992); A. van Otterlo and K.-H. Wagenblast, Phys. Rev. Lett. 72, 3598 1994; G. G. Batrouni et al., Phys. Rev. Lett. 74, 2527 (1995).
- [4] R. Baltin and K.-H. Wagenblast, Europhys. Lett. 39, 7 (1997).
- [5] M. P. A. Fisher et al., Phys. Rev. B 40, 546 (1989).
- [6] J. K. Freericks and H. Monien, Phys. Rev. B 53, 2691 (1996).
- [7] S. R. White, Phys. Rev. Lett. 69, 2863 (1992).
- [8] Pai et al. [11] have chosen a cut-off of four particle per site for the same phase. Kashurnikov and Svistunov [15] found to be very close to the full model.
- [9] V. F. Elesin et al., Pis’ma Zh. Eksp. Teor. Fiz. 60, 174 (1994) [JETP Lett. 60, 177 (1994)].
- [10] V. A. Kashurnikov et al., Pis’ma Zh. Eksp. Theo. Fiz. 64, 92 (1996) [JETP Lett. 64, 99 (1996)].
- [11] R. V. Pai et al., Phys. Rev. Lett. 76, 2937 (1996).
- [12] F. D. M. Haldane, Phys. Rev. Lett. 47, 1840 (1981).
- [13] T. Giamarchi and A. J. Millis, Phys. Rev. B 46, 9325 (1992).
- [14] W. Krauth, Phys.Rev.B 44, 9772 (1991).
- [15] V. A. Kashurnikov and B. V. Svistunov, Phys. Rev. B 53, 11776 (1996).
- [16] G. G. Batrouni and R. T. Scalettar, Phys. Rev. B 46, 9051 (1992).
- [17] N. Elstner and H. Monien, preprint, cond-mat/9807033.
- [18] P. Niyaz et al., Phys. Rev. B 50, 362 (1994).
- [19] C. L. Kane and M .P. A. Fisher, Phys. Rev. B 46, 15233 1992.
- [20] L. I. Glazman and A. I. Larkin, Phys. Rev. Lett. 79, 3736 (1997).