Domain Walls Motion and Resistivity in a Fully-Frustrated Josephson Array
Abstract
It is identified numerically that the resistivity of a fully-frustrated Josephson-junction array is due to motion of domain walls in vortex lattice rather than to motion of single vortices.
A square two-dimensional periodic Josephson-junction array (JJA) in a uniform transverse magnetic field, with half a flux quantum per plaquette, is a realization of a fully frustrated (FF) model [1]. Its ground state is a checkerboard pattern of plaquettes with currents flowing clockwise and anti-clockwise [2].The chirality, defined as the sum of currents around plaquette in a clockwise direction, has antiferromagnetic order. Apart from Kosterlitz-Thouless (KT) [3] transition as in the unfrustrated case the FF model has an Ising-like transition of chiral ordering [4],[5]. Numerical [4] - [8] and analytical [9] work indicates that critical temperatures of KT and Ising transitions are very close or equal. Mon and Teitel [10] studied current-voltage curves of the FF JJA using Langevin-dynamics simulation. They found that the temperature dependence of the exponent of the current voltage characteristics () does not follow the form expected from the results of equilibrium simulations of helicity modulus of FF model [4]. In particular there were no sign of discontinuity in at the critical temperature, while the discontinuity was observed in the helicity modulus [4]. Mon and Teitel [10] proposed that this discrepancy is because apart from vortex-antivortex pairs (KT excitations) the system has excitations in the form of domain walls in vortex lattice (Ising excitations), motion of which also contributes to resistivity. Disagreement between the exponent of the current voltage characteristics of FF JJA and helicity modulus of FF model has been also observed experimentally, when in some cases [11] no sign of discontinuity in was seen , and in others the sharp jump in was observed [12], but it was substantially below , expected from simulations. In contrast for the unfrustrated case [13] the sharp jump in was observed at the temperature equal to , found in simulations. Some experiments[14] on superconducting wire networks in a magnetic field have reported exponential, instead of power-law, curves. The exponential form is expected theoretically [10] if resistivity is due to motion of thermally activated domain-walls in vortex lattice.
In this article it is shown, by numerical simulations, that domain-wall motion dominates the resistivity at least at low temperatures and small currents.
In simulations the modification of Langevin dynamics method of Refs. [10] and [15] proposed by Falo, Bishop, and Lomdahl [17] was used. All junctions are assumed to have the same critical currents and to be shunted by resistances and all superconducting nodes to have a capacitance to the ground . The resulting set of dynamic equations (which follows from Josephson equations and the charge conservation law) is:
| (1) |
| (2) | |||
| (3) |
| (4) |
Here is the phase, is the electrostatic potential and is the charge of the superconducting node on site , is the integral of the vector potential from node to (sum of around the plaquette is equal to the number of magnetic flux quantums through the plaquette). Summation is over nearest neighbors only. is a thermal noise current with:
| (5) |
with the temperature.
Instead of the uniform injection of Ref. [10] injection from the superconducting bars at the edges of the array (see Fig. 1) was used in this work in order to imitate the experiment [12], [13]. Free boundary conditions in the transverse direction where used for the same reason. The bars were connected to each of the nodes at the edges of the array by Josephson junctions. The external current was injected into the left bar and extracted from the right bar. It was observed [16] that for the FF JJA injection from bars leads to unreasonably low zero-temperature critical current in comparison to uniform injection. The reason for this is that FF plaquettes adjacent to bars have only three Josephson-junctions leading to bigger phase differences in the ground state and therefore lower critical currents. In this work plaquettes adjacent to bars were assumed unfrustrated (experimentally this would correspond to this plaquettes having an area much smaller than plaquettes in the bulk) and the zero-temperature critical current was the same as in the case of the uniform injection (), though lower than the theoretical value for an infinite array ()[18],[19].

Simulations were done for the intermediate damping case, i.e. for McCumber parameter . The equations of motion were integrated with discrete time steps in units of inverse Josephson plasma frequency . Decreasing ten times did not change the results.
The phase difference across the array was recorded as a function of time (see Fig. 2). The average voltage is:
| (6) |
where and are the phase differences across the array at the beginning and the end of the run correspondingly, and is the run time (in units of ). To estimate the errors each run was divided in four intervals and average voltages for this intervals were calculated. The estimated errors are .


In the following we shall adopt the following units: the current is measured in units of the critical current of the unfrustrated array , the voltage in units of , and the temperature in units of the Josephson energy .
Looking at Figure 2 (a) and (b), where phase difference across unfrustrated and frustrated arrays is plotted versus time, one can notice a remarkable difference. While the phase difference across the unfrustrated array grows by jumps, the one across the fully-frustrated array grows by giant jumps. In order to quantify results more we classify jumps according to their size. A jump of size is put into bin such that . A fraction of the total phase slip, due to jumps in each bin is shown in Fig. 3. We see that for unfrustrated array jumps in 1st and 2nd bins (that is ) dominate, while for the fully-frustrated array jumps in 5th bin () give biggest contribution to the total phase slip.

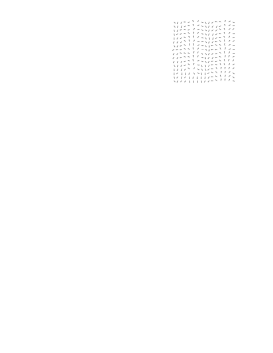
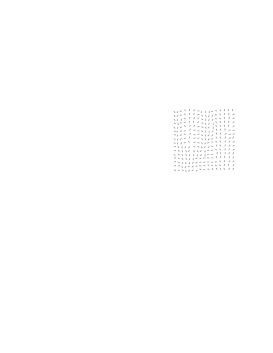
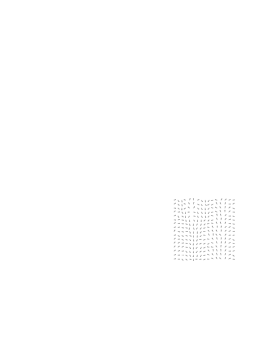
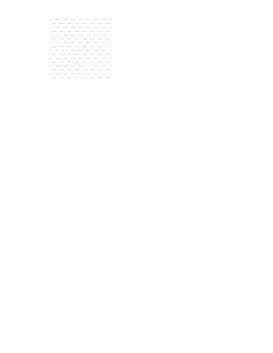
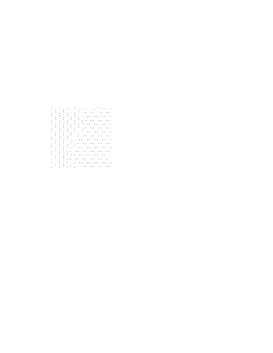
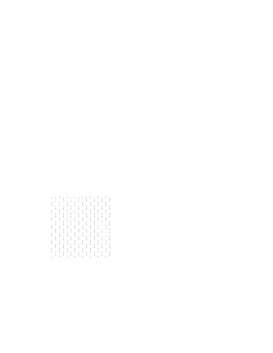
As the Langevin dynamics simulation is performed using pseudo-random numbers one can always go back and investigate what happens in the vicinity of the jump in detail. In Fig. 4 the 3 snapshots of the unfrustrated array in the region of one of the jumps are shown. One can clearly see a vortex crossing the array. Therefore the resistivity in the unfrustrated array is due to vortex crossing [20]. In Fig. 5 the 3 snapshots of the FF array in the region of the giant jump are shown. It is hard to see what is going on in the FF array in the phase representation, therefore the chirality (sum of currents around plaquette in a clockwise direction) representation was used. However even then domain walls are not readily seen. To make them clearly visible one ground state is represented by vertical and other by horizontal arrows. One can see that before the giant jump the array is in one of chiral ground states, during the jump the domain of opposite chirality grows and at the end of the jump it fills all of the array. Resistivity of the FF array is therefore due to domain wall motion.
The method described here works, however, only for low temperatures ()and low currents (). When the temperature or current is increased one has difficulties in identifying the separate jumps, while the phase difference - time curve is smooth.


The curves of the FF array for different temperatures are shown in Fig. 6. And the exponent (), obtained from them, is shown in Fig. 7. There is a good agreement between the data of Fig.6 and those of Mon and Teitel (Fig.1(b) of Ref. [10]). There is less agreement between the exponent obtained in this work (Fig. 6) and that of Mon and Teitel (Fig. 2 of Ref. [10]). This is due to the fact that much lower currents have been studied in the present work than in Ref. [10], where was obtained by fitting the curves in the region of current just below the critical one. In this work was obtained by fitting in the region of current 0.05-0.1 (in units of the critical current of the unfrustrated array). For higher current single-junction effects are important, for lower ones - finite size effects [21] cause the change of the curve from nonlinear to linear. It is interesting, that though the resistivity is due to domain walls motion the curves still can be fitted by the power law. In Fig. 7 the theoretically expected [22] exponent of the relation, calculated as
| (7) |
using helicity modulus obtained in Ref. [4] is shown by dashed line. Though agreement between predicted using helicity modulus and obtained from curves of the present work is better than in Ref. [10], still there is disagreement. The reason for it is probably domain wall contribution to resistivity, as suggested by Mon and Teitel [10] and demonstrated explicitly in the present work.
In conclusion in this work an approach is suggested when one records phase difference across the Josephson array versus time (time derivative of the phase difference is the voltage). Resulting pictures are different in the cases of unfrustrated and fully frustrated arrays. In the first case phase difference grows by jumps, while in the last by giant (many ) jumps. Snapshots of the array in the region of a giant jump show that during it there is a transition from one of two chiral ground state to another, therefore identifying the mechanism of resistivity as domain walls motion.
I am grateful to J.M. Kosterlitz for useful conversations and to E.Granato and S.Teitel for correspondence. This work was supported by NSF Grant No. DMR-9222812 and DOE Contract No. DE-F602-88-ER13847. Computations were done at the Theoretical Physics Computing Facility at Brown University.
REFERENCES
- [1] J.Villain, J.Phys.C 10,1717(1977).
- [2] S.Teitel and C.Jayaprakash, Phys. Rev. Lett. 51, 1999(1983).
- [3] J.M.Kosterlitz and D.J.Thouless, J.Phys C 6, 1181 (1973).
- [4] S.Teitel and C.Jayaprakash, Phys. Rev. B 27, 598 (1983).
- [5] B.Berge,H.T.Diep, A.Ghazali,and P.Lallemand, Phys. Rev. B 34, 3177 (1986).
- [6] D.H. Lee, J.D. Joannopoulos, J.W. Negele, and D.P. Landau, Phys. Rev. B 33, 450 (1986).
- [7] G. Ramirez-Santiago and J.V. Jose, Phys. Rev. Lett. 68, 1224(1992); ibid 77, 4849 (1996).
- [8] P.Olson, Phys. Rev. Lett. 75, 2758 (1995); ibid 77, 4850 (1996); Phys. Rev. B 55, 3585 (1997).
- [9] E.Granato and J.M.Kosterlitz, Phys. Rev. B 33, 4767 (1986).
- [10] K.K.Mon and S.Teitel, Phys. Rev. Lett. 62 673 (1989).
- [11] B.J. van Wees, H.S.J. van der Zant, and J.E. Mooij, Phys. Rev. B 35, 7291 (1987).
- [12] H.S.J. van der Zant, H.A. Rijken, and J.E. Mooij, J.Low Temp.Phys. 82, 67 (1991).
- [13] H.S.J. van der Zant, H.A. Rijken, and J.E. Mooij, J.Low Temp.Phys. 79, 289 (1990).
- [14] X.S. Ling, H.J. Lezec, M.J. Higgins, J.S. Tsai, J. Fujita, H. Numata, Y. Nakamura, Y. Ochiai, C. Tang, P.M. Chaikin, and S. Bhattacharya, Phys. Rev. Lett. 76, 2989 (1996); F. Yu, N. Israeloff, A.M. Goldman, and R. Bojko, ibid 68, 2535 (1992).
- [15] J.S. Chung, K.H. Lee, and D. Stroud, Phys. Rev. B 40, 6570, (1989).
- [16] J.U. Free, S.P. Benz, M.S. Rzchowski, M. Tinkham, and C.J. Lobb , Phys. Rev. B 41, 7267 (1990).
- [17] F.Falo, A.R. Bishop, and P.S. Lomdahl , Phys. Rev. B 41, 10893 (1990).
- [18] S.P.Benz, M.S. Rzchowski, M. Tinkham, and C.J. Lobb, Phys. Rev. B 42 6165 (1990).
- [19] T.C. Halsey, Phys. Rev. B 31 5728 (1985).
- [20] Larger than jumps in the unfrustrated array may be due to the fact that pair unbinding occurs when temperature rises due to a fluctuation, however in this case other pairs in the array are likely to unbind as well.
- [21] M.V. Simkin and J.M.Kosterlitz, Phys. Rev. B, 55 (1997) 11646 (also cond-mat/9610141).
- [22] B.I. Halperin and D.R. Nelson, J.Low Temp.Phys. 36, 599 (1979); V. Ambegaokar, B.I. Halperin, D.R. Nelson, E.D. Siggia, Phys. Rev. B 21, 1806 (1980).