Test of mode coupling theory for a supercooled liquid of diatomic molecules.I. Translational degrees of freedom
Abstract
A molecular dynamics simulation is performed for a supercooled liquid of rigid diatomic molecules. The time-dependent self and collective density correlators of the molecular centers of mass are determined and compared with the predictions of the ideal mode coupling theory (MCT) for simple liquids. This is done in real as well as in momentum space. One of the main results is the existence of a unique transition temperature , where the dynamics crosses over from an ergodic to a quasi-nonergodic behavior. The value for agrees with that found earlier for the orientational dynamics within the error bars. In the -regime of MCT the factorization of space- and time dependence is satisfactorily fulfilled for both types of correlations. The first scaling law of ideal MCT holds in the von Schweidler regime, only, since the validity of the critical law can not be confirmed, due to a strong interference with the microscopic dynamics. In this first scaling regime a consistent description within ideal MCT emerges only, if the next order correction to the asymptotic law is taken into account. This correction is almost negligible for , the position of the main peak in the static structure factor , but becomes important for , the position of its first minimum. The second scaling law, i.e. the time-temperature superposition principle, holds reasonably well for the self and collective density correlators and different values for . The -relaxation times and follow a power law in over 2 – 3 decades. The corresponding exponent is weakly -dependent and is around . This value is in agreement with the one predicted by MCT from the value of the von Schweidler exponent but at variance with the corresponding exponent obtained for the orientational correlators and , studied earlier.
pacs:
PACS numbers: 61.43.Fs, 61.20.Ja, 02.70.Ns, 64.70.PfI Introduction
Although several interpretations of the glass transition exist (see e.g. Ref. [1]), the only microscopic approach leading to a variety of predictions is based upon the mode coupling theory (MCT). This theory, which was proposed first by Bengtzelius, Götze and Sjölander [2] and Leutheusser [3], provides an equation of motion for the normalized density correlator
| (1) |
of a simple liquid. Note that depends on only, due to the isotropy of the system. In its idealized version, MCT predicts the existence of a dynamical transition at a critical temperature (or a critical density ) from an ergodic to a nonergodic phase, corresponding to a liquid and a glass, respectively. The nonergodicity parameter (NEP)
| (2) |
serves as an order parameter for that transition. may change either continuously (type-A transition) or discontinuously (type-B transition) at . For the structural glass transition only the latter is relevant.
The test of the predictions of the ideal MCT has challenged both, experimental work and computer simulations. Most of the experiments have determined the intermediate scattering function or its time-Fourier transform, the dynamical structure factor (coherent and incoherent part). This yields information on the dynamics of the translational degrees of freedom (TDOF), only. A great part of these investigations was reviewed by Götze and Sjögren [4] and in Refs. [5].
Since most of the glass formers are molecular systems, it is also important to study the role of the orientational degrees of freedom (ODOF) and their coupling to the TDOF. A convenient way for this is, e.g., the use of dielectric spectroscopy. Recent results from dielectric measurements [6] are partly consistent with the predictions of MCT for simple liquids. The interpretation of light scattering experiments is not so obvious. Since TDOF and ODOF may both contribute to light scattering, it is not so easy to separate the orientational part. (see e.g. Ref. [7]). Concerning computer simulations, only a few molecular liquids have been studied so far [8, 9, 10, 11, 12, 13, 14, 15]. In a recent molecular dynamics [MD]-simulation [16] the present authors investigated a liquid of diatomic, rigid molecules with Lennard-Jones interactions. Apart from linear molecules with head-tail symmetry, this is the simplest choice for a molecular system. Because dielectric and light scattering measurements yield essentially only information for , we restricted ourselves to orientational correlators with and to the translational and rotational diffusion constant and , respectively [16]. The main result we have found is the existence of a power law dependence of all the orientational relaxation times , () and of on temperature with a single critical temperature , in agreement with ideal MCT. Slightly above the numerical results for , and deviate from a power law, due to ergodicity restoring processes. These processes, which are not considered by the ideal MCT, can be accounted for by its extended version [17]. The observation that the temperature dependence of does not fit into this scheme, but bifurcates from at a temperature significantly above and then obeys an Arrhenius law, rather than a power law, has been a further important result.
The main purpose of the present and the following paper [18] is the extension of our recent results [16] to finite and to perform a thorough test of the predictions of the ideal MCT. The present paper is restricted to the TDOF only, whereas the following paper [18] considers orientational correlators, which explicitly contain the coupling between ODOF and TDOF. Although our simulation investigates a molecular system, we make a comparison with the predictions of MCT for simple liquids. The ideal MCT for simple liquids has been recently extended to a dumbbell molecule in a simple liquid [19] and to molecular liquids of linear [20, 21] and arbitrary shaped molecules [22]. So far, the investigations of these molecular MCT-equations were restricted to the calculation of the NEP [19, 21, 22]. For linear molecules without head-tail symmetry, it follows from these equations [21] that the TDOF and ODOF freeze at a single critical temperature , consistent with our recent results for [16]. The investigation of the time dependent molecular MCT-equations, which would allow comparison with our MD-results, will be done in future.
The outline of this paper is as follows. The next section will review the predictions of the ideal MCT (for simple liquids) which will be tested. In section III the model as well as some details of the computer simulation are discussed. In section IV we present our MD-results and the final section contains a discussion of these results and our main conclusions.
II mode-coupling theory
In this section we will give a short summary of those predictions of the ideal MCT (for simple liquids), which will be compared with our MD-results. For details the reader may consult the review papers [4, 5]. For completeness we also would like to mention the MCT-approach by use of nonlinear fluctuating hydrodynamics [23, 24].
Ideal MCT predicts the existence of a dynamical transition at from an ergodic to a nonergodic phase which is an ideal glass transition. For temperatures close to , MCT predicts the existence of two scaling laws for with time scales and , where is the -relaxation time. In the first scaling regime, i.e. for , the density correlator takes the form:
| (3) |
with the NEP at and the critical amplitude. is a microscopic time of the order of sec. The so-called -correlator (or critical correlator) obeys the first scaling law:
| (4) |
with the correlation scale and the separation parameter , where . The -independent master functions are solutions of a certain scaling equation. The corresponding -relaxation time scale is given by:
| (5) |
For one obtains the following asymptotic power laws:
| (6) |
The critical law, upper equation of (6), holds above and below , whereas the von Schweidler law, lower equation of (6), is valid only above the transition point. Below , decays to a constant for . Both exponents and are related to the exponent parameter by:
| (7) |
with the Gamma function. From (7) one gets that and . is determined by the static correlators at . The result (3) which states that in the first scaling regime the - and -dependence factorizes is one of the most important predictions of the ideal MCT. Due to this factorization, Eq. (3) can easily be transformed to real space:
| (8) |
where , and are the Fourier transform of , and , respectively.
It is important to realize that the result (6) only holds asymptotically for . The next order correction to both of these asymptotic laws was recently derived and calculated for a system of hard spheres by Franosch et al. [25]. Corrections to the von Schweidler law [26]
| (9) |
have already been studied for hard spheres by Fuchs et al. [27]. There it was demonstrated that these corrections may be important. The expansion (9) is valid for , where the -relaxation time scale is given by
| (10) |
with
| (11) |
The translational diffusion constant is predicted to scale like . Therefore it is:
| (12) |
Corrections to the critical law lead to [25]:
| (13) |
In the second scaling regime, i.e. for of the order of , a master function exists such that
| (14) |
In glass science the result (14) is called time-temperature superposition principle. The expansion of the r.h.s. of (14) with respect to yields (9). Equation (14) represents the second scaling law.
Finally we mention that all these MCT-results hold for the self part of the density correlator as well.
III Model and details of the simulation
The model we investigate is a one-component system of rigid diatomic molecules. Each molecule is composed of two different Lennard-Jones particles, in the following denoted by and , which are separated by a distance and each of which has the same mass . The interaction between two molecules is given by the sum of the interaction between the four particles which is given by the Lennard-Jones potential where . The Lennard-Jones parameters are given by: , , and . In the following we will use reduced units and use as the unit of length, as the unit of energy (setting ) and as the unit of time. If the atoms are argon-like this time unit corresponds to approximately 0.3 ps.
In order to make the simulation more realistic we did it at constant external pressure =1.0. The length of the equilibration runs always exceeded the typical relaxation time of the system at the temperature considered, which allows us to conclude that in the subsequent production runs we were investigating the equilibrium dynamics of the system. The temperatures we investigated are , 3.0, 2.0, 1.4, 1.1, 0.85, 0.70, 0.632, 0.588, 0.549, 0.520, 0.500, 0.489 and 0.477. The total number of molecules was 500 and, in order to improve the statistics of the results, we averaged at each temperature over at least eight independent runs. For more details see [16].
IV Results
For a clearer presentation of our results, this section is divided into two subsections, where the first is devoted to the static and the second to the dynamical properties. The latter is divided into two parts again, which are real space and -space representation.
A Static properties
First of all we remark that thermodynamic quantities like, e.g. the average density and the enthalpy do not exhibit any signature of a singular behavior for the full temperature range , we have investigated. From this we conclude that the observed slowing down is probably not related to an approach of the system to a critical point of a second order phase transition.
The structural properties are one of the most interesting static features of a supercooled liquid. Figure 1 shows the static structure factor of the center of mass positions for different temperatures as a function of . Its -dependence has the typical behavior expected for a liquid, with a main peak at and a first minimum at for the lowest temperature. With increasing temperature the peak positions shift to smaller values, due to an increase of the average distance between the molecular centers, and the peaks become broader.
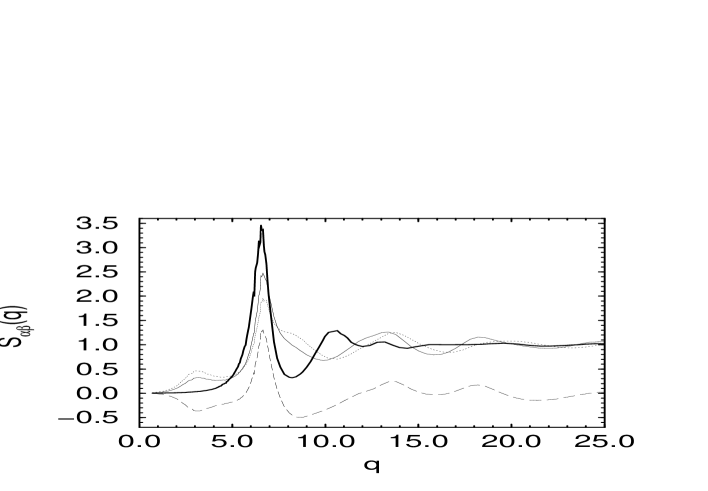
A comparison of for with the partial structure factors , where refers to atom and atom , is given in Fig. 2. Whereas the main peak in and is essentially at the same position, the remaining -dependence is quite different for the various correlators. For the pre-peak of and at , which could indicate a “medium” range order, we have not found a conclusive interpretation. Concerning the microscopic structural properties it is more convenient to consider the atomic radial pair distribution functions and the corresponding function for the center of mass positions, which are shown in Figs. 3 and 4, respectively. There is no significant difference between the probably due to the fact that the choice of our model parameters [16] does not introduce a strong asymmetry between particles of type and particles of type . Besides a first and a splitted second nearest neighbor peak at about and , , respectively (Fig. 3), an intermediate peak occurs at . The peak at is also found for , but its main peak is at (cf. Fig. 4). The peaks in at and are missing for . The splitted first nearest neighbor peak of can be attributed to cross- and T-configurations, as also found for other molecular liquids (see e.g. [28]). We do not dwell more on these results, since our main concern are the dynamical features in the strongly supercooled regime. The main reason we have presented is to compare its -dependence with the static correlation functions of the orientational correlators presented in part II. We already anticipate that this -dependence can be rather different for the various correlators.
B Dynamical properties: real space
To start we discuss the self motion of a molecule. One of the important transport coefficient is the translational diffusion constant which is obtained from the mean squared displacement by:
| (15) |
where is the number of molecules. The temperature-dependence of is presented in Fig. 5 on a double-logarithmic scale. The diffusion constant follows a power law, as predicted by ideal MCT [cf. Eq. (12)], over a surprisingly large range of four decades in . As critical temperature we obtain and for the corresponding exponent . With use of Eqs. (7) and (11), this yields the von Schweidler exponent , the critical exponent and the exponent parameter . At the two lowest temperatures the deviations of the numerical values for from the power law, which has been mentioned in the Introduction, can clearly be seen. The inset of Fig. 5 depicts the time dependence of the mean squared displacement for all temperatures, from which was deduced.
More information on the self motion is contained in the self part of the van Hove correlator:
| (16) |
The -dependence of is shown in Fig. 6 for times which are equidistant on a logarithmic time axis and for the lowest temperature. With time, the -peak at broadens and for and , i.e. in the hydrodynamic limit, it approaches a Gaussian distribution:
| (17) |
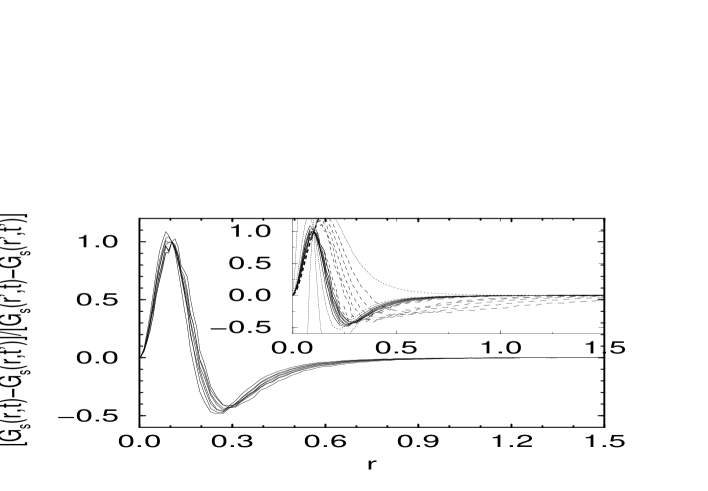
In the time span , where the mean squared displacement for the lowest temperature exhibits a plateau (cf. the inset of Fig. 5), the -dependence of varies only weakly with time, which indicates the validity of the factorization [Eq. (8)]. To check this, we have plotted in Fig. 7 as a function of for fixed and and various -values. If Eq. (8) is valid, this ratio must be independent of and . For the times and we have chosen in Fig. 7, this is indeed reasonably fulfilled. That this is not true for the full time span, can be inferred from the inset of Fig. 7.
Another interesting conclusion can be drawn from the -dependence of for the largest time. As can be seen from Fig. 6, at no time there is any indication for the presence of a secondary peak at , the nearest neighbor distance. From the absence of such a peak it is usually concluded, see e.g. Ref. [29], that no hopping processes are present. But for the present system we have strong evidence, see Fig. 5, that at the lowest temperature hopping processes are indeed present. Thus we conclude that hopping processes do not necessarily lead to a secondary peak in .
The -dependence of is not Gaussian for a large time regime. The deviation from a Gaussian can be quantified by the non-Gaussian parameters [30]. Fig. 8 shows
| (18) |
In case of a Gaussian process vanishes. For and goes to zero. But in between there exists a time regime for all temperatures where is substantially different from zero. The increasing part of seems to fall onto a master curve, as already found earlier [13, 29]. The time , where obtains its maximum, obeys a power law (see inset of Fig. 8) with which coincides with , derived from , in agreement with the results of Sciortino et al. [13]. This suggests that for is determined by the -relaxation as it follows from ideal MCT. Exactly the same conclusions also hold for .
The collective dynamics can be studied by use of the distinct part of the van Hove correlator
| (19) |
which is shown in Fig. 9 for various times and again for the lowest temperature. Its - and -dependence is quite similar to that found for a binary liquid [29]. The test of the factorization [Eq. (8)] can be done as for the self part. The corresponding ratio is presented in Fig. 10 for the same time regime as in Fig. 7. Again a reasonable collapse onto one master curve occurs, in agreement with ideal MCT.
C Dynamical properties: -space
Although the visualization of local structural properties favors the use of a real space representation of the correlators, most experimental results are obtained in -space. In addition the translational invariance of the interactions also suggests a theoretical description by use of -dependent correlators. For instance the memory part of the MCT-equation for the density correlator is “diagonal” in -space but involves a convolution in real space.
Let us start with the self part of the collective density correlator [cf. Eq. (1)], which is presented in Fig. 11 for , the position of the main peak in (cf. Fig. 1). We remind the reader that is measured in units of , the position of the Lennard-Jones minimum for the -particles. The small bump in at , which is also present in (cf. Fig. 14 and 15), is due to a sound wave and is the time for the sound wave to traverse the box size of our sample. This effect was also observed by Lewis et al. [10] and has recently been shown to be much more pronounced in strong glass formers [31].
For the highest temperature, , the decay of is essentially exponential. With decreasing temperature the relaxation crosses over into a two-step process, as predicted by MCT. For the lowest temperature, , a “quasi-plateau” can be seen. Its height is a measure of the critical NEP . The reader should note that decays to zero for large times, indicating that the length of the runs is large enough to equilibrate the system. In order to test MCT, we have determined the -relaxation times from the condition . Its temperature dependence is shown in Fig. 12 (squares) for and . Using = 0.475, as determined from , both relaxation times follow a power law over about three decades. The corresponding -values are practically the same , but differ significantly from . Such a discrepancy between and has been observed already before [29] and indicates that the MCT prediction, that the two exponents should be equal, is not valid for these systems. yields the von Schweidler exponent and the exponent parameter . We also note that a power law fit with as a free parameter yields a value for which coincides with to within .
The relaxation time can now be used to rescale time in order to test the time-temperature superposition principle [Eq. (14)], which is done in Fig. 11b. We find that the relaxation curves fall indeed onto one master curve for the lowest temperatures. The late stage relaxation can be fitted well by a Kohlrausch-Williams-Watts-law (KWW), i.e. , dashed curve. For higher temperatures (cf. e.g. the curve for ) no such scaling exists. We also note that such a scaling was not possible for certain types of orientational correlation functions [16], which shows that this prediction of MCT is not a trivial one.
Having demonstrated the validity of the second scaling law [Eq. (14)], we can test whether the von Schweidler law, including the next order correction [Eq. (9)] fits the master curve well in the late -relaxation regime. As can be seen from Fig. 11b this type of fit works very well (dotted line). In practice, this has been done for at the lowest temperature by using (deduced from ). The wave vector dependence of , and is shown in Fig. 13. Here a comment is in order. The fit of the data with the von Schweidler law including the next order correction yields and [cf. Eq. (9)]. Since the -independent -relaxation time scale can only be determined up to a -independent factor, the same is true for and . In Fig. 13 we therefore show and . The -variation of these quantities is quite similar to that for hard spheres [27]. Particularly we also find a zero of at a finite q-value with for . Taking into account that for the hard sphere system is given in units of the diameter , we can deduce from Ref. [27]. That this is about three times larger than our value, is partly due to a larger effective diameter of our molecules, compared to .
We now turn to the collective dynamics as obtained from the density correlator , which is presented, respectively, for and in Figs. 14a and 14b. The time-dependence looks similar to that of , but the height of the “quasi-plateau” is much lower and the stretching of the relaxation is more pronounced for the case of . The -relaxation time has been determined from the condition , since using the definition of would lead to an underestimation of the –relaxation time for , since the plateau is so low. (We note that choosing instead of , for the case where both definitions can be used, or even using a KWW-fit to deduce , leads to essentially the same temperature-dependence). The temperature dependence of is shown in Fig. 12. Taking again = 0.475 as given, obeys a power law, with and . It is remarkable that the range for the power law for is almost one decade less than for , which shows that different correlators reach the asymptotic regime at different temperatures.
Fig. 15 shows that also for these correlation functions the second scaling law holds and that it holds better for than for . The late stage relaxation can again be fitted well by a KWW-law (dashed line). Since the curves for the different temperatures fall onto a master curve, it is sufficient to focus on the curve for the lowest temperature in order to test whether the first scaling law holds. The results of our analysis are shown in Fig. 16 and 17 for and , respectively. Let us discuss first. As can be seen from Fig. 16, the von Schweidler law, with , the same value we used to fit the von Schweidler law to , fits the data over about 2.5 decades in time (long dashed line). Taking into account the next order correction (cf. Eq. 9) leads to a significant improvement of the fit for (solid line). We have also fitted the numerical data with the -correlator with (dotted line) and without (short dashed line) correction. This was done by solving the equation for (see Ref. [5]) and making use of Eqs. (3) and (4). Here we encounter the same problem as we did for the fit with the von Schweidler law, because the -relaxation time can only be determined up to a -independent factor. In order to proceed we have chosen for the position of the inflection point of , indicated in Fig. 16 by a filled circle. The optimum values and stemming from that fit were used for the similar fit of all the other correlators of the present paper and of Ref. [18], except for the orientational correlators with [18]. From the figure we recognize that in the late -relaxation regime these fits are identical to the ones of the von Schweidler law, as it should be. In the early -relaxation regime, however, the -correlator fits the data much better than the von Schweidler law, since part of the approach to the plateau is fitted well also. Nevertheless, the critical law is not really observed, even if one includes the corrections to it [cf. Eq. (13)].
For it is not possible to obtain a good fit with the von Schweidler law alone, if is kept fixed at 0.55. If is used as a free parameter, a satisfactory fit is obtained but at the cost of a -dependent von Schweidler exponent , in contradiction to MCT. Since the critical NEP obtained from this fit were rather structureless and did not qualitatively agree with the NEP obtained from solving the molecular MCT-equations [22], we decided to keep = 0.55 (obtained from ) fixed and to take the next order correction into account. With this approach we obtained good agreement between all NEP from our MD-simulation and those from the MCT-equations [22]. But even if the first correction to the von Schweidler law (cf. Eq. 9) is taken into account, the fit with Eq. 9 works well for only about one decade in time. On the other hand, the critical correlator (with ) including the correction (on the von Schweidler side) fits the data over two decades. Nevertheless, this range is significantly smaller than the one found for which shows that corrections to the scaling laws might be more important for than for .
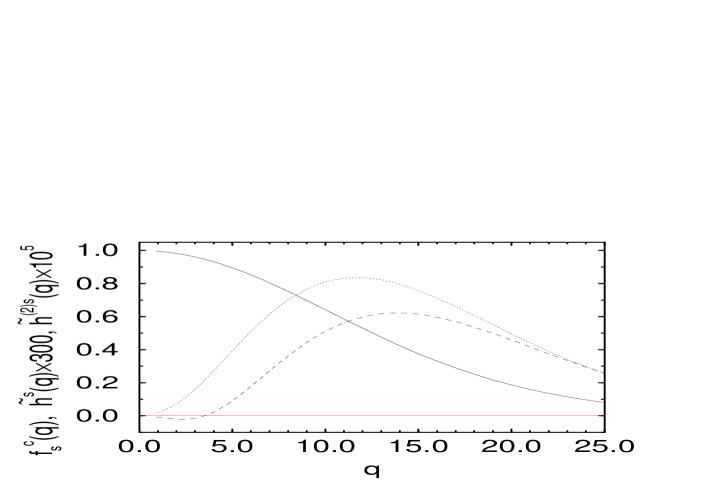
The quantities , and , depicted in Fig. 18 were determined in a similar way as for the self part, i.e. by keeping the value of fixed to 0.55. Comparing these quantities with (Fig. 1) we find that is in phase and both, and in anti-phase with . We note that the peak at in does not exist for . However, whether this peak is real or just a statistical fluctuation can presently not be decided for sure. Since the static correlator has a pronounced maximum at (see Ref. [18]), one might be tempted to relate this prepeak of to the translation-rotation coupling.
The variation of and with resembles the one found, e.g., for hard spheres [27], for a binary liquid [29, 32] and that for water molecules [33]. Interestingly the -dependence of , which is in phase with that of , qualitatively agrees with that found by Fuchs et al. for hard spheres [27]. However, in contrast to the hard sphere system, does not change sign for the -regime we have studied, but vanishes at at which it has a minimum. This fact explains why the (asymptotic) von Schweidler law fits the data rather well for , where , but not for . To conclude we show in Fig. 19 that also the variation of the -relaxation time with is in phase with , which is in close analogy with, e.g., the hard sphere system [27].
V Discussion and conclusions
In this paper we have performed a detailed test of the predictions of ideal MCT (for simple liquids) for the translational degrees of freedom (TDOF) for a supercooled liquid of rigid diatomic molecules without head-tail symmetry. The Lennard-Jones interactions we used for the molecular system are not so different from those of the binary liquid [29] with A- and B-atoms. The main difference between both systems of course is, that for the present case the A- and B-atoms are pairwise connected in order to form diatomic molecules. Therefore the comparison of the dynamical behavior of both systems, allows to discuss the influence of the orientational degrees of freedom (ODOF) on TDOF.
Our test was mainly concerned with (i) the existence of a single critical temperature and (ii) the validity of the two scaling laws of ideal MCT. This single critical temperature indicates a strong coupling between TDOF and ODOF. Although the mathematical structure of the MCT-equations for molecular liquids [19, 20, 21, 22] differs from the one of simple liquids, we expect that the two scaling laws hold for molecular liquids, too. This belief is based upon the fact that the first scaling law is always valid in a so-called type B transition (i.e. the NEP changes discontinuously at the transition), the type of transition that is relevant for structural glasses [5]. Furthermore the existence of a single transition temperature for linear and arbitrary molecules without additional symmetry can also be proved for the molecular MCT-equation [34].
Taking and as free parameters, the -relaxation times and for and can be fitted with a power law. The resulting ’s differ from = 0.475 (deduced from ) by less than . The same value of was found for the orientational correlation functions in Ref. [16] and we therefore conclude that our data is compatible with the existence of a single transition temperature. The sharp transition at , as predicted by ideal MCT, is however smeared out, due to ergodicity restoring processes which can be accounted for by the extended MCT [17]. These processes are often associated with a hopping of the atoms or molecules, as it has been demonstrated for a binary liquid [35]. An evidence for such hopping processes is the occurrence of a second peak in at for large times [35]. But no such peak is observed in our results, even beyond the -range shown in Fig. 6. The absence of hopping processes with respect to the TDOF was also found in the MD-simulation of CKN [8]. Therefore only orientational jumps remain, which indeed have been shown to be present [16]. Comparing the different values of , one finds that those determined from and fluctuate around 2.55. The same is more or less true for the purely orientational correlators and [17] for , but not for where and was found. This result demonstrates that, contrary to the prediction of ideal MCT, is not a “universal” exponent for our system. Such a conclusion was already drawn for binary liquids [29]. We note however, that this discrepancy does not seem to exist for the MD-simulation of water [13].
For all the correlators related to the TDOF, the second scaling law is reasonably well fulfilled. This is in contrast to our findings for and [16]. Only for relatively large values of do the show the second scaling law.
Regarding the first scaling law we can say that it works well for and . For we have demonstrated that the next correction to the von Schweidler law becomes important. We stress that a consistent description of our data in the framework of MCT is only possible by taking this correction into account. If this is not done, a -dependent von Schweidler exponent and a rather structureless -variation of the orientational NEP (which will be discussed in the following paper [18]) results. The critical law is not observed for any of the correlators, even if the next correction is taken into account. This is probably due to a strong interference of the critical dynamics with the microscopic motion.
In summary, we conclude that, with respect to ideal MCT, the TDOF of our molecular system behave quite similar as found for a binary liquid [29]. Hence, the qualitative features of the dynamics of TDOF is not altered by its coupling to ODOF. Although a single transition temperature for TDOF and ODOF can be specified, part of the orientational dynamics as measured, e.g. by , does not fit into the framework of ideal MCT [16]. Whether this is only due to the -reorientational jumps [16], is presently not clear.
Acknowledgements: We thank the DFG, through SFB 262, for financial support. Part of this work was done on the computer facilities of the Regionales Rechenzentrum Kaiserslautern.
REFERENCES
- [1] J. Jäckle, Rep. Prog. Phys. 49, 171 (1986); J. P. Sethna, J. D. Shore and M. Huang, Phys. Rev. B44, 4943 (1991); S. A. Kivelson, X. Zhao, D. Kivelson, T. M. Fischer and C. M. Knobler, J. Chem. Phys 101, 2391 (1994); D. Kivelson, S. A. Kivelson, X. Zhao, Z. Nussinov and G. Tarjus, Physica A 219, 27 (1995).
- [2] U. Bengtzelius, W. Götze and A. Sjölander, J. Phys. C 17, 5915 (1984).
- [3] E. Leutheusser, Phys. Rev. A 29, 2765 (1984).
- [4] W. Götze and L. Sjögren, Rep. Prog. Phys. 55, 241 (1992).
- [5] W. Götze in Liquids, freezing and the glass transition, Eds. J. P. Hansen, D. Levesque and J. Zinn-Justin (North-Holland, Amsterdam, 1991); R. Schilling in “Disorder Effects on Relaxation Processes”, Eds. R. Richert and A. Blumen (Springer, Berlin, 1994); Theme Issue on Relaxation Kinetics in Supercooled Liquids-Mode Coupling Theory and its Experimental Tests, Ed. S. Yip, Volume 24, No. 6-8 (1995) of Transport Theory and Statistical Physics; W. Kob, p. 28 in Experimental and Theoretical Approaches to Supercooled Liquids: Advances and Novel Applications, Eds.: J. Fourkas, D. Kivelson, U. Mohanty, and K. Nelson (ACS Books, Washington, 1997).
- [6] P. Lunkenheimer, A. Pimenow, B. Schiener, R. Böhmer and A. Loidl, Europhys. Lett. 33, 611 (1996); P. Lunkenheimer, A. Pimenow, M. Dressel, Y. G. Gonchunov, R. Böhmer and A. Loidl, Phys. Rev. Lett. 77, 318 (1996); P. Lunkenheimer, A. Pimenow, M. Dressel, Y. G. Gonchunov, U. Schneider, B. Schiener R. Böhmer and A. Loidl, Proc. MRS Fall Meeting, Boston 1996.
- [7] H. Z. Cummins, G. Li, W. Du, R. Pick, and C. Dreyfus, Phys. Rev. E 53, 896 (1996).
- [8] G. F. Signorini, J.-L. Barrat and M. L. Klein, J. Chem. Phys. 92, 1294 (1990).
- [9] P. Sindzingre, M. L. Klein, J. Chem. Phys. 96, 4681 (1992).
- [10] L. J. Lewis and G. Wahnström, Phys. Rev E 50, 3865 (1994).
- [11] G. Wahnström and L. J. Lewis, Prog. Theor. Phys. (in press).
- [12] S. R. Kudchadkar and J. M. Wiest, J. Chem. Phys. 103, 8566 (1995).
- [13] P. Gallo, F. Sciortino, P. Tartaglia and S.-H. Chen, Phys. Rev. Lett. 76, 2730 (1996); F. Sciortino, P. Gallo, P. Tartaglia and S. H. Chen, Phys. Rev. E 54, 6331 (1996).
- [14] F. Sciortino, P. Tartaglia and P. Gallo, Proc. MRS Fall Meeting, Boston 1996.
- [15] W. J. Ma and S. K. Lai, Phys. Rev. E 55, 2026 (1997).
- [16] S. Kämmerer, W. Kob and R. Schilling, Phys. Rev. E 56, xxxx (1997).
- [17] W. Götze and L. Sjögren, Z. Phys. B 65, 415 (1987).
- [18] S. Kämmerer, W. Kob and R. Schilling (following paper).
- [19] T. Franosch, F. Fuchs, W. Götze, M. R. Mayr and A. P. Singh (unpublished).
- [20] R. Schmitz (unpublished).
- [21] T. Scheidsteger and R. Schilling, 6. Int. Workshop on Disordered Systems, 1997; R. Schilling and T. Scheidsteger, Phys. Rev. E (in press).
- [22] C. Theis, Diploma thesis, Johannes Gutenberg-Universität (1997).
- [23] S. P. Das and G. F. Mazenko, Phys. Rev. A 34, 2265 (1986).
- [24] R. Schmitz, J. W. Dufty and P. De, Phys. Rev. Lett. 71, 2066 (1993).
- [25] T. Franosch, M. Fuchs, W. Götze, M. R. Mayr and A. P. Singh, Phys. Rev. E 55, xxxx, (1997).
- [26] W. Götze in Amorphous and Liquid Materials, Ed. E. Lüscher (Nijhoff, Dordrecht, 1987).
- [27] M. Fuchs, I. Hofacker and A. Latz, Phys. Rev. A 45, 898 (1992).
- [28] J. P. Hansen and I. R. McDonald, ”Theory of simple liquids”, 2nd edn., (Academic Press, London, 1986); W. B. Street, D. J. Tildesley, Proc. R. Soc. Lond. A. 348, 485 (1976) and 355, 239 (1977).
- [29] W. Kob and H. C. Andersen, Phys. Rev. E 51, 4626 (1995); ibid. 52, 4134 (1995).
- [30] A. Rahman, Phys. Rev. 136, A 405 (1964); J. P. Boon and S. Yip, “Molecular Hydrodynamics” (Dover, New York, 1980).
- [31] J. Horbach, W. Kob, K. Binder and C.A. Angell, Phys. Rev. E. 54, R5897 (1996).
- [32] M. Nauroth and W. Kob, Phys. Rev. E 55, 657 (1997).
- [33] F. Sciortiono, private communication.
- [34] R. Schilling (unpublished).
- [35] J.-L. Barrat, J.-N. Roux and J.-P. Hansen, Chem. Phys. 149, 197 (1990).


![[Uncaptioned image]](/html/cond-mat/9710021/assets/x11.png)


![[Uncaptioned image]](/html/cond-mat/9710021/assets/x15.png)

![[Uncaptioned image]](/html/cond-mat/9710021/assets/x17.png)


