[
Geometric contribution to the measurement of thermoelectric power and Nernst coefficient in a strong magnetic field
Abstract
On the measurement of thermoelectric power and Nernst coefficient, we used two kinds of shapes for a sample. One is “Bridge shape” and the other is, we call,“Fat-Bridge shape”. The latter has 5 times wider main body than the former. We used pure n-InSb in this experiment, whose carrier condensation measured at 77K was The length of sample is 17mm and temperature difference induced between the edges in that direction were about C or C near a room temperature range of 0 to C. Magnetic induction applied in the perpendicular direction to temperature gradient was in the range of 0 up to 4 Tesla. In the case of “Fat-Bridge shape”, we detected about 10% smaller Nernst coefficient and 1 to 10% smaller thermoelectric power comparing to the “Bridge shape”. We suppose this phenomena is due to the geometric contribution on the different shape of samples.
]
I Introduction
We call some semiconductors Nernst element [1, 2], which will be able to use for the generation of electric power by applying the Nernst effect. As the fundamental study for the power generation by the Nernst elements, we are studying for the transport properties of its candidates in a magnetic field [3, 4]. By measuring their transport coefficients, we will be able to estimate the efficiency of energy conversion.
II Experiment
The thermoelectric effect and the Nernst effect can be written respectively in the form,
| (1) | |||||
| (2) |
where is electric field, thermoelectric power, temperature, Nernst coefficient and magnetic induction.
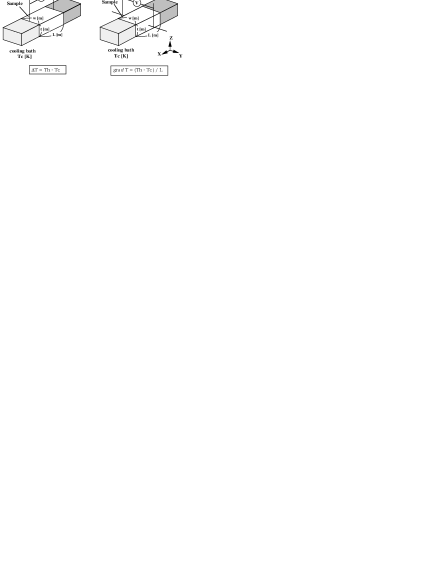
Suppose a sample is rectangular parallelepiped and its scale is of length width thickness then a temperature gradient is given in the direction of That scheme is indicated to FIG. 1.
We can obtain the thermoelectric power by detecting the potential difference and temperature difference between edges in the direction of and the Nernst coefficient by temperature gradient and the magnetic induction applied in the perpendicular direction to temperature gradient and potential difference in the perpendicular direction to both temperature gradient and magnetic induction. They were calculated from eqs.(1) and (2) as follows:
| (3) | |||||
| (4) |
Using eqs.(3) and (4), we obtain the following relation:
| (5) | |||||
| (6) |
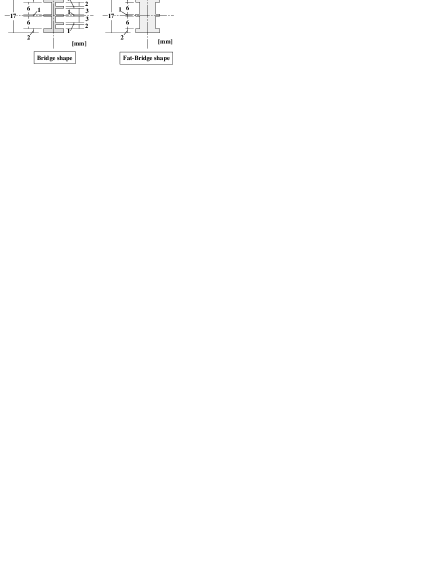
On this measurement, it is very important that we used two kinds of the shapes for a sample. They are indicated to FIG. 2. One is called “Bridge shape”, that has narrow main body, several legs for measuring leads and wide heads on the edges for having good attachments to heating or cooling bath. We call the other “Fat-Bridge shape”, that has 5 times wider body than Bridge one. The samples were cut out from thin wafers at accuracy of about 0.1mm by wire cutter. We measured their scale at precision of within 0.005mm by micrometer. These samples were located on the sample holder as is indicated to FIG. 3.
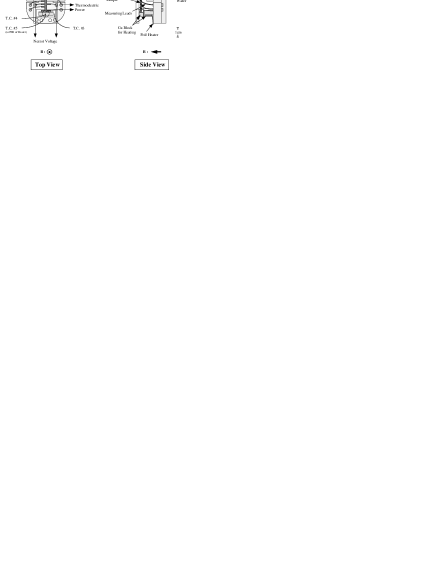
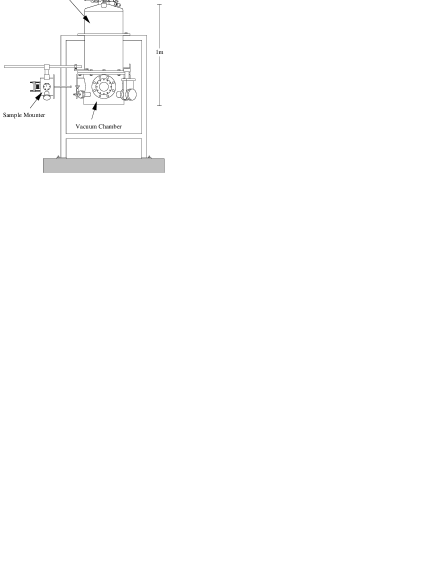
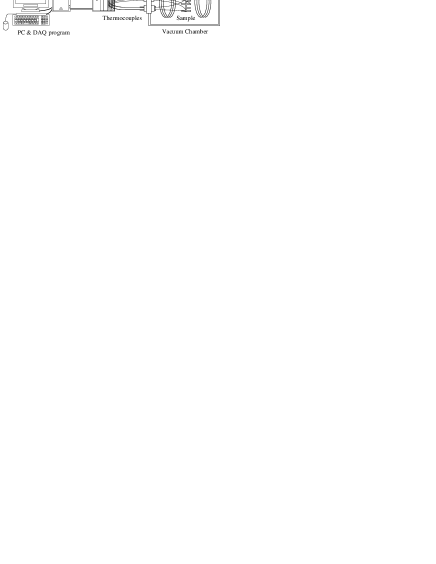
When we make the temperature gradient in the samples, temperatures are controlled by two Cu blocks attached to the edges of sample. One is heated up to about C by foil heater and the other is cooled down to about C by the unfrozen liquid mixed water and ethylene glycol. Temperatures were measured by Chromel-Almuel thermocouples. Measuring leads for voltage signals are 0.5mm diameter wires of the Cu which were welded to sample. We had the experiment around room temperatures and on the two kinds of temperature conditions. On one condition, the temperature difference of between sample edges is C, and temperature of cold side is increased 0 up to C by C. On the other condition, the cold side is fixed to C and hot side is C. Experimental equipments are indicated to FIG. 4. By using the superconducting magnet coil which is included into the cryostat, magnetic field of 0 to 4 Tesla is generated in the central region of vacuum chamber. The region of 20mm cube in the central part of the chamber is stable within 0.2% to the magnetic field strength of central point. We had measurements of physical properties in that region. Inner pressure of chamber was less than Pa.
Physical phenomena of temperature and electric field are transduced to voltage signals by thermocouples and leads. As is indicated to FIG. 5, transduced voltage signals are inputted to isolation amplifiers. Then, amplified signals are sent to 16bit A/D converter plugged into a personal computer and are digitized. The maximum gain of the Amplifier is 2000. We can detect voltage signals in the resolution of 0.15V at maximum. On this measurement, the precision of the temperature measurement were less than 0.1K and the relative error of the voltage measurement were not exceed 0.5%.
III Data analysis and discussion
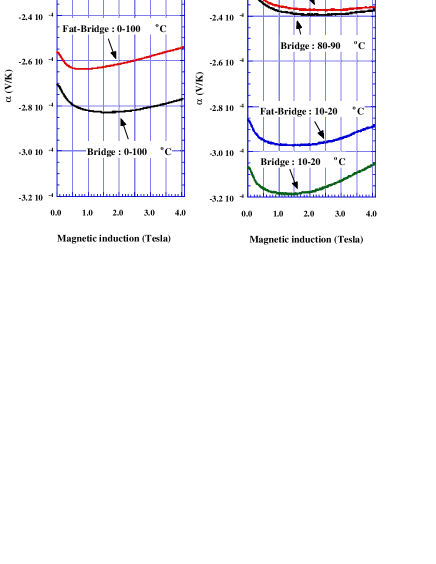
Figures 6 and 7 show the dependence of thermoelectric power and Nernst coefficient on magnetic induction respectively. They include data on the conditions that the temperature pairs of heating block and cooling one are set on 0 and C, 10 and C and 80 and C. In FIG. 6, we used
| (7) |
as substitute for Nernst coefficient.
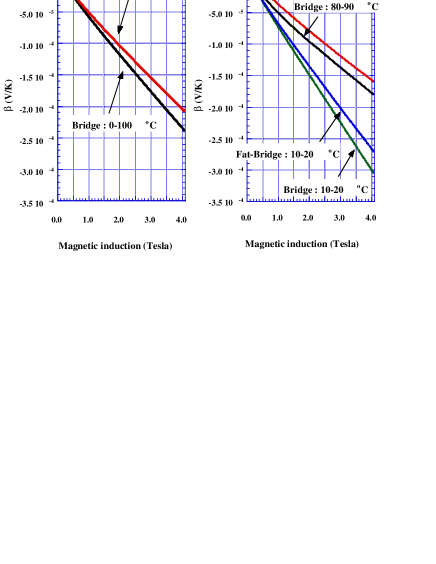
In very weak and strong magnetic fields, was linearly decreasing or decreasing with the increase of field strength. It means that Nernst coefficient is nearly constant in their regions. In intermediate fields, there is a transition of from one constant value to another. Especially in the case of C, the sign of coefficient changed. Except in weak field of the case of C, the sign of Nernst coefficients was negative on this experiment. These results have qualitative agreements with the investigation of up to 2 Tesla reported in Ref. [5]. But we detected the qualitative difference when the shapes of samples were different. At 4 Tesla, Nernst coefficients measured on the Fat-Bridge shape were about 12% smaller than those on the Bridge shape in all cases and that tendencies are similar in strong fields. In the measurement of thermoelectric powers, the any values on the Fat-Bridge shape was smaller than that on the Bridge shape. But the rate of its reduction were about 8%, 5% and less than 1% in the case of C, C, C respectively.
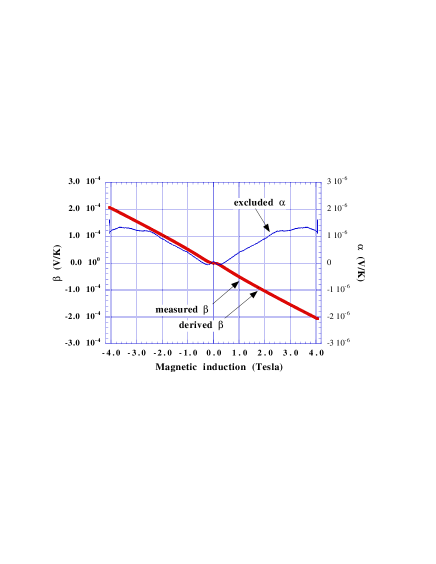
We suppose that the detected differences are apparently and due to the difference of samples’ shape. We call it geometric contribution. To interpret this contribution and the inner state of the samples, more detailed analysis and the theoretical investigation will be proceeded in near future. Figure 8 shows the dependence of thermoelectric power on the applied direction of magnetic induction, which obtained on the measurement of “Fat Bridge shape” in C. The sign of magnetic induction appears the applied direction of that. Figure 8 includes the measured data, the analytically derived component and the analytically excluded one. Measured data was not symmetric to the direction of magnetic induction. We suppose this is due to the reason that the positions of measuring leads had the difference in the perpendicular direction to heat flux and Nernst effect was detected slightly. That component is indicated as the excluded in FIG. 8. Because of the similar mechanism, thermoelectric effect was detected on the measurement of Nernst effect. That appeared as offset voltages on the measurement apparently. They are indicated in the FIG. 9, which obtained on the measurement of “Fat Bridge shape” in C. These phenomena are detected on all our measurements.
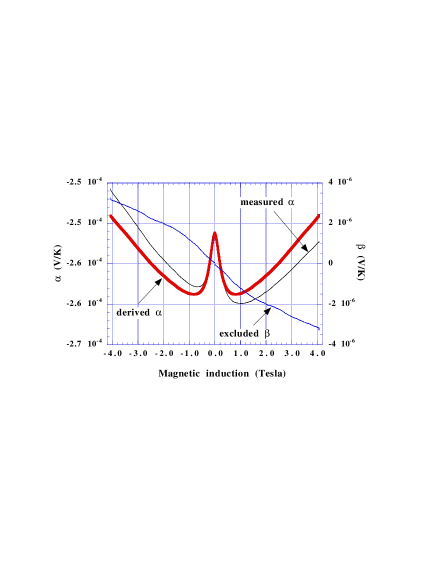
To excluded the contaminated components on the measured data, we calculate and as follows:
| (8) | |||||
| (9) |
The propriety of these processes are due to the properties that thermoelectric effect is even to the direction of magnetic induction and Nernst effect is odd.
IV Conclusion
When the magnetic field is applied to the semiconductor in which heat flux exist, two components of electric fields are generated inside of it. One is in the origin of thermoelectric effect and the other is Nernst effect. The mixture of these two effects generate the geometric contributions on the measurement of physical properties as we detected on this measurement using “Bridge shape” and “Fat-Bridge shape”. This condition is similar to the measurement of the Hall effect [6, 7]. When we confirm the physical properties by the measurement, the geometric contributions must be considered. We shall need to develop the calculation code to interpret the transport properties including the heat and current fluxes in more details and self-consistently.
Acknowledgements.
The authors are grateful to Mr. Nishimura in Nishimura factory corporation for the process of samples and Dr. Tatsumi in Sumitomo Electric Industries for providing semiconductors and Prof. Kuroda in Nagoya university for many useful supports. We appreciate Prof. Iiyoshi and Prof. Motojima in the National Institute for Fusion Science for their helpful comments.REFERENCES
- [1] S. Yamaguchi, A. Iiyoshi, O. Motojima, M. Okamoto, S. Sudo, M. Ohnishi, M. Onozuka and C. Uesono, “Direct Energy Conversion of Radiation Energy in Fusion Energy”, Proc. of 7th Int. Conf. Merging Nucl. Energy Systems (ICENES), (1994) 502.
- [2] S. Yamaguchi, K. Ikeda, H. Nakamura and K. Kuroda, “A Nuclear Fusion Study of Thermoelectric Conversion in Magnetic field”, 4th Int. Sympo. on Fusion Nuclear Tech., ND-P25, Tokyo, Japan, April (1997).
- [3] K. Ikeda, H. Nakamura, S. Yamaguchi and K. Kuroda, J. Adv. Sci., 8, 147 (1996), (in Japanese).
- [4] H. Nakamura, K. Ikeda, S. Yamaguchi and K. Kuroda, J. Adv. Sci., 8, 153 (1996), (in Japanese).
- [5] Ya. Agaev, O. Mosanov, and O. Ismailov, Sov. Phys. Semicond., 1, 711 (1967).
- [6] H. Welker and H. Weiss, Z. Phys. 138, 322 (1954).
- [7] H. Weiss,”Semiconductors and Semimetals 1”, Academic, New York (1966).