Electronic Raman Scattering in Nearly Antiferromagnetic Fermi Liquids
It is widely believed that strong antiferromagnetic correlations are an important ingredient needed to describe the unusual properties found in the normal state of the cuprate superconductors. A phenomenologically based theory proposed by Millis, Monien, and Pines[1] supposes that the electronic system interacts with an independent model spin fluctuation spectrum. This nearly antiferromagnetic Fermi liquid (NAFL) model has been applied to study both spin and charge correlation properties[2]. Of the latter, recently Pines and Stojkovic have investigated the two-particle correlation function in a perturbation approach yielding the optical conductivity response[3]. In this paper we extend their results to investigate the two-particle Raman response.
The salient point of the calculation starts with assuming a form for the quasiparticle-quasiparticle interaction:
| (1) |
which at lowest order in the coupling constant yields for the self energy
| (2) |
with the bare Green’s function. Here and are the phenomenological, temperature dependent spin fluctuation energy scale and the correlation length, respectively, which can be determined via fits to the magnetic response data[2]. These functional parameters obey certain relations depending on different temperature and doping regimes. In the or pseudo-scaling regime, the spin correlations are strong enough to lead to changes from the classical mean field theory regime. As has been pointed out in [2], the regime is most appropriate to optimally doped cuprates at intermediate temperatures while applies to optimally doped materials at higher temperatures and/or more overdoped materials. For the scaling regime, constant while for , constant. Once the self energy is determined, in the absence of vertex corrections to the Raman vertex , the Raman response is simply given by
| (3) | |||
| (4) |
with and band structure . As in Ref. [3], we use the following approximations: (i) we neglect the real part of the self energy given in (2), (ii) we only use the Green’s function evaluated at lowest order in the coupling constant , (iii) we neglect all vertex corrections for the Raman vertex, (iv) momentum sums are replaced by . While (iv) does not crucially affect the results, approximations (i-iii) while simplifying the calculations considerably miss important quasiparticle renormalizations at larger values of the coupling. Therefore we expect that these calculations would be most appropriate to describe the spectra taken on overdoped cuprate superconductors. We believe that these approximations must be lifted in order to describe optimally and underdoped cuprate systems. This is analyzed in detail in a forthcoming publication[4].
The parameters we have used for both scaling regimes are eV, states/eV, meV, , filling , , . In addition, for the scaling regime we have used meV and , while for , meV and . These parameters are similar to those used in Ref. [5] to describe the Hall conductivity data in YBa2Cu3O7. For very small incoming laser frequencies, the Raman vertices can be written in terms of the curvature of the electron bands. However, it has been pointed out[6] that this is of questionable use for the cuprates and therefore we have used the first order terms of a Brillouin zone expansion for the vertices. Therefore the magnitude for the scattering is arbitrary and determined by the dimensionless coefficients , which are set by fitting to the data. This has no effect on the frequency dependent lineshapes however.
Our results are summarized in Figure 1, where we have plotted the and Raman response for both scaling regimes. The response is slightly more complicated due to screening effects and is discussed in detail in Ref. [4]. The spectra for both scaling regimes share several features. First, one immediately sees that the flat continuum at high frequencies which is present in the Raman data from all cuprate superconductors as well as several A-15 compounds is reproduced by the theory. This is a consequence of a scattering rate which is effectively linearly dependent on at frequency scales larger than . Moreover, the Raman response is different for the different scattering geometries. This is due to the strong anisotropy of the scattering rate for different directions in momentum space. In the NAFL model, the quasiparticle scattering is strongest near “hot spots”, i.e. regions of the Fermi surface which can be connected by the antiferromagnetic wave-vector . Since these regions are close to the zone axes for the given band structure, this means that the geometry most effectively probes these hot spots while the geometry probes along the zone diagonals and therefore sees “colder” quasiparticles. Thus the “peak” of the spectra is located at larger frequencies for the channel compared to reflecting the larger energy scale. Lastly, the coupling constant controls the position and character of the peak in each scattering geometry: for smaller couplings, the peak is more pronounced and is shifted to lower frequencies, while for larger couplings the peak is smeared out and pushed to larger frequencies.

We next discuss the results for the different scaling regimes. For these parameter choices the differences between the two regimes are mostly quantitative. In general the results are more strongly temperature dependent than the results for . This is most clearly seen in the high frequency portion of each spectra and is due to the weaker temperature dependence of for scaling than for scaling. In addition the results show stronger differences between the results for the and channels than those from . The spectra for both and as well as the spectra for show a monotonically decreasing intensity as the temperature is increased as spectral weight is being transfered to high frequencies. However, the spectra for show that the low frequency portion decreases with the temperature but the high frequency portion increases with temperature. Therefore the spectral weight is being transfered out to only slightly higher frequencies. This may be due to the more pronounced “hot spots” in the regime compared to the more smeared “hot spots” for [2]. The channel thus is more sensitive to the growth of the correlation length as temperature is lowered than .
As a consequence, the Raman spectra are quite sensitive to the details of the parameter choices and therefore the shape of the Raman spectra can be a very useful tool to understand and probe the anisotropic quasiparticle scattering rates in much the same way as it has been used to probe the anisotropy of the energy gap in the superconducting state[7].

We now turn our attention to the comparison of the theory to the experimental data on the cuprates. As we remarked, the approximations used in this paper are most appropriate for systems with weak spin fluctuation scattering, and therefore we expect that our results would best represent the data from appreciably overdoped cuprate superconductors. Thus we consider the results from scaling regime in closer detail.
As discussed in Ref. [7], it is believed that the quasiparticles in the overdoped cuprates feel an effectively stronger impurity interaction coming from the increased effective dimensionality of the system which allows the quasiparticles to interact more strongly with defects residing out of the CuO2 plane. Therefore in addition we will consider an isotropic impurity interaction where denotes the position of the impurity labeled by and is the impurity potential. After averaging over the position of the impurities, this adds a momentum independent term to the imaginary part of the self energy , where is the impurity concentration and is the density of states per spin at the Fermi level.
The fit of the theory to the temperature dependent spectra for each channel obtained in overdoped Bi2Sr2CaCu2O8+δ (Bi 2212, T) by Hackl et al. in Ref. [8] is shown in Figs. 2 and 3 for the and channels, respectively. We note that and have not been determined via fits to magnetic response data. These fits are thus obtained by choosing: and at a fixed temperature, the magnitude of the impurity scattering rate, a magnitude of the coupling constant , and which control the magnitude of the Raman scattering in each channel. These parameters were chosen to fit the lowest temperature data shown in the Figure. Then, only the temperature dependent parts of and were then modified to fit the data at other temperatures as shown by the rest of the curves in Figs. 2 and 3. The parameters we have used are cmmeV, for all temperatures, and .

Further information can be obtained concerning the slope of the spectra at vanishing frequencies. In Ref. [8] it was shown that the inverse of this slope has qualitatively different behaviors for different doping regimes of various cuprate materials. Within the level of our approximations, the low frequency Raman spectra is given by
| (5) | |||
| (6) |
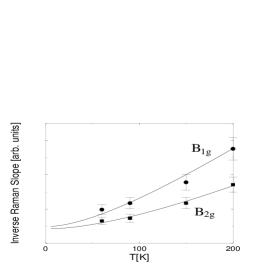
In Fig. 4 we plot obtained from the parameters used in Figs. 2 and 3 and compare the results to the data taken in [8]. The fit to the data is quite good when the error bars of the data are taken into account. A 8% uncertainty has been included in the data[9]. We remark that similar fits can be made with slightly different parameter choices than the ones considered here.
In closing, we remark that while good agreement between the theory and the data has been shown for overdoped Bi 2212, several features remain to be explained in optimally and underdoped systems. For instance, an almost completely temperature independent high frequency background is observed in these systems, and the difference of the inverse slope of the Raman response between and channels grows remarkably upon lesser dopings[8]. Moreover, features which have been associated with a pseudo-gap have been observed in the underdoped systems[10]. These features are discussed in greater detail in [4].
T.P.D. would like to acknowledge helpful conversations with D. Pines and B. Stojkovic. Acknowledgment is made to the Donors of the Petroleum Research Fund, administered by the American Chemical Society, for support of this research.
REFERENCES
- [1] A. Millis, H. Monien, and D. Pines, Phys. Rev. B 42,167 (1990).
- [2] B. Stojkovic and D. Pines, to appear in Rev. Mod. Phys.
- [3] B. Stojkovic and D. Pines, preprint.
- [4] T. P. Devereaux and A. P. Kampf, to be published.
- [5] D. Pines and B. Stojkovic, Phys. Rev. B 55, 8576 (1997).
- [6] T. P. Devereaux, A. Virosztek, and A. Zawadowski, Phys. Rev. B 54, 12523 (1996).
- [7] T. P. Devereaux and A. P. Kampf, Int. Journ. Mod. Phys. B 11, 2093 (1997).
- [8] R. Hackl et al., in Spectroscopic Studies of Superconductors, I. Bozovic and D. van der Marel, Eds., Proc. SPIE 2696, 194 (1996).
- [9] M. Opel, private communication.
- [10] X. K. Chen et al., Phys. Rev. B 56, R513 (1997); R. Nemetschek et al., Phys. Rev. Lett. 78, 4837 (1997).