Fano effect in the plane of Nd1.96Ce0.04CuO4+y: evidence of phonon interaction with a polaronic background
Abstract
Reflectance measurements in properly selected samples of Nd1.96Ce0.04CuO4+y with different carrier concentrations provide a firm evidence of Fano antiresonances for the four transverse optical phonons in the plane. A fit of the whole optical conductivity has been performed, without any previous subtraction of the electronic background. Those fits, as well as the dependence on temperature of the renormalized phonon frequencies, show that the electronic continuum is provided by the same polaron band which characterizes the optical conductivity of all the insulating parent compounds of high Tc superconductors. The relevance of these results for the metallic and superconducting phase of cuprates is discussed.
pacs:
74.30.Gn, 72.10Di, 74.70Vy, 78.20CIn 1961, U. Fano quantitatively accounted for the so called Fano antiresonance, i.e., the asymmetric line shape of the resonance of He observed in electron inelastic scattering experiments.[3] In that work, Fano revised an earlier qualitative interpretation[4] of the spectra of He and other rare-gases. Fano pointed out that such effects are expected whenever a set of discrete states is mixed with a continuous spectrum. Thereafter, “Fano profiles” have been observed in a number of spectra, including those where phonon discrete states interact with a continuum background due to itinerant charges. In high critical temperature superconductors (HCTS), phonon Fano profiles have been detected with the electric field of the radiation polarized along the -axis, either in[5, 6, 7, 8] YBa2Cu3O7-δ, and in[9] Bi2Sr2CaCu2O8. Moreover, in the 400-600 cm-1 region of the reflectivity spectra of Pb2Sr2LCu3O8 (L = Y, Dy, Eu, Nd, and Pr), phonon lineshapes have been reported to become asymmetric for increasing doping.[10] These results have been explained in terms of an interaction of Raman-active modes along the axis, made infrared-active by some symmetry-breaking potential, and an electronic continuum which develops with doping in the mid infrared. As far as we know, no evidence of Fano lineshapes has been reported for the four infrared active phonons of the plane. Here indeed, the optical phonons are shielded by the carriers which form below a fluid of superconducting pairs.
In order to look for Fano resonances in the plane of a cuprate, we have selected a strongly doped, non-metallic system, where the existence of a considerable electron-phonon coupling is ensured by previous observations of polaronic effects in the plane reflectivity. It is the case of Nd2-xCexCuO4-y (NCCO), where an electronic continuum detected at 1000 cm-1 has been explained in terms of a polaron-band , whose strength increases with either , see Ref. [11], or , see Ref. [12]. In order to discriminate the effect of the charges added to the plane from possible effects due to the chemical doping, two single crystals with the same Ce doping but different carrier concentration have been measured, MN10 and MN29. The former is as-grown, the latter is enriched in oxygen. From the present spectra one checks that the effective number of carriers available in the charge-transfer gap for MN10 is 1.5 times that for MN29.[13] In the following it will be shown that asymmetric lineshapes are found in both samples for the four phonons of the plane, which can be explained in detail by a Fano interaction between the phonons and an electronic background.[14] This latter is not the weak Drude term eventually present in these semiconducting compounds, but the polaron band peaked at 1000 cm-1. This conclusion is based on the position of the dips in the Fano lineshapes and on the displacement at low temperature of the Cu-O stretching frequency. This phonon shift is negligible in MN29, where the band changes weakly with temperature, increases to 7 cm-1 in MN10 where at low the polaron band undergoes a dramatic transfer of spectral weight towards lower energies.
The experimental apparatus has been described in detail elsewhere.[12] Data have been collected from 20 (MN29) or 70 (MN10) through 18,000 cm-1 by use of a Michelson interferometer. The real part of the optical conductivity has been obtained from Kramers-Kronig transformations. The reflectivity data have been extrapolated to zero frequency either by using a Hagens-Rubens formula or by a Drude term obtained by fitting a Drude-Lorentz model for the complex dielectric function to the data.[12] The transformed , for cm-1, has been found to be independent of the approach used. For cm-1, has been extrapolated up to = 320,000 cm-1 by using the values at 300 K reported by Tajima et al[15] and, at higher frequencies, by extrapolating with a law.
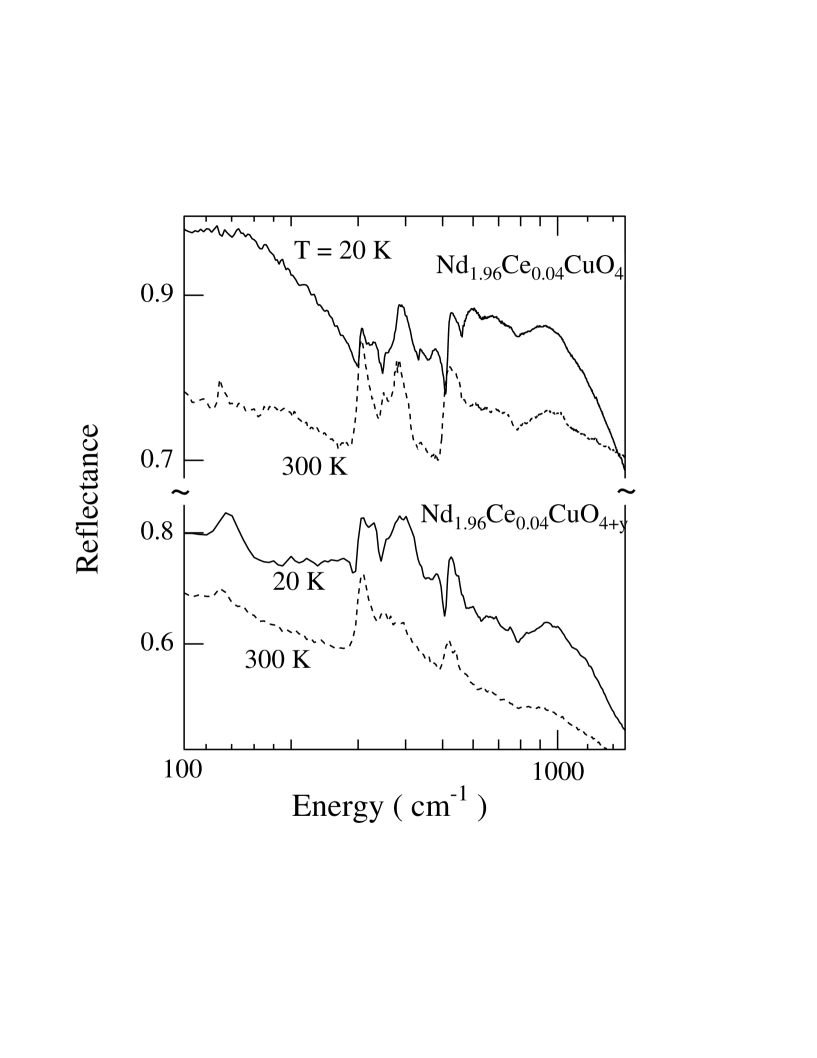
The low-energy reflectance of samples MN10 and MN29 is reported in Fig. 1 for =20 K and =300 K. is strongly -dependent in both samples and lower in MN29 than in MN10, consistently with the lower number of extra charges in the former crystal. In both samples, the room temperature reflectivity is dominated by the four phonons and by a broad but clear peak at 1000 cm-1, the band. In the low- spectra, several additional modes add to the extended phonons. They are the IRAV observed in the same compound when doped by oxygen vacancies.[12]
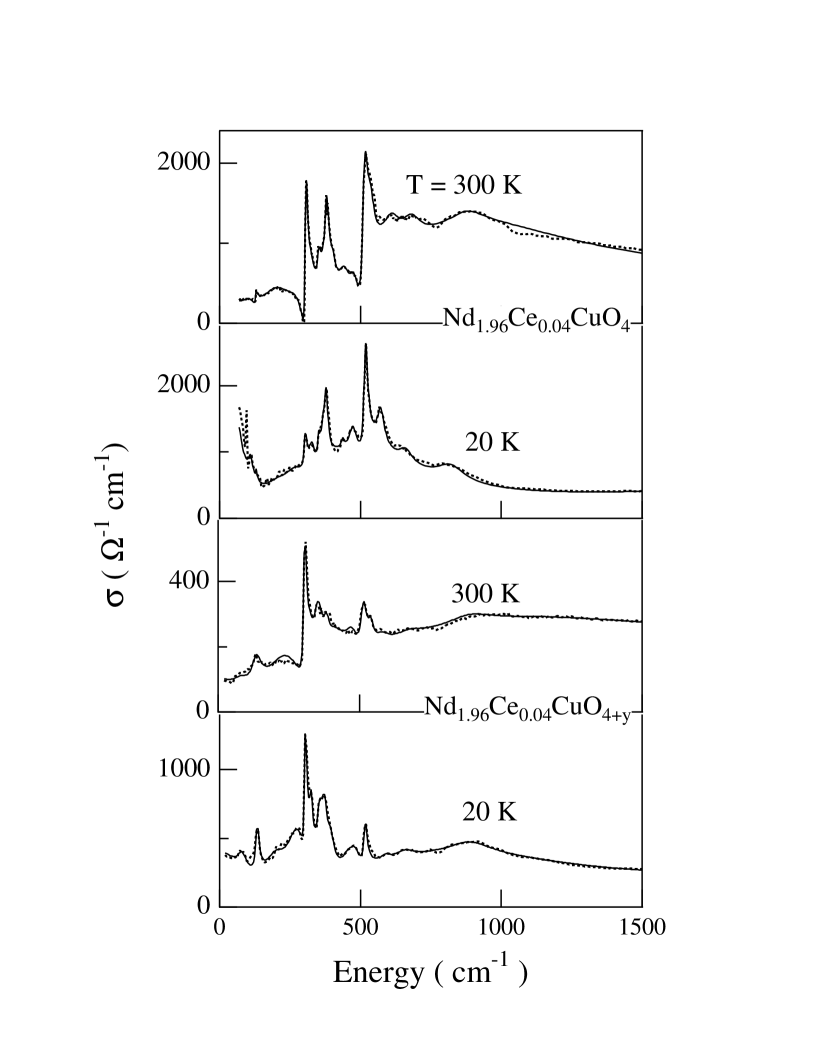
The low-energy part of the optical conductivity, obtained as described above, is reported in Fig. 2 for the same samples and temperatures of Fig. 1. The room temperature phonon lines of both samples (in particular the bending and stretching Cu-O modes at 300 and 515 cm-1, respectively) deviate appreciably from the ordinary Lorentzian shapes. They display a strong asymmetry, with a dip on the low energy side which indicates an interaction with a continuum at higher energy.[3] The closest band with such features is the band. In order to verify if really the phonons interact with the polaronic background, the optical conductivity from 70 (20) to 18,000 cm-1 has been fitted in terms of a complex dielectric function given by
| (1) |
i.e., by a (weak) Drude-like term, Fano resonances, local modes, the polaron band, the mid-infrared band MIR, the charge-transfer band, and finally by all higher-energy oscillators which are represented by (see Ref. [11] for details on most of these terms). These contributions are all given by Lorentzians, but for , with strengths, peak frequencies, and damping factors given by , , and , in the order. The overall contribution to the dielectric function of an oscillator interacting with an electronic continuum has been first estimated in Ref. [14]. This estimate has been never used before to fit the far-infrared optical conductivity of HCTS, or of other ionic compounds, at least to our knowledge. Fano lineshapes are usually fitted, instead, after an arbitrary subtraction of the electronic background. Following Ref. [14], one has , with
| (2) |
and
| (3) |
where are scale parameters which include the transition rates to the excited states and are the Fano-Breit-Wigner parameters, an inverse measure of the electron-phonon interaction for the -th phonon.[3] The dependence of , and on energy is assumed to be smooth and is therefore neglected in the model. is the renormalized frequency of the -th phonon.
The fits obtained in this way are excellent in both samples at all temperatures, as shown by the close match in Fig. 2 between the theory (full lines) and the data (dots) in the case of 300 K and 20 K. The fit parameters are given in Table I for samples MN10 and MN29, together with those of the polaron band. For all modes of sample MN10, is roughly constant for K, while it decreases by a factor of 3-4 at room temperature. These values are similar, but for the sign, to those reported in YBa2Cu3O7-δ for the Raman mode at 312 cm-1 interacting with an electronic background. Therein, is equal to -4.3 at room temperature[16] and ranges from -6 to -2 for temperatures varying between 4 K and 300 K.[8] In that case, however, Raman-active -axis phonons were claimed to interact with a Drude continuum at zero frequency, hence the negative sign for .
The general optical properties of NCCO in the midinfrared are described in detail elsewhere.[13] However, the dependence of the band on doping and temperature (Fig. 2) will be examined here in relation to the present discussion of the phonon Fano lineshapes. As a whole, the behavior of the band for a 0.04 Ce doping follows that already observed in ligthly oxygen-deficient NCO.[12] In the compensated sample MN29 (see Fig. 2 and Table I), the peak energy of the band is =1100 cm-1 at 300 K and slightly decreases to 850 cm-1 at 20 K. In the as-grown MN10, =900 cm-1 at 300 K, and drops to 480 cm-1 at 20 K. In Table I one can also notice that in sample MN10 the highest frequency (stretching) mode hardens for decreasing temperature, by an amount much larger than the experimental uncertainty of 0.5 cm-1, while the energy of the other phonons remains constant. On the contrary, in sample MN29 no appreciable dependence on has been detected either for the energies of all the four phonons, including the stretching mode, or for their Fano parameters. For all MN29 phonons but for the bending mode, where . The dependence on reported above for the two samples confirms the conclusion based on the position of the dip in the asymmetrical phonon lineshapes, namely that the the phonons interact via Fano with the polaron -band. In fact, for decreasing the band shifts to low energy by a large amount in sample MN10, only slightly in sample MN29. Moreover, in the former sample the difference between and the peak energy of the phonon changes drastically for the highest energy phonon, which hardens as predicted by the theoretical model.[3, 9] Also the dependence on of the Fano parameter , inversely related to the strength of the electron-phonon interaction, is consistent with the behavior with of the polaron band in the two samples. In fact, from = , where is the binding polaron energy, is an average electron-phonon-interaction parameter, and is an average interacting-phonon frequency. The latter is 210 cm-1 in NCO from Ref. [12], in a Lorentzian band model, and from =2 (4) for a small (large) polaron,[17] one obtains =, with A=0.5 (0.25). In a small polaron approach, therefore, the softening of in sample MN10 is related to a parallel decrease of (from 300 cm-1 to 220 cm-1 for going from 300 K to 20 K) and an ensueing increase of in the same temperature range (in a large polaron approach, changes from 220 cm-1 to 160 cm-1). In sample MN29, instead, the energy of the polaron band has a smaller relative change with while is roughly constant. If one extrapolates these results to even higher doping (where direct observations of phonon and bands are prevented by shielding effects) one may infer that the insulating-to-metal transition observed in NCCO for =0.13 could be due to a collapse of the binding energy of the polaron, which could turn from a partially localized quasiparticle to a completely delocalized carrier.
The strength of the electron-phonon interaction can be quantitatively estimated also from the dependence of the stretching mode energy in sample MN10, the only mode which shows a sizable dependence. It has to be noticed that this dependence cannot be ascribed to changes in the lattice parameters since the same stretching mode is roughly independent in sample MN29. By using the Green’s function formalism,[9] one obtains for the renormalized phonon frequencies
| (4) |
where gk are the coupling constants for the interaction of the -th phonon of energy with an electronic oscillator with resonance frequency and damping constant given by and , respectively. It is worth noticing here that the coupling constants do not necessarily coincide with the electron-phonon interaction parameter , for at least two reasons. First, is an effective parameter averaged over the different local modes[12] or phonons which build up the polaron band. Second, the value of the interaction which leads to the formation of a polaron band may differ from that between the same band and extended phonons which results into the Fano resonances. Therefore, in evaluating the renormalized phonon frequencies from Eq. 4 we take as a fitting parameter which, for sake of simplicity, is assumed to be temperature independent. The bare phonon frequency is the second fitting parameter, while the values of and entering Eq. 4 are those obtained at each temperature by the Lorentz-Fano fit of the optical conductivity and reported in Table I. The dependence on temperature measured for the stretching-mode energy is reported by dots in Fig. 3, together with the theoretical estimate of as obtained for 150 cm-1 and cm-1. The agreement between the model and the experiment is excellent. The value for is on the same order of that estimated for , thus strengthening the whole model of interaction between carriers and the polaron band. The same model, when applied to the other three modes in sample MN10 or to all the four modes in sample MN29, gives values of the phonon energies which are constant within the experimental uncertainty, in agreement with the experimental results, provided cm-1.
In summary, a clear signature of a Fano interaction between all the transverse optical phonons and an electronic continuum has been obtained by measuring the reflectance of two Nd1.96Ce0.04CuO4+y samples with different carrier concentrations. A fit has been made of the optical conductivity by a formula which accounts for the whole effects of the electron phonon interaction, both on the discrete and on the continuum states. In this way it has been shown that those phonons interact with the same polaron band which, as recently reported, characterizes the optical properties of the insulating parent compounds of high Tc superconductors. The dependence on temperature of the renormalized phonon frequencies has been analyzed and an estimate of the strength of the electron-phonon interaction has been provided, further supporting the above interaction model. These results point out the role of polarons in the optical properties of the insulating parents compounds of HCTS. The increase of the Fano parameter for decreasing observed in the more doped sample and the corresponding large softening of the polaron band indicate that the insulator-to-metal transition in cuprates could be triggered by a collapse to zero frequency of the polaron band. Measurements in more doped samples, as well as in other cuprates, are needed to confirm this intriguing scenario.
We are indebted to W. Sadowski for providing the samples here investigated, to G. Strinati and M. Grilli for helpful discussions and suggestions.
REFERENCES
- [1] Present Address: Daresbury Laboratories, Warrington WAK 4AD, United Kingdom.
- [2] Present Address: LURE, Université Paris-Sud, 91405 Orsay, France.
- [3] U. Fano, Phys. Rev. 124, 1866 (1961).
- [4] U. Fano, Nuovo Cimento 12, 156 (1935).
- [5] R.M. Macfarlane, H.J. Rosen, and H. Seki, Solid State Commun. 63, 831 (1987).
- [6] S.L. Cooper et al., Phys. Rev. B 37, 5920 (1988).
- [7] C. Thomsen et al., Phys. Rev. B 37, 9860 (1988).
- [8] R. Feile et al., Z. Phys. B 73, 155 (1988).
- [9] A. Zibold et al., Physica C 193, 171 (1992).
- [10] M. Reedyk, T. Timusk, J.S. Xue, and J.E. Greedan, Phys. Rev. B 45, 7406 (1992).
- [11] S. Lupi et al., Phys. Rev B 45, 12 470 (1992).
- [12] P. Calvani et al., Phys. Rev. B 53, 2756 (1996).
- [13] B. Ruzicka et al., Physica B, in press.
- [14] L.C. Davis and L.A. Feldkamp, Phys. Rev. B 15, 2961 (1977).
- [15] S. Tajima et al., J. Opt. Soc. Am. B6, 475 (1989).
- [16] C. Thomsen and M. Cardona, Raman Scattering in High Tc Superconductors, in Physical Properties of High Temperature Superconductors, edited by D.M. Ginsberg (World Scientific, Singapore, 1989), Vol. I, p. 473.
- [17] D. Emin, Phys. Rev. B 48, 13 691 (1993).
| 20 K | 100 K | 200 K | 300 K | |
|---|---|---|---|---|
| 130 (133) | 130 | 130 | 128 (132) | |
| R1 | 1 (1.2) | 2 | 2 | 4.5 (0.6) |
| 3 (8) | 4 | 4 | 4 (20) | |
| q1 | 8 (10) | 8 | 8 | 1.5 (10) |
| 303 (303) | 303.5 | 303 | 304.5 (304) | |
| R2 | 1.9 (3.9) | 1.7 | 3.7 | 9 (2.7) |
| 6 (5) | 4 | 4.5 | 5 (6.5) | |
| q2 | 5 (3.1) | 7 | 3.8 | 1.8 (3.1) |
| 351 (352) | 350 | 349.5 | 350 (351) | |
| R3 | 2.3 (0.68) | 2.7 | 2.3 | 2.8 (0.48) |
| 5 (10) | 5 | 5 | 7 (18) | |
| q3 | 3 (10) | 3 | 3 | 2.4 (10) |
| 517 (515) | 514 | 512 | 511 (514) | |
| R4 | 2.9 (0.83) | 1.7 | 2 | 6 (0.55) |
| 8 (7) | 7 | 8 | 11 (12) | |
| q4 | 4.5 (7) | 6.5 | 6 | 2 (7) |
| 480 (850) | 500 | 570 | 900 (1100) | |
| Se | 5400 (4800) | 5800 | 6900 | 8000 (5400) |
| 500 (1100) | 650 | 800 | 1100 (1900) |