Melting and Pressure-Induced Amorphization of Quartz
Abstract
It has recently been shown that amorphization and melting of ice [1] were intimately linked. In this letter, we infer from molecular dynamics simulations on the SiO2 system that the extension of the quartz melting line in the metastable pressure–temperature domain is the pressure-induced amorphization line. It seems therefore likely that melting is the physical phenomenon responsible for pressure induced amorphization. Moreover, we show that the structure of a ”pressure glass” is similar to that of a very rapidly ( to kelvins per second) quenched thermal glass.
pacs:
Which numbers?…pacs:
– High Pressure. – Structure of Liquids. – Solid–Liquid Transitions.1 Introduction
Pressure induced amorphization (PIA) is an intriguing phenomenon. The first report of this transition goes back to 1984 when Mishima et al. [2] found that ice–Ih cooled down to 77 K and pressurized to 1 GPa failed to transform into crystalline Ice–IX and became amorphous. Since then, a large number of materials were found to undergo similar transitions [3] at different pressures and temperatures. In particular, quartz, one of the most studied minerals, was found to amorphize [4] at room temperature at pressures between 15 and 25 GPa. A series of experiments [5, 6] and molecular dynamics (MD) simulations [7, 8, 9] have shown that this transition is accompanied by an increase in silicon coordination. However, the thermodynamic nature of this transition remains very poorly defined. It has been argued on the basis of lattice dynamics calculations using the quasi-harmonic approximation and the Born stability criteria [10] that the PIA of quartz took place as the result of an elastic instability [11] occurring at approximately 22 GPa. More recently, it has been proposed that a dynamical instability occured at lower pressure [12] (18.5 GPa) than the elastic instability, and that the sizes and geometries of the simulation boxes dramatically affected the existence and thresholds of the reported instabilities. Results obtained by ab initio calculations within the local density approximation of the density functional theory showed [13] that the elastic instability occured at 29 GPa, but all recent MD calculations [7, 8, 14] suggest that amorphization occurs at 22 GPa, independently of the size or geometry of the simulation box, so that the role of the instability in the pressure induced amorphization process is still a matter of debate [12].
Hemley et al. [15] proposed that PIA of quartz represents the metastable extension of the melting curve of SiO2. Richet [16] using thermodynamic arguments has inferred that the vitrification upon room temperature decompression or upon room pressure heating of some high pressure silicate minerals represents crystal fusion. In the first report on the PIA of ice, Mishima proposed that the transformation could be related to a metastable melting process, and the author recently showed [1] that the pressure-induced transformation towards amorphous ice (high density amorphous phase) can be described as a melting transition to an extremely unrelaxed amorphous state. This state then slowly relaxes towards an energetically more favourable glass-like state. It has been shown using Raman spectroscopy that the amorphization induced by heating of stishovite leads to a highly unrelaxed glassy state [27, 3, 28] exhibiting the features of the pressure glass obtained upon room temperature compression and decompression of quartz111the reference pressure glass we have modelized in this study, which then gradually transforms into a relaxed glassy state indistinguishable (at least from the vibrational point of view) from the usual thermal glass, thus indicating that the two ”glassy” states probably belong to the same basin in configurational space.
In this letter, we present results from MD simulations that provide new insights into the relationship between PIA and melting, and report the structural and thermodynamic similarities between amorphous SiO2 prepared by static compression of quartz at room temperature and quenched silica glass.
2 Results and Discussion
MD simulations have been used to investigate the melting and amorphization curves of quartz in the metastable P–T domain in which the nucleation of the high pressure polymorphs cannot be bypassed in laboratory experiments. Also, the cooling rates used for quenching liquid SiO2 in MD simulations are by far larger than those used by current experimental techniques. MD calculations were carried out in an (N,P,T) isothermal-isobaric ensemble, for a system of 480 SiO2 molecules. The BKS [17] pairwise interaction potential which has proven to provide a very accurate description of silica at high pressure [7, 14, 8], was used. A system in the quartz structure was subjected to compression at different temperatures, or to isobaric heating, until either amorphization or melting was observed. In the low-temperature high-pressure part of the phase diagram relative to non-equilibrium melting, these amorphous states were detected by a combined analysis of the radial distribution function and the energy jump at the transition, along with an analysis of the average positions of the particles integrated on the duration of the simulation. In the high-temperature low-pressure domain relative to the equilibrium melting curve, and thanks to the power of modern parallel computers, we could achieve a real thermodynamic determination of the melting points within reasonable computation time, which was impossible to carry out only a few years ago on such viscous systems [20]. Instead of calculating the differences of free enthalpy between the solid and liquid phases, we used an equivalent technique that consisted in performing two phase molecular dynamics simulations, and monitored the energy variation of the system with time, along with the relative increase or decrease in one of the two phases in the simulation box. With computation times of 0.3 ns, it was possible to determine the theoretical melting curve for the model, with an accuracy of the order of 50 K at 10 and 5 GPa.
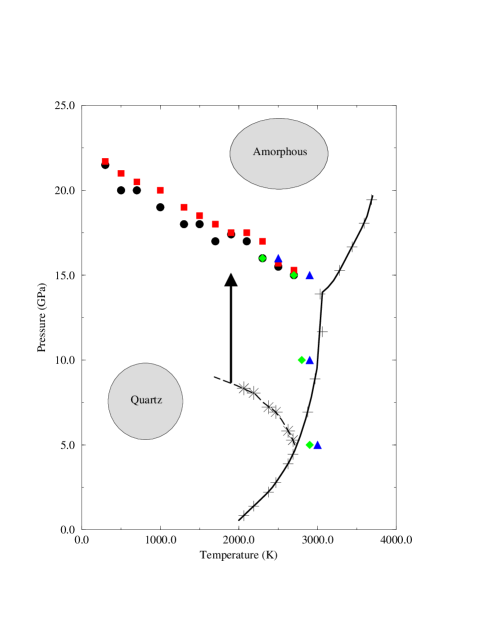
The corresponding points are reported in the P-T phase diagram of figure 1. They represent the numerical coexistence curve between the crystal, and the melt. The term melt is used here for both the high temperature liquid state and the high pressure disordered state. Comparing these points with the experimental results for the melting of quartz, it seems clear that the amorphization curve is a reasonable extrapolation of the melting curve, given that the amorphization process is a continuous extrapolation of the melting process and falls along the extrapolated melting line of coesite, the highest pressure form of silica consisting of four-fold coordinated silicon clusters. This pressure-induced amorphization line is impossible to measure experimentally, because the amorphization process is impaired by the formation of coesite and stishovite. It represents the metastable (spinodal) stability limit of the quartz phase. It can furthermore be noted that the equilibrium melting curve of quartz in the metastable domain (i.e. the coesite stability field) is very close to the experimental coesite melting curve. This is due to the fact that quartz and coesite are very similar as far as their local structure is concerned (SiO4 polyhedra), and even though the solid phases have quite different free enthalpies at low temperature, the latter is smoothed at high temperature as the system approach the solid–liquid transition curve. Proof of that is the abscence of any break in the experimental melting curve of quartz and coesite at the quartz–coesite–liquid triple point.
Calculation of the metastable extension of the equilibrium melting curve by extrtapolation of thermodynamic data [15] have improved with the measurement of more accurate data at high temperature and at high pressure for the SiO2 system [18]. The recent calculation by Zhang et al. [18] using the most recent thermodynamic data is quite close to the results obtained from the numerical simulation. Although the extrapolated pressures are lower that those in the simulation, these authors have argued that these curves should be shifted to higher pressures if corrected for the configurational entropy term arising from the distribution of four- five- and six-coordinated silicon ions in the melt at high pressure, and for the volume difference brought by the appearance of these higher density clusters. In fact, the extrapolation of thermodynamic data does not include these higher coordination species, because such a transformation does not occur in the transition from quartz to coesite.
The continuity between PIA and melting should be reflected into some similarities between the structural and dynamical properties of the pressure amorphized material (thereafter called pressure glass) and of quenched liquids (thermal glasses). The properties of the latter type of systems are known to be sensitive to the quenching rate [19]. In order to compare pressure glasses and thermal glasses, we use as a reference state a sample of quartz, amorphized at 22 GPa, and then decompressed to room pressure, leading to a pressure glass with a density of . Thermal glasses were produced by cooling a high temperature liquid (7000 K) at room pressure and constant density using three different cooling rates , and . These glassy systems were then compressed at 300 K to obtain densified glasses with densities of . A second set of thermal glasses was produced by cooling the high temperature liquid (7000 K) at a constant density of , with the same three cooling rates, to avoid the final compression step in a highly non-ergodic system. Only the results relative to this last set of samples will be discussed below; similar, but less precise results were obtained with the samples cooled at .
Static and semi-dynamical quantities such as the coordination number distribution, ring statistics (figure 2) and vibrational densities of state (V-DOS, figure 3) were then calculated for these systems and compared to the corresponding quantities for the reference SiO2 pressure glass.
The coordination distribution shows that the proportion of 4-coordinated Si species decreases with increasing cooling rates, whereas the proportion of 6-fold and especially 5-fold Si coordination rises.
The effect of the cooling rate on coordination distribution is consistent with the pressure dependence of the coordination distribution [20] in liquid SiO2; as pressure rises in the 0–15 GPa range, the proportion of 4-fold coordinated Si species decreases whereas that of 5-fold (and in a lesser extent to 6-fold) coordinated Si species increases. The higher the cooling rate, the closer are the configurations of the supercooled and high temperature liquid (higher ”fictive temperature”). The high temperature liquid at these densities is in a high pressure state, which is maintained during the quench resulting in the formation of a strongly frustrated amorphous state, because the application of such a high cooling rate ”freezes” the system in such a short time compared with the mechanical relaxation time that the transformation is quasi-isochoric. These two observations represent two different pictures of the same phenomenon.
On the other hand, the ring statistics show that a high cooling rate reduces the proportion of the 5 and 6-membered rings characteristic of a low density structure in favour of small chains of 3-membered and 4-membered rings.
It has been proposed [21, 22] that the proportion of 3-membered and 4-membered rings increases with pressure in densified SiO2 glass or pressure-induced amorphous quartz, on the basis of the concomitant intensity change of the Raman D1 and D2 defect lines associated with these rings [23, 24]. Our results for the cooling rate dependence of the ring statistics shows that the proportion of these clusters is also enhanced by higher cooling rates, showing that the maximum pressure (before decompression) attained during room temperature compression of quartz plays a role similar to that of the cooling rate during the quenching of a melt at room pressure.
The coordination distribution in the pressure glass is close to that of a thermal glass obtained with a cooling rate (fig. 2). The ring distribution displays the same characteristics, except for 6-membered rings whose proportions (within a few percent) are not very significant, due to the greater error bars in the determination of these larger scale structures in non-ergodic systems.
A similar conclusion can be drawn from the vibrational density of states (V-DOS, fig. 3); the high-frequency internal stretching modes for the SiO4 units are strongly broadened in the pressure glass. This broadening is an increasing function of the cooling rates in the thermal glass. Another important feature is the peak at 900 cm-1; the glasses with higher cooling rates have a narrower peak followed by a plateau, whereas glasses produced by slow cooling of the liquid show a broader peak followed by a drop in the V-DOS. Once again, the pressure glass exhibits a behaviour intermediate between that observed for the two rapidly cooled systems, and is very close to the glass cooled at . These results imply that the pressure glass has similar structural and thermodynamic properties as a rapidly cooled ( to ) liquid at the same density and temperature. This supports the continuity between the liquid and the pressure glass, and therefore between the melting and the amorphization curves.
A natural question is the relationship between our results and the possibility of a polyamorphic [25, 26] transition from a higher-entropy amorphous form of silica (the pressure glass) to a lower-entropy form (the thermal glass). In MD studies, there is no indication of any phase transition behaviour during densification, seems negative through the complete densification process at room temperature [7]. In order to accurately check the latter proposition, we carried out very long (N,P,T) simulations (0.134 nanoseconds) on SiO2 glass cooled at and compressed in the 5–15 GPa range. A histogram of the density fluctuations was then plotted and it showed a single yet broad maximum.
3 Conclusion
All these arguments suggest that below T, the metastable extension of the quartz melting curve and the amorphization curve are identical. non-equilibrium thermodynamic melting can then be considered as the physical process responsible for high-pressure amorphization, at least in the case of this theoretical model of silica.
***
The calculations were carried out using the CONVEX SPP-1000 computer at the Pôle Scientifique de Modélisation Numérique (PSMN), École Normale Supérieure de Lyon. We wish to thank Walter Kob for helpful comments and discussions, and especially for providing us with the initial systems of room pressure thermal glasses. We thank Bruno Reynard and Russell J. Hemley for helpful comments.
Laboratoire de Sciences de la Terre is UMR 5570. Département de Physique des Matériaux is UMR 5586.
References
- [1] O. Mishima. Nature, 384:546–549, 1996.
- [2] O. Mishima, L.D. Calvert, and E. Whalley. Nature, 310:393–395, 1984.
- [3] P. Richet and Ph. Gillet. Eur. J. Mineral., in press, 1997.
- [4] R.J. Hemley. In High-Pressure research in mineral physics, Mineral Physics 2. Terra Scientific Publishing Company – AGU, 1987.
- [5] C. Meade, R.J. Hemley, and H.K. Mao. Phys. Rev. Lett., 69:1387–1390, 1992.
- [6] J.-P. Itié, A. Polian, G. Calas, J. Petiau, A. Fontaine, and H. Tolentino. Phys. Rev. Lett., 63:389–401, 1989.
- [7] J.S. Tse and D.D. Klug. Phys. Rev. Lett., 67:3559, 1991.
- [8] J.S. Tse and D.D. Klug. Science, 255:1559–1561, 1992.
- [9] N. Binggeli, N. Troullier, J.-L. Martins, and J.R. Chelikowsky. Phys. Rev. B, 44:4471, 1991.
- [10] N. Binggeli and J.R. Chelikowsky. Phys. Rev. Lett., 69:2220–2223, 1992.
- [11] L.E. McNiel and M. Grimsditch. Phys. Rev. Lett., 68:83–85, 1992.
- [12] G.W. Watson and S.C. Parker. Philosophical Mag. Lett., 71:59–64, 1995.
- [13] N. Binggeli. Simulation of Silicas : from classical pair potentials to density functional theory, CECAM Workshop : September 15–17, 1997.
- [14] J. Badro, J.-L. Barrat, and Ph. Gillet. Phys. Rev. Lett., 76:772–775, 1996.
- [15] R.J. Hemley, A.P. Jephcoat, H.K. Mao, L.C. Ming, and M.H. Manghnani. Nature, 334:52–54, 1988.
- [16] P. Richet. Nature, 331:56–58, 1988.
- [17] B.W.H. van Beest, G.J. Kramer, and R.A. van Santen. Phys. Rev. Lett., 64:1955–1958, 1990.
- [18] J. Zhang, R.C. Liebermann, T. Gasparik, and C.T. Herzberg. J. Geophys. Research, 98:19785–19793, 1993.
- [19] K. Vollmayr, W. Kob, and K. Binder. Phys. Rev. B, 54:15808–15827, 1996.
- [20] J.-L. Barrat, J. Badro, and Ph. Gillet. J. Mol. Sim., 20:17–25, 1997.
- [21] R.J. Hemley, H.K. Mao, P.M. Bell, and B.O. Mysen. Phys. Rev. Lett., 57:747–750, 1986.
- [22] P.F. McMillan, B.T. Poe, Ph. Gillet, and B. Reynard. Geochim. Cosmochim. Acta, 58:3653–3664, 1994.
- [23] R.J. Bell, N.F. Bird and P. Dean. J. Phys. C, 1:299, 1968.
- [24] F.L. Galeener, A.J. Leadbetter and M.W. Stringfellow. Phys. Rev. B, 27:1052, 1983.
- [25] P.H. Poole, T. Grande, F. Sciortino, H.E. Stanley, and C.A. Angell. Comp. Mat. Sci., 223:1–9, 1995.
- [26] S. Aasland and P.F. McMillan. Nature, 369:663, 1994.
- [27] Ph. Gillet, A. Le Cléac’h, and M. Madon. J. Geophys. Res., 95:21635–21655, 1990.
- [28] M. Grimsditch, S. Popova, V.V. Brazhkin, and R.N. Voloshin. Phys. Rev. B, 50:12984–12986, 1994.