Characterisation of HTSC ceramics from their resistive transition
to be published in Supercond. Sci. Technol.)
Abstract
The resistivity vs. temperature relation in bulk ceramic HTSC under self-field conditions as well as in weak external magnetic fields is modelled by local Lorentz force induced fluxon motion with temperature dependent pinning. A pinning force density and two viscous drag coefficients in intergrain and intragrain regions, respectively, can be used as characteristic parameters describing the temperature, current, and external field dependences of the sample resistance.
1 Introduction
The resistivity of a ceramic superconductor is known to depend on transport current, temperature, external magnetic field, and on the geometry of the sample [1]. The critical current also depends on the latter three parameters, which means that the averaged critical current density alone is unsuitable as a parameter for material characterisation.
Resistance in cuprate superconductors is supposed to be caused by fluxons [2] moving under the influence of Lorentz forces and pinning forces acting in opposite directions, leading to a superconducting state with finite current density and truly zero resistance.
In earlier papers [3, 4], a model for fluxon motion in HTSC was introduced that contains temperature dependence through the temperature dependence of pinning forces and fluxon mobilities, and in which a magnetic field dependence of the pinning forces causes the critical currents to decline rapidly with increasing fields. This Lorentz force model, which is an alternative to the model of thermally activated fluxon motion, has already explained the temperature and magnetic field dependence of local critical current density [5, 6, 7] as well as its variation with sample cross section.
We report measurements of the temperature dependent resistivity and the broadening of the resistive transition of YBaCuO with increasing transport current or external magnetic field in the temperature range (77…91) K. We demonstrate how the broadening can be described in terms of Lorentz force induced fluxon motion.
The resistivity of ceramics shows a behaviour that can be described with a model based on Lorentz force induced fluxon motion in two phases. Numerical model calculations and their comparison with experimental data show that three sample parameters are sufficient to describe the characteristics.
2 Experiments
2.1 Technique
To avoid errors in temperature dependent resistivity measurements by ohmic heating of the contacts or the bulk we employed a transient current signal technique, using a single triangular shaped current pulse. Choosing equal rise and fall rates and averaging the measured voltage drop along the superconductor for rising and falling current compensated the voltage background due to induction.
The voltage was amplified by a calibrated differential amplifier switchable over several decades and registered on a two channel transient recorder together with the measured current . From these raw data, was calculated for five fixed values per sweep. Duration of the current triangle was , and we evaluated for . Experiments with transient signals were performed at temperatures above , and the temperature was monitored by a NiCr-CuNi thermocouple. Static magnetic fields of several millitesla could be applied perpendicular to the direction of the current flow.
YBaCuO samples of typical cross sections or and length had been prepared by the standard mixed oxide method. We made current leads by soldering on a copper layer deposited on the ceramic by thermal evaporation. Contact resistivities were at room temperature, and we found that the mechanical stability of the soldering joint was sufficient as long as the contact resistivities did not exceed these values.
2.2 Measurements
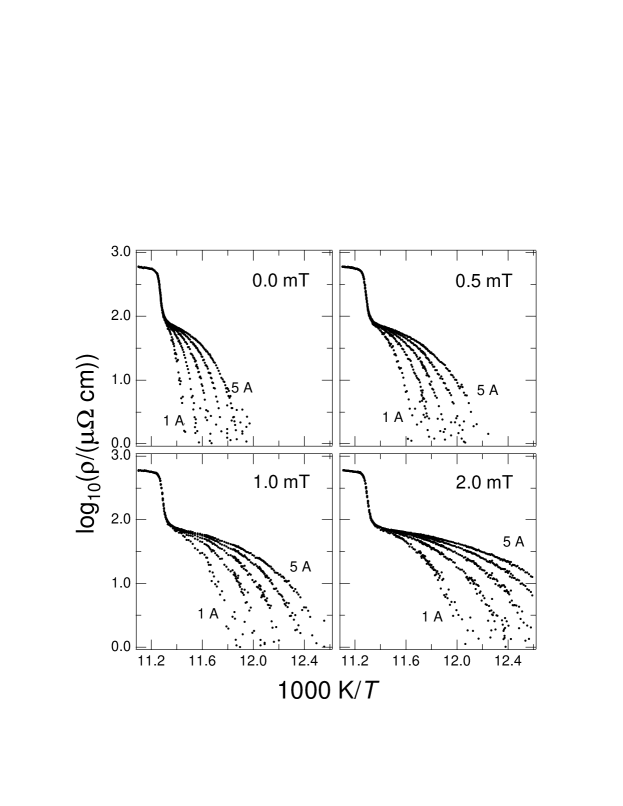
Figure 1 shows a set of Arrhenius plots of the resistive transition of our YBaCuO sample V for five different transport currents in zero and three different external magnetic fields. The most remarkable feature of these curves, apart from the overall broadening of the transition with both parameters, is their inclination at (for this sample) about a tenth of the resistivity value at the onset of metallic behaviour. We refer to the resistivity value at this point as . The inclination point separates the broad shoulder of the curves [8] from a leap in resistivity over a comparatively small temperature interval.
For the range of transport currents and magnetic fields in the situation of fig. 1, the broadening of the transition occurs only in the shoulder, while the leap is not affected. The inclination at thus becomes sharper. The critical state, i. e. the point where the curves diverge to infinity, is shifted towards lower temperatures with increasing field or transport current.
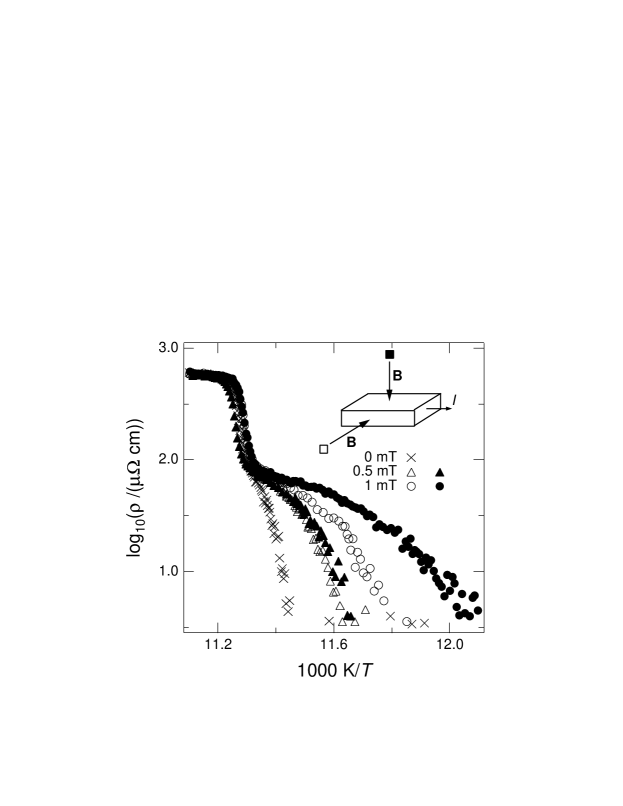
It is worth noting that the width of the transition depends on the orientation of the sample to the magnetic field. Fig. 2 gives a set of experimental data for sample V, showing that the transition is wider when the field is applied perpendicular to the larger lateral face of the sample.
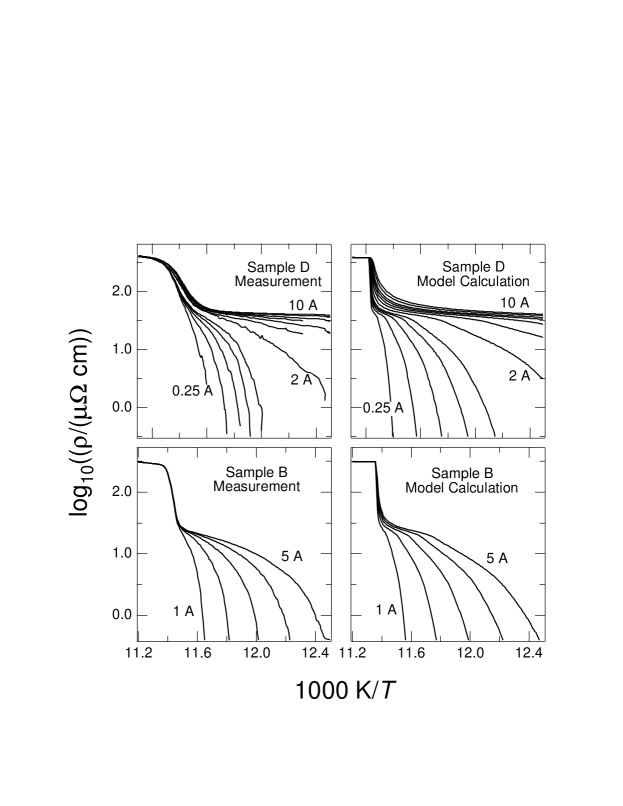
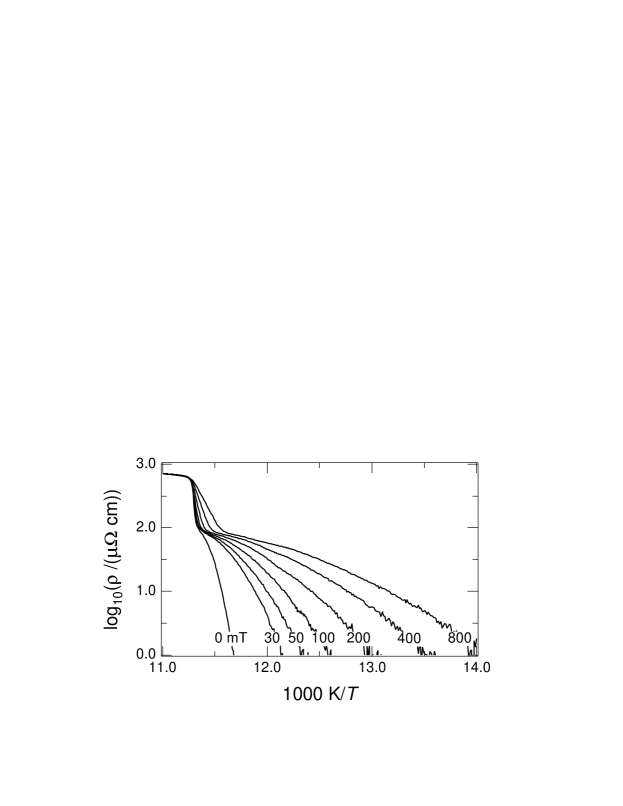
The transition above is also broadened with transport currents and magnetic fields, though much less than the shoulder. For the case of current dependent broadening, we can see this in the top left panel of fig. 3, where data for sample D are shown. This sample had a smaller cross section than sample V, and we could reach higher current densities in the experiment. Broadening with external magnetic fields is obvious from fig. 4, which shows the results of a resistance measurement with standard dc technique in external magnetic fields up to 800 mT.
The position of the inclination point , however, is not affected by the broadening of the resistivity above . We interpret this as evidence for a two phase behaviour of the resistive transition, where both phases differ in the parameters describing the pinning.
3 Model assumptions
3.1 Lorentz force model
The model of Lorentz force induced fluxon motion causing resistance in HTSC has been described in more detail in earlier papers [3, 4], and applied to describe experiments on the critical current density of HTSC [6, 7] and the redidtribution of local current densities in external fields [5]. In this section, we briefly review the foundations here as they were stated and used in these references.
It is assumed that a flux line moves with a velocity determined by a viscous drag coefficient and the excess of local Lorentz force density (per unit length) over the pinning force density ,
| (1) |
For , the sample is in the critical state. The pinning forces are assumed to be distributed evenly over an interval [3]. This results in an average fluxon velocity [3]
| (2) |
The motion of vortices with area density causes losses leading to an electric field [9]
| (3) |
Pinning forces depend inversely on the local field of magnetic induction,
| (4) |
This relation was used both in the critical current studies of Kilic [6] and Kliem et al. [7] and should be applicable here since the applied external magnetic fields were of the same order of magnitude as the self-field, like in the paper on current densities in small external fields by Schatteburg et al. [5]. is the sum of self-field and external field, for the latter we neglect magnetisation effects. As a consequence of the above assumptions, we get
| (5) |
Since the electric field is constant throughout the cross section, as well as depend on , and (5) is a local relation
| (6) |
which has been found to agree in the critical state with experimental results on spatial current distribution [5] and ac permeability measurements [10]. With (5) and (6) and Maxwell’s equation
| (7) |
, and can be calculated [4, 5, 7]. The pinning force density and the viscous drag coefficient depend on temperature via the upper critical field , for which we assume
| (8) |
The temperature dependencies and are entirely responsible for the temperature dependence of the resistivity . For ceramics, Kliem et al. found from measurements of the temperature dependence of the critical current [7] that
| (9) |
gave the best fit to the experimental data. Using a similar model, Kilic [6] found that the last exponent should be 1.5 in the case of thin films. For the temperature dependence of the viscous drag coefficient, we use
| (10) |
from the same reference [6]. Both and are independent of temperature.
The fluxon radius increases with temperature and the fluxon density increases with magnetic field strength. This can result in an overlap of normal conducting flux cores. Simultaneously the fluxon velocity and therefore the resistivity increase with temperature and magnetic field. Instabilities resulting from this are eliminated by the following assumption, which turns out to fit well to experiments: those parts of the sample’s cross section in which the resistivity caused by fluxon motion would exceed the normal state resistivity, become normal conducting. For a suitable choice of parameters, the resistivity curves in an Arrhenius plot fan out from the onset of metallic conductivity and are in segments linear. To reduce the number of parameters in our model calculations, we have assumed for the following. These are the assumptions that constitute what we refer to as the single phase model.
3.2 Two phase model
Taking into account the polycrystalline nature of sintered HTSC ceramics, we assume that the current flows through intergrain and intragrain regions and that these phases differ in fluxon mobilities. A relatively narrow transition in the intragrain phase and a broad transition in the intergrain phase lead to the observed leap-and-shoulder structure of the resistivity curves when we treat both phases as resistors connected in series, i. e., carrying the same current. Each of the phases is then treated separately according to the single phase model assumptions given above.
This is the simplest possible extension of the Lorentz force model to two phase ceramics. In this phenomenological approach, we do not make assumptions on what the grain boundaries look like or how grains are connected.
4 Comparison with experiment
| Quantity | Unit | Sample D | Sample B | Sample V |
|---|---|---|---|---|
| cross section | mm2 | |||
| at | A cm-2 | 32 | 38 | 36 |
| K | 86 | 88 | 88 | |
| intergrain fraction | 1:9 | 1:13 | 1:13 | |
| at | Nm-3 | 50 | 600 | 200 |
| (intergrain) | 15 | 6 | 6 | |
| (intragrain) | 1500 | 600 | 600 |
4.1 Self-field conditions
An analytical solution for exists for cylindrical cross section and self-field conditions. We have performed measurements on samples with square cross section and treated them for the model calculations as cylinders with the same cross section area.
The viscous drag coefficient determines the shape of the transition. Fig. 5 shows calculated resistive transitions in the single phase model, with parameters chosen to model the behaviour of sample D. We see how the curvature changes with increasing and how the curves in the Arrhenius plot start sagging, but the sharp inclination found in the experiment could not be rendered in single phase model calculations.
Fig. 3 shows a comparison of measurements and model calculations under self field conditions for two samples. Taking for the onset temperature of metallic conductivity and for the fraction of the intergrain phase in the sample the ratio , we have varied and in the intergrain and intragrain phase to fit the whole set of curves. The parameters are given in Table 1.
While the shoulder and the inclination point of the curves are modelled quite well, the roundness near the onset of metallic conductivity is not given correctly by the calculation. This is probably not caused simply by fluxon motion, but has physically different origin [11].
4.2 External magnetic fields
For a rectangular sample cross section and in external magnetic fields, the model calculation of was performed numerically by a self-consistent iterative computation of current density and magnetic field on an grid. We typically used and values of and started from a current distribution with constant density.
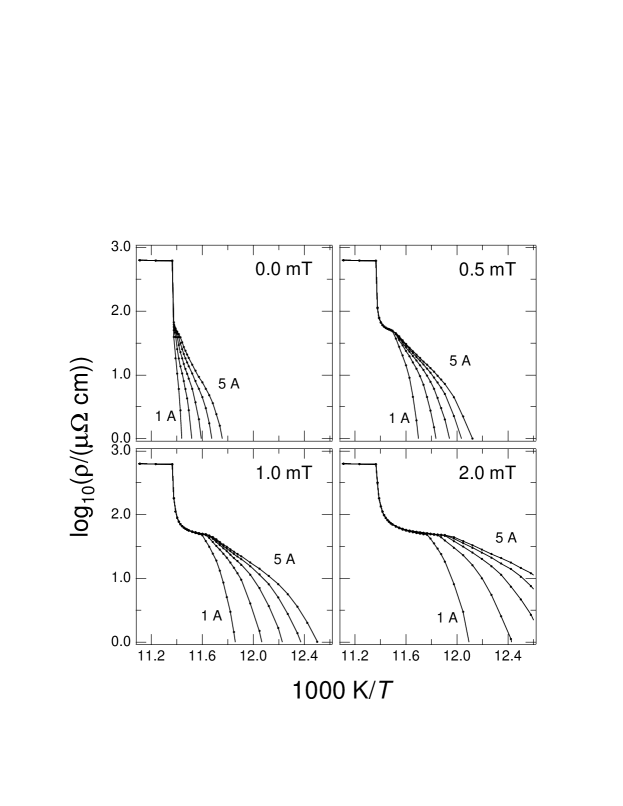
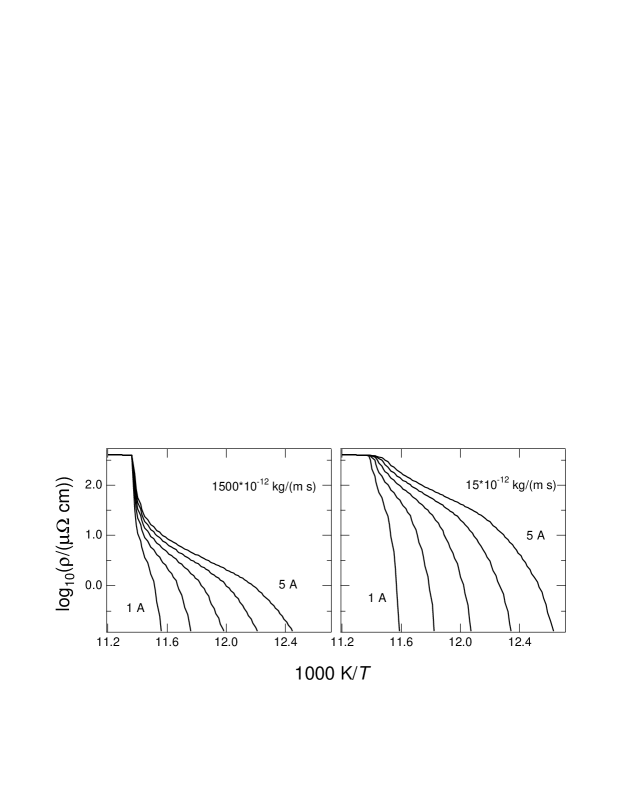
Fig. 6 shows the results of a model calculation for sample V with the parameter set (see Table 1) determined from the measurements and calculations under self-field conditions. Comparison of the calculations in fig. 6 with the experimental data in fig. 1 shows that the behaviour in external fields is reproduced without adding any further parameters to the model.
The agreement of the model calculations with the experiment is good, though for zero external field, the measured transition broadening is slightly larger than calculated. The model calculations, however, do not render the observed dependence from magnetic field orientation for rectangular cross section. This dependence might be caused by shielding effects leading to different macroscopic demagnetisation factors for both orientations.
A deviation from the model predictions for small external fields attributed to shielding effects was also found in measurements of the spatial distribution of the critical current [5].
5 Conclusion
We have demonstrated that a previously developed phenomenological model based on the concept of Lorentz force induced fluxon motion can be applied to the resistive transition of YBaCuO under self-field conditions as well as in (small) external fields. For very small fields, slight quantitative deviations from the model predictions occur which we attribute to shielding effects and which deserve further investigation. A simple two phase model allows the characterisation of YBaCuO ceramics by a pinning parameter, two fluxon mobilities, the onset temperature of metallic conductivity and the intergranular phase fraction. These parameters can be determined by comparison of the current dependent broadening of the resistive transition, obtainable in relatively simple transport measurements, to numerical model calculations. Even samples with similar onset temperature and critical current density can differ considerably in their resistive transition above the critical state, and our results show a way of describing and quantifying these different behaviours independent of the individual sample geometry.
Acknowledgements
We thank Dr. Knechtel (TU Hamburg-Harburg, AB Technische Keramik) for the preparation of YBaCuO samples.
References
- [1] T. T. M. Palstra, B. Batlogg, R. B. van Dover, L. F. Schneemeyer, and J. V. Waszczak. Critical currents and thermally activated flux motion in high-temperature superconductors. Appl. Phys. Lett., 54(8):763–765, February 1989.
- [2] Ernst Helmut Brandt. The flux-line lattice in superconductors. Rep. Prog. Phys., 58:1465–1594, 1995.
- [3] H. Kliem, A. Weyers, and J. Lützner. Self-field limited currents in ceramic YBaCuO. J. Appl. Phys., 69(3):1534–1537, February 1991.
- [4] A. Weyers, H. Kliem, J. Lützner, and G. Arlt. Critical currents in high- ceramics by force-induced fluxon movement. J. Appl. Phys., 71(10):5089–5093, May 1992.
- [5] S. Schatteburg, H. Kliem, and W. Bauhofer. Redistribution of local current densities in high- ceramics in external magnetic fields. J. Appl. Phys., 76(2):1116–1119, July 1994.
- [6] Atilla Kilic. Analysis of the current-voltage characteristics and transport critical current density of superconducting YBa2Cu3O7-δ in the self-field approximation. Supercond. Sci. Technol., 8:497–503, 1995.
- [7] H. Kliem, S. Schatteburg, and W. Bauhofer. Modelling the magnetic field and temperature dependence of critical currents in high- ceramics by force induced fluxon motion. Supercond. Sci. Technol., 9:849–851, 1996.
- [8] J. C. Abele, R. L. Bristol, T. C. Nguyen, M. W. Ohmer, and L. S. Wood. J. Mater. Res., 8:957, 1993.
- [9] A. C. Rose-Innes and E. H. Rhoderick. Introduction to Superconductivity. Pergamon Press, Oxford, second edition edition, 1978.
- [10] S. Gjølmesli and K. Fossheim. Ac permeability of Y123: Double intergranular loss reak and critical state bahaviour. In H. C. Freyhardt, editor, Applied Superconductivity, pages 791–794. DGM, 1993.
- [11] Makoto Hikita and Minoru Suzuki. Fluctuation conductivity and normal resistivity in YBa2Cu3Oy. Phys. Rev. B, 41(1):834–837, January 1990.