[
New Far Infrared Vibrational Mode in Zn Doped CuGeO3
Abstract
We report on far infrared measurements on Zn and Si doped crystals of the spin-Peierls compound CuGeO3. Zn doping has the effect of introducing several new absorption lines, polarized in the -plane, between 5 and 55 cm-1. The intensity of the absorption grows with Zn concentration but saturates above 2 % Zn. One line at 10 cm-1 loses intensity above 4 K, and a second line at 20 cm-1 is absent at low temperatures but grows to peak at about 40 K in agreement with a three level model with two excited states 10 and 30 cm-1 above the ground state. As the doping is increased these lines broaden, and a temperature independent absorption develops over the entire range from 5 to 55 cm-1. These features are magnetic field independent up to 16 T and are absent in Si doped samples. We suggest the new absorption is due to localized lattice modes of the zinc ion and the surrounding GeO4 tetrahedra.
pacs:
PACS numbers: 75.50.Ee, 78.30.Hv, 63.20.Pw]
The quasi-one-dimensional antiferromagnet CuGeO3 is the first inorganic compound to show a spin-Peierls (SP) transition[2]. At K a gap opens in the excitation spectrum of the Cu spins as a result of magneto-elastic coupling. In general, such transitions involve a lowering of magnetic energy at the expense of lattice energy. Structures where large tightly bound blocks can move as units, such as the organic charge transfer complexes, exhibit the spin-Peierls phenomenon. Similar structural units occur in oxides in the form of rigid GeO4 or SiO4 tetrahedra bonded weakly to each other to form easily distorted structures[3]. It has been found that in CuGeO3 the SP transition involves both a dimerization of the copper ions along the c-axis and a rotation of the GeO4 tetrahedra about the c-axis[4]. In this paper we present the results of a far infrared transmission study of Zn and Si doped CuGeO3. Our results show that Zn substitution for Cu induces new absorption lines at 10 and 20 cm-1. We show that these transitions result from a very unusual, highly anharmonic localized vibrational mode.
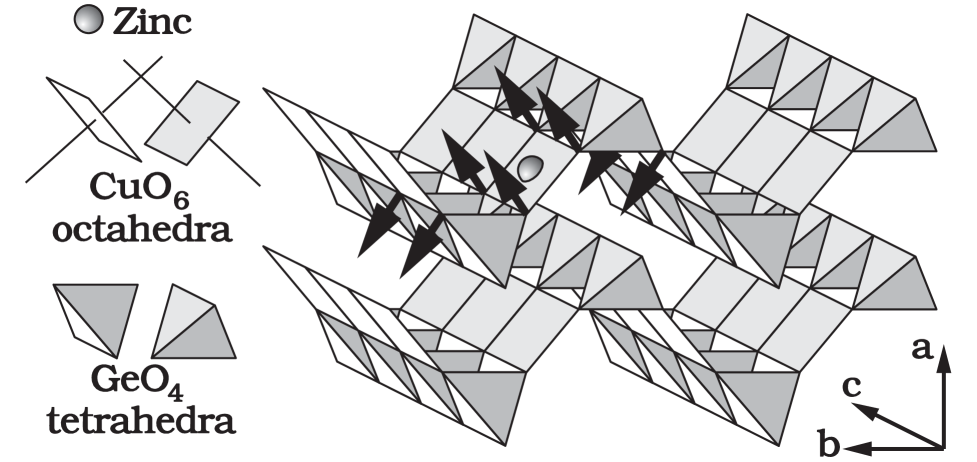
The lattice structure of CuGeO3 is shown in Fig. 1. It consists of chains of relatively rigid GeO4 tetrahedra along the c-axis. Cu2+ ions are positioned between these chains and form chains of CuO6 octahedra which share the GeO4 oxygens. Adjacent octahedra share two oxygens which provide a superexchange path for the antiferromagnetic interaction between Cu2+ ions.
The far infrared absorption spectrum of pure CuGeO3 has a weak absorption line in the SP phase at 44 cm-1 [5] which corresponds to the SP gap energy ( meV) at of the magnetic Brillouin zone as determined by electron spin resonance[6]. The line splits in a magnetic field as expected for a transition from the ground singlet state to the excited triplet state. The other low-lying spectral feature is a weak phonon at 48 cm-1 suggested to correspond to a displacement of the four planar oxygens in the direction of the apical oxygens in the CuO6 octahedra[7].
Doping of CuGeO3 with Zn or Si is particularly interesting because it results in an antiferromagnetic (AF) phase that seems to coexist with the SP phase in a range of temperatures and doping levels in Cu1-xZnxGeO3[8, 9, 10, 11, 12] and in CuGe1-xSixO3[13, 14, 15]. There are, to our knowledge, no measurements of the far infrared spectrum of the doped systems of CuGeO3.
We studied several single crystals including an undoped sample, a Si doped sample with , and a series of Zn doped samples with and . The Néel and SP transition temperatures, and , were determined from magnetic susceptibility measurements on the same crystals. The , 0.02 and undoped samples were grown by a floating zone technique and the and 0.05 samples by a self flux method. We used either atomic emission spectroscopy or mass spectroscopy to determine the Zn and Si concentrations and found good agreement with phase diagrams[9, 12, 13] for and vs. concentration .
The far infrared measurements were done with a home-built polarizing Fourier spectrometer[16] and a new magnet insert with an in situ 3He cooled ( K) silicon bolometer. Polarization-dependent transmission measurements were done in magnetic fields up to 16 T from 3 to 100 cm-1 and in the temperature range from 1.2 to 100 K. Sample sizes were about mm3 in the directions of the a, b and c crystallographic axes[17] respectively. The k-vector of the light was aligned along the a-axis (ka). To establish the symmetry of the transitions, additional measurements were done with kb for one of the Zn doped samples (). The dc magnetic field was in the direction of light propagation (Faraday geometry), and most of the spectra were measured at 1 cm-1 resolution. To calculate the absorption coefficient from the transmittance it is necessary to estimate the refractive index. We used the interference fringes from a thin sample with parallel faces to do this. A constant value of was determined for the entire range from 3 to 100 cm-1.
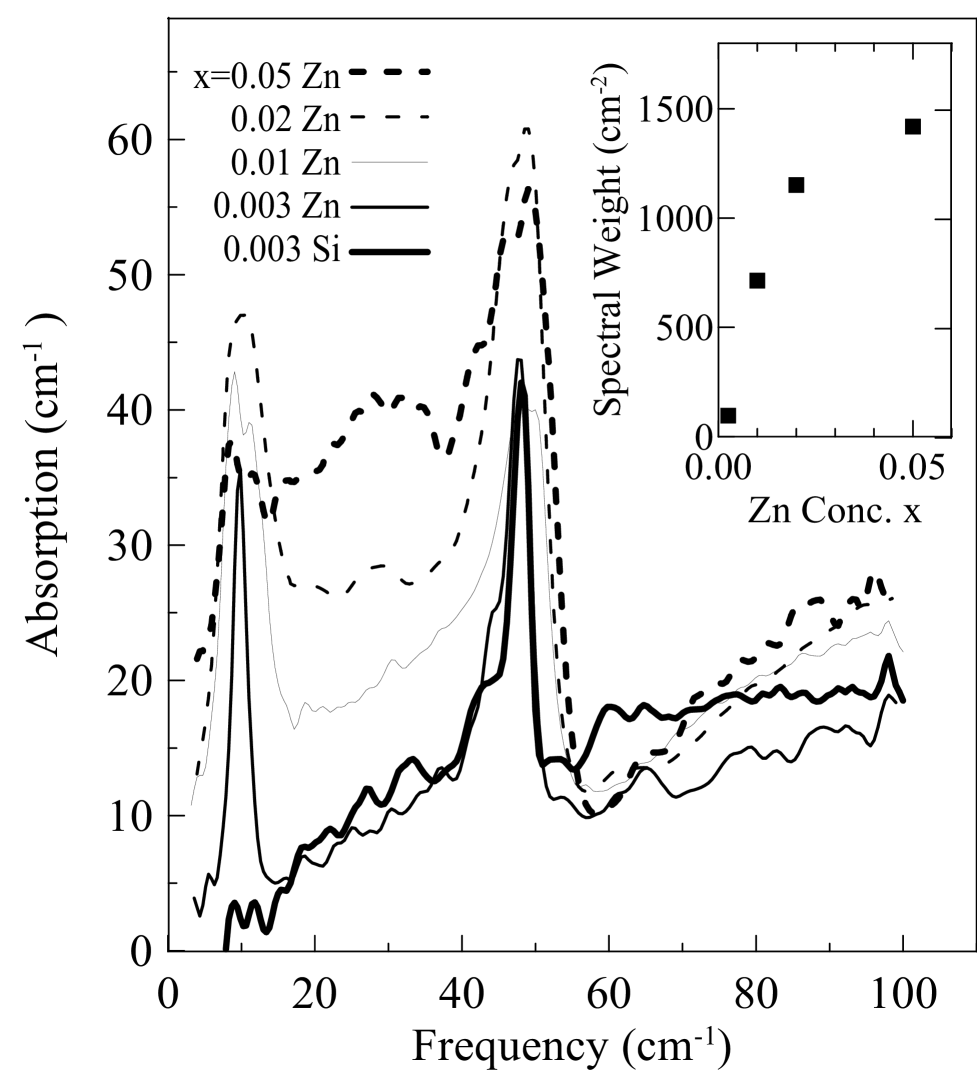
The absorption spectra for several samples at 1.2 K are shown in Fig. 2. The sample doped with Si is very similar to the undoped sample (not shown) in that the only far infrared features are the line at 48 cm-1 which has been identified as a phonon[7], and the shoulder at 44 cm-1 due to the singlet to triplet transition[5]. In contrast, the Zn sample shows, in addition to these features, a line at 10 cm-1 which is not present in the Si doped sample (or in the undoped samples). Increased doping results in a broadening of the 10 cm-1 line and the development of a broad absorption band between 5 and 55 cm-1. The variation of the spectral weight[18] from 3 to 60 cm-1 (background and phonon line subtracted) is shown in the inset to Fig. 2 as a function of concentration. The dependence on Zn concentration appears to be linear at low concentrations but quickly saturates above .
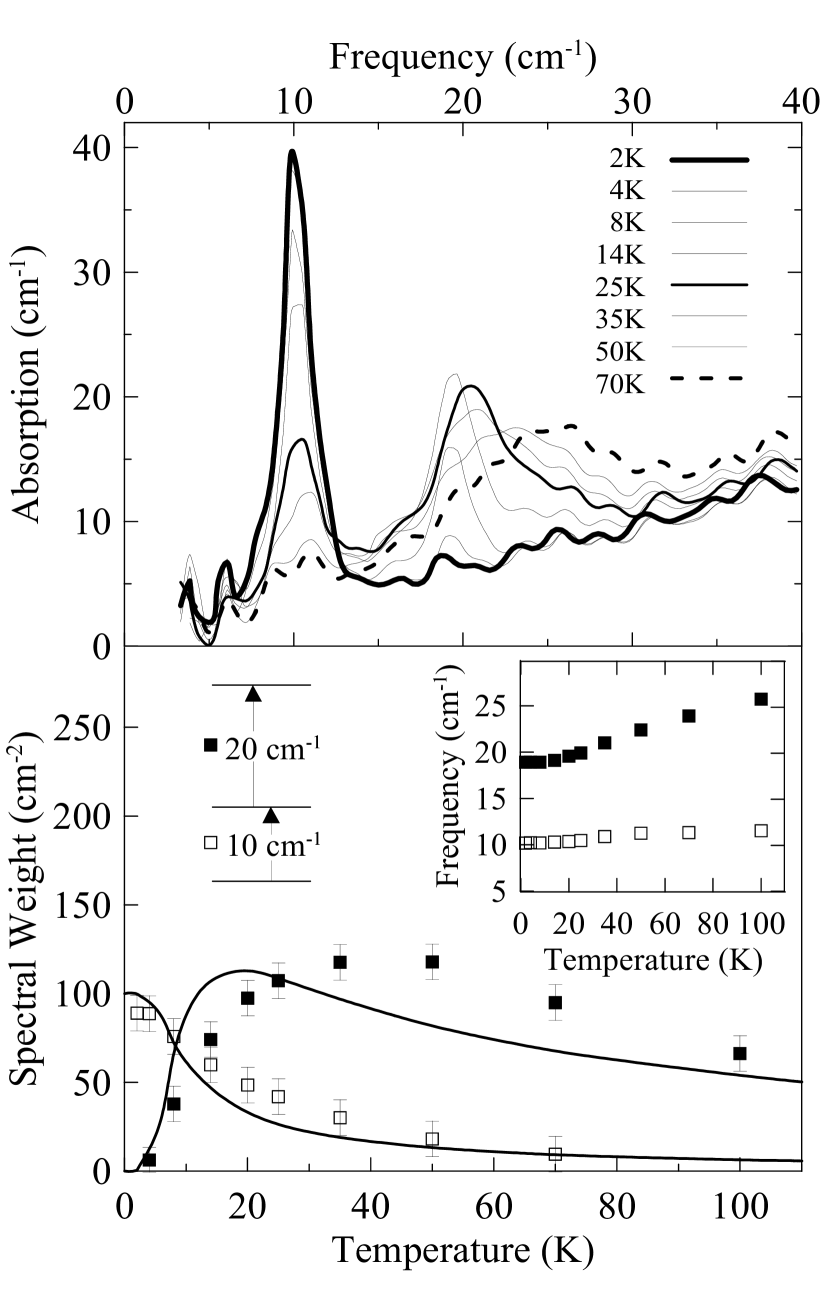
Absorption spectra for the Zn doped sample were also obtained at higher temperatures. While the shoulder at 44 cm-1 disappears above the SP transition temperature as expected, the 10 cm-1 line and another line at 20 cm-1 show a temperature dependence that has no obvious relationship to the SP transition. The spectra are shown in the upper panel of Fig. 3, and the lower panel shows the spectral weight of the 10 and 20 cm-1 lines as functions of temperature. The 10 cm-1 line loses intensity as temperature is increased, but the 20 cm-1 line, which is absent at low temperatures, grows in intensity to peak around 40 K. Both lines shift to higher frequencies with temperature (inset to Fig. 3), and the 20 cm-1 line broadens significantly. Although the 10 and 20 cm-1 lines are broader in the more highly doped samples, they still show this temperature dependence. The broad absorption from 5 to 55 cm-1 in samples with is temperature independent up to 100 K.
The temperature dependence of the 20 cm-1 line suggests that it is a transition from an excited state. A simple three level model with two excited states 10 and 30 cm-1 above the ground state accounts for the temperature dependences of the line intensities in the lower panel of Fig. 3. The trends in the data are correctly reproduced, and the quality of the fit, though not particularly good, can be improved by adding higher energy levels to the model. This points to a multilevel, very anharmonic excitation, which is made possible by the replacement of a Cu2+ ion with Zn2+, but not by the substitution of Si for Ge.
The polarization dependence of the new features was also obtained. With ka, the 10 and 20 cm-1 lines as well as the 5 to 55 cm-1 band were strongest when the electric field was along the b-axis (-polarization) and nearly absent with -polarization. When the Zn sample was oriented with kb, the features were strongest with -polarization. Thus, if these are magnetic dipole transitions, they require that the magnetic field component of the light is along the c-axis. If they are electric dipole transitions, the electric field must be in the -plane and have components both in the a and b directions.
To exclude magnetic dipole transitions we compare the spectral weight of the Zn-induced absorption with that of a known magnetic dipole transition in our system. An incommensurate phase exists in CuGeO3 above T[19, 20] where a magnetic dipole transition in the triplet ground state can be observed[5]. We find this transition (at 15 cm-1 in Fig. 4) to be independent of polarization in the -plane ( T along the a-axis) as expected for an , transition and to have a spectral weight of 2.5 cm-2. The spectral weight of the 10 cm-1 line is 100 cm-2, a factor of 40 larger than the magnetic dipole transition. This discrepancy, which is even larger if we include the dilution due to low Zn concentration, in combination with the fact that the frequency of the Zn-induced absorption is not affected by magnetic field up to 16 T, leads us to conclude that it is not a magnetic dipole transition.
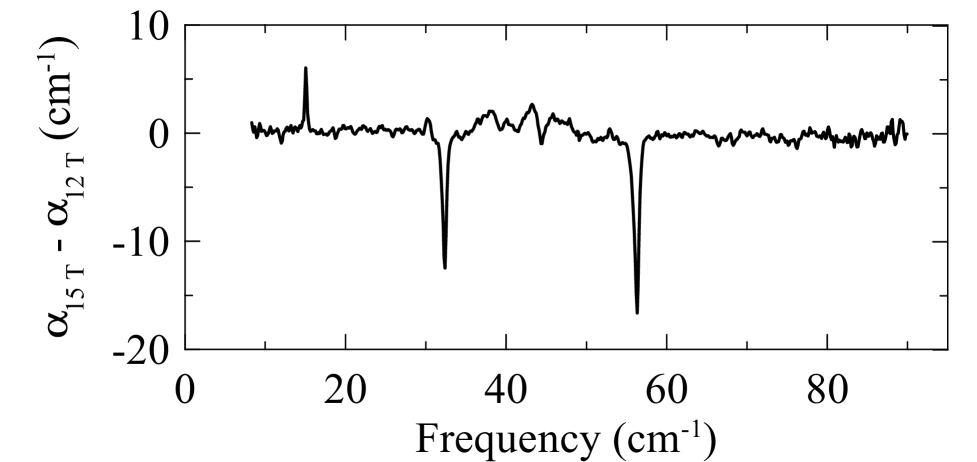
We can also rule out forbidden electronic electric dipole transitions such as the transition in the SP phase from the singlet ground state to the excited triplet state which produces the 44 cm-1 line. That line splits in a magnetic field as shown in Fig. 4 due to the splitting of the excited triplet state. It is also ten times stronger than the magnetic dipole transition at 15 cm-1, and as our study has shown, is induced when ka with -polarization only. If the Zn induced features are electronic electric dipole transitions, it is unclear which states could be involved. Since they are not split by a magnetic field, they are unlikely to involve transitions to or from triplet states. In-gap states, predicted by Martins et al.[21], are also excluded because they would be absent above the SP transition temperature.
Local vibronic modes are another possibility. For a pure Zn translational mode for Zn we estimate a spectral weight of 530 cm-2 from the plasma frequency cm-1 where is the Zn concentration, the mass of the Zn ion and the effective charge which we take to be +2. This is over 5 times larger than the observed spectral weight. It is therefore likely that the mode also involves motion of other atoms.
The three level system shown in Fig. 3 can be modeled with a square well with a central barrier. Appropriate choice of parameters gives levels at 10, 30 and 55 cm-1. Electric dipole transitions between levels of opposite parity will give lines at 10, 20, 25 and 55 cm-1. The line at 25 cm-1 is weak at the temperatures investigated because the population of the 30 cm-1 level is small, and the 55 cm-1 line is weak because of the small transition matrix element from the ground state to the 55 cm-1 level. In general, the addition of the level at 55 cm-1 will improve the agreement between the calculated and observed temperature dependance of the line intensities shown in lower panel of Fig 3. The broadening of the 10 and 20 cm-1 lines with increased doping can be explained as being due to long range of interaction between the defects.
The combination of a low intensity, a flat very anharmonic potential and a polarization in the -plane suggests that the lines at 10 and 20 cm-1 involve the Zn defect and the libration about the c-axis of the surrounding four GeO4 tetrahedra as shown in Fig. 1. In the undoped material the 48 cm-1 phonon is a similar mode which is optically active[7] and involves the motion of the Cu in the direction of the apical oxygens. With Cu replaced by Zn this mode would have a polarization with both a and b direction components and is consistent with the model of a potential well with a central barrier. Since Zn is known to favor a higher coordination number than Cu it will have a tendency to move off center towards one of the apical oxygens.
Libration of GeO4 tetrahedra is also a component of the static SP distortion in the undoped material[4, 22], but it is not optically active since it involves odd combinations of the rotations of the GeO4 tetrahdra and no displacment of the copper in the -plane. In our picture the Zn doping has the effect of moving the mode at 48 cm-1 to 10 cm-1 by a dramatic reduction of the already weak restoring force for diplacements of the the planar oxygens in the direction of the apical oxygens around the Zn.
In contrast to the large changes in dynamics by Zn doping, the replacement of Ge by Si will have the minor effect of reducing the size of one of the tetrahedra affecting four Cu sites equally and, by symmetry, giving rise to a low frequency optical mode polarized in the b direction. We have not observed such a mode in our Si doped samples from 3 to 100 cm-1.
One feature which remains to be explained is the 5 to 55 cm-1 band seen at higher doping levels. Its lower boundary is approximately defined by the 10 cm-1 line, and the upper boundary more or less coincides with the phonon at 48 cm-1. The saturation of the absorption above a concentration of (inset to Fig. 2) is reminiscent of the phase diagram[9, 12] in which and stop changing at this same concentration. This may be evidence for an upper limit for effective doping. Another possibility, suggested by the unusual flat shape of the band, is that it represents a disordered state of the local excitations as they begin to interact strongly at Zn and above. This state may also be relevant to the saturation of and at the same doping level.
In summary we have observed a low lying lattice mode in Zn doped CuGeO3 which we idenify with the librational motion of GeO4 tetrahedra combined with the displacment of Zn in a very flat potential with a central barrier.
We acknowledge fruitful discussions with J. Barbier, D.B. Brown, B. Gaulin, and J.E. Greedan. The work at McMaster University and the University of Toronto was supported by NSERC of Canada and The Canadian Institute for Advanced Research. Work on correlated magnetic systems at Warwick is supported by a grant from the EPSRC of UK.
REFERENCES
- [1] Permanent address: Institute of Chemical Physics and Biophysics, Akadeemia tee 23, Tallinn EE0026, Estonia.
- [2] M. Hase, I. Terasaki, and K. Uchinokura, Phys. Rev. Lett. 70, 3651 (1993).
- [3] K. D. Hammond, H. Deng, V. Heine, and M. T. Dove, Phys. Rev. Lett. 78, 3701 (1997).
- [4] K. Hirota et al., Phys. Rev. Lett. 73, 736 (1994).
- [5] P. H. M. van Loosdrecht et al., Phys. Rev. B 54, R3730 (1996).
- [6] T. M. Brill et al., Phys. Rev. Lett. 73, 1545 (1994).
- [7] Z. V. Popović et al., Phys. Rev. B 52, 4185 (1995).
- [8] J. G. Lussier, S. M. Coad, D. F. McMorrow, and D. McK. Paul, J. Phys.-Cond. Matter 7, L325 (1995).
- [9] Y. Sasago et al., Phys. Rev. B 54, R6835 (1996).
- [10] M. Hase et al., J. Phys. Soc. Jpn. 65, 1392 (1996).
- [11] P. Fronzes, M. Poirier, A. Revcolevschi, and G. Dhalenne, Phys. Rev. B 55, 8324 (1995).
- [12] M. C. Martin et al., Phys. Rev. B submitted (1997).
- [13] J. P. Renard et al., Europhys. Lett. 30, 475 (1995).
- [14] L. P. Regnault, J. P. Renard, G. Dhalenne, and A. Revcolevschi, Europhys. Lett. 32, 579 (1995).
- [15] M. Poirier et al., Phys. Rev. B 52, R6971 (1995).
- [16] Design of the far infrared spectrometer will be published later.
- [17] H. Völlenkle, A. Wittmann, and H. Nowotny, Monatsh. Chem. 98, 1352 (1967).
- [18] We define spectral weight (in units of cm-2) as where the absorption constant , the frequency and the plasma frequency are in units of cm-1 and is the index of refraction.
- [19] M. Hase, I. Terasaki, and K. Uchinokura, Phys. Rev. B 48, 9616 (1993).
- [20] V. Kiryukhin et al., Phys. Rev. B 54, 7269 (1996).
- [21] G. B. Martins, E. Dagotto, and J. Riera, Phys. Rev. B 54, 16032 (1996).
- [22] M. Braden et al., Phys. Rev. B 54, 1105 (1996).