[
First-principles and semiempirical calculations for centers in KNbO3
Abstract
The linear muffin-tin-orbital method combined with density functional theory (local approximation) and the semiempirical method of the intermediate neglect of the differential overlap (INDO) based on the Hartree-Fock formalism are used for the study of the centers (O vacancy with two electrons) in cubic and orthorhombic ferroelectric KNbO3 crystals. Calculations for 39-atom supercells show that the two electrons are considerably delocalized even in the ground state of the defect. Their wave functions extend over the two Nb atoms closest to the O vacancy and over other nearby atoms. Thus, the center in KNbO3 resembles electron defects in the partially-covalent SiO2 crystal (the so-called center) rather than usual centers in ionic crystals like MgO and alkali halides. This covalency is confirmed by the analysis of the electronic density distribution. Absorption energies were calculated by means of the INDO method using the self-consistent-field scheme after a relaxation of atoms surrounding the center. For the orthorhombic phase three absorption bands are calculated to lie at 2.72 eV, 3.04 eV, and 3.11 eV. The first one is close to that observed under electron irradiation. For the cubic phase, stable at high temperatures, above 708 K, only the two bands, at 2.73 eV and 2.97 eV, are expected.
pacs:
PACS numbers: 77.84.Dy, 71.15.Fv, 71.10.-w, 77.80.Bh]
I Introduction
Due to its technological importance potassium niobate, KNbO3, a perovskite-type ferroelectric material, has lately been subject to numerous ab initio electronic structure calculations. In the cubic KNbO3 crystal each O atom is surrounded by four K atoms, two Nb atoms and eight next-nearest O atoms. Many of the calculations were based on the local density approximation (LDA) combined either[1, 2] with the linearized muffin-tin orbital (LMTO)[3] or with the pseudopotential method [4, 5] as well as with the linearized augmented plane wave[6, 7, 8] (LAPW) scheme.
Complementary to this approach is the Hartree-Fock (HF) formalism. Compared to the LDA, the HF scheme has the advantage of the exact treatment of exchange interactions. Recent implementations have no restrictions on the spatial form of the potential, no potential effects due to use of muffin-tin boundary conditions and/or space-packing empty spheres. It gives the effective charges and suggests a bond-population analysis between pairs of atoms, and last, it allows one easily to perform the calculation of excited states and optical absorption energies.
Since such calculations are quite time consuming, there exist only a few HF studies for perovskite systems; see, for example, the cluster calculations of Ref.[9]. Instead, a simplified (semiempirical) version of the HF method widely known as intermediate neglect of the differential overlap[10, 11] (INDO) has been applied successfully to calculations for many oxide crystals, including MgO, [12] -Al2O3 (corundum),[13] and TiO2.[14] In recent studies of pure KNbO3 and KTaO3 crystals [15, 16] their electronic structure and equilibrium ground-state structure for several ferroelectric phases as well as -phonon frequencies were reproduced in surprisingly good agreement with both LDA calculations and available experimental data.
It is well understood now that point defects play an important role in the electro-optic and nonlinear optical applications of KNbO3 and related materials.[17] In particular, reduced KNbO3 crystals containing oxygen vacancies reveal short-pulse excitations which could be used for developing fast optical correlators. [18] Its use for light frequency doubling is seriously affected by presence of unidentified defects responsible for induced IR absorption. [19] The photorefractive effect, important in particular for holographic storage, is also well known to depend on the presence of impurities and defects.
One of the most common defects in oxide crystals is the so-called center, an O vacancy which traps two electrons. [20] In electron-irradiated KNbO3 a broad absorption band is observed around 2.7 eV at room temperature and tentatively ascribed to centers [21] (see also Ref. [22]). This defect is also of theoretical interest for two reasons.
(i) Due to a low local symmetry of the O sites in the lattice, the threefold-degenerate -type excited state could be split into several levels responsible for several absorption bands. This effect has been observed a long time ago for the centers in corundum, but theoretically it was examined[23] only very recently. Upon cooling from a high temperature, KNbO3 undergoes a sequence of phase transitions from a paraelectric cubic phase to ferroelectric tetragonal phase (at 708 K), then to the orthorhombic structure (at 498 K), and finally to the rhombohedral (at 263 K) phase. The atomic positions in all these phases have been determined experimentally. [24] Under these phase transitions the local symmetry of the O vacancy also changes, which can, in principle, affect the optical properties of the centers. This problem has never been addressed.
(ii) Qualitative theoretical analyses of the centers in perovskites predict the effect of the symmetry breaking of one-electron orbitals associated with the asymmetric electron density delocalization over the two Nb atoms closest to the O vacancy: Nb1––Nb2. [25]
To answer these questions, as well as to check the assignment of the 2.7 eV absorption band, we study in the present paper the center in KNbO3 using the supercell model and two different theoretical techniques: full-potential LMTO and INDO.
The paper is organized as follows. In Sec. II we describe the essential features of the methods used. In Sec. III we discuss the main findings obtained for the ground-state properties of the center while Sec. IV describes the absorption energies calculated by means of the INDO method for two different (the cubic and orthorhombic) phases. Last, the main results are summarized in Sec. V where results obtained by the two (quite different) methods are compared, and the effect of chemical bonding covalency on the center properties is discussed.
II Methods used
A Local density approximation
Even the crudest approximation, the LDA, to the density functional theory has been successfully applied to predict structural and dynamical properties of a large variety of materials. Equilibrium volumes, elastic constants, phonon frequencies, surface reconstruction, and magnetism are just some examples of properties which could be successfully calculated for systems without particularly strong electron correlations within the LDA (or LSDA, the local spin-density approximation). The LDA usually leads to some overbinding in solids (equilibrium volumes are typically 1-3 % underestimated).
The LDA calculations for KNbO3 performed in Ref. [1] yield an equilibrium volume which is 5% too small, indicating that the LDA overbinding in this case is not considerably exceeding the “acceptable” limits. This is why in the present paper, although one may expect that a more accurate treatment of correlation effects may be needed for some ionic compounds,[26] we apply the LDA to the center in KNbO3. The LDA exchange-correlation contribution is accounted for by means of Perdew and Zunger’s parametrization [27] of the calculations by Ceperley and Alder.[28]
The self-consistent solution of the one-electron equation is performed by means of the LMTO method.[3] We have used the “atomic-spheres-approximation”[3] (ASA) as well as a “full-potential formalism”[29] (LMTO-FP). Whereas the LMTO-ASA uses potentials and charge densities that are made spherically symmetric inside (slightly) overlapping atomic spheres, no shape approximations are made in the LMTO-FP. The atomic relaxations around the center cannot be calculated by means of the ASA. We therefore performed the structural optimization by minimizing the LMTO-FP total energy calculated for a supercell. A similar method was used in earlier LMTO-FP simulations of defects in KCl (Ref. [30]) and MgO.[31] The supercell used in the present work contains 40 atoms for the perfect KNbO3 (8 formula units) and 39 atoms plus one empty sphere in the center case.
B INDO
The INDO calculation scheme and the computer code CKUSTERD were discussed in detail in Refs.[10, 11] and [15]. With this code it is possible to perform both cluster and periodic system calculations containing hundreds of atoms as well as to carry out automated geometry optimization which is especially important in defect calculations. In the periodic calculations the so-called large unit cell (LUC) model is used. [32] Its idea is to perform the electronic structure calculations for an extended unit cell at the wave vector k=0 in the narrowed Brillouin zone (BZ) which is equivalent to band calculations at several special points of the normal BZ, transforming to the narrow BZ center after the corresponding extension of the primitive unit cell. In the KNbO3 case the unit cell contains five atoms whereas the extended (super)cell consists of 40 atoms. A detailed analysis of the KNbO3 parametrization for the INDO method is presented in Ref.[15]. In that work considerable covalency was found of the chemical bonding in pure KNbO3. The effective charges found from Mulliken population analysis are (in units of ) for K, for Nb, and for O, which is very different from the expectation of the generally accepted model: +1, +5, and 2, respectively. This is in agreement with the effective atomic charges found in an experimental study of LiNbO3.[33] Our results emphasize a high degree of covalency of the Nb-O bond as may be expected from intuitive electronegativity considerations and the fact of a strong overlap between O and Nb orbitals and partial densities of states. We discuss below how covalency of the chemical bonding may have important consequences for the physics of defects in ferroelectrics, in particular for the centers.
To simulate centers, we started with a 40-atom supercell with one of the O atoms removed. In the cubic phase all O atoms are equivalent and have local symmetry C4v whereas in the orthorhombic phase there are kinds of nonequivalent O atoms whose symmetry is lower, or (see below). After the O atom is removed, the atomic configuration of surrounding atoms is reoptimized via a search of the total energy minimum as a function of the atomic displacements from regular lattice sites. Calculation of the adiabatic energy curves for the ground and excited states permits us to find the optical absorption energy using the so-called self-consistent-field (SCF) procedure according to which the sought for is the difference of the total energies for the ground and excited state with the defect geometry of the ground state unchanged (vertical optical transition).
To extend the basis set in the center calculation, additional 1, 2 atomic orbitals were centered on the O vacancy. Their parameters were chosen close to those used in the center calculations in MgO crystal:[34] the orbital exponent ()=0.65 (a.u.-1), ()=0.50 (a.u-1), the relevant electronegativities are zero () and 3 eV (), and the bonding parameters =0 for both and orbitals, respectively. During the defect geometry optimization, we make no a priori assumptions on the electron density distribution.
III ground-state properties
A LDA calculations
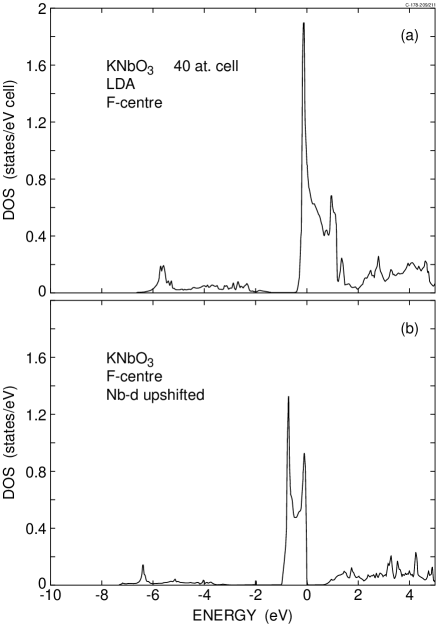
The band structure as derived from the straight LDA underestimates the gap between occupied and empty states. Since the supercell which we use is rather small (40 atomic sites), the defect states form a band of a finite width (0.8 eV). These two effects cause the defect band to overlap with the conduction band, and the supercell calculations within the LDA predict KNbO3 with the centers to be a metal. This is seen from Fig. 1(a). This affects the charge distribution. The number of electrons in the vacancy ’‘atomic sphere” is 0.24, much smaller than obtained from the INDO (0.6; see below). We can artificially increase the gap by applying an upshift in each iteration to the Nb states. Figure 1(b) shows such a calculation, and now the defect band lies completely within the gap. The energy scale was chosen so that the top of the defect band (the highest occupied state) is at =0. The band plot, Fig. 2 also shows that the defect band disperses over 0.8 eV due to the small supercell size. After adjustment of the gap the (self-consistent) calculation yields 0.6 electrons inside the O vacancy sphere, i.e., more than twice the amount found before and very close to the INDO calculation for the relaxed structure. When relaxations (see below) are included, the LMTO calculation yields a lower electron number in the vacancy sphere. This is simply caused by the outward motion of the nearest neighbors (Nb).

| Atom | Lattice coordinates | Displacement | ||
|---|---|---|---|---|
| without additional AO | ||||
| Nb | 0 | 0 | () | |
| K | () | () | 0 | , |
| O | () | 0 | () | , |
| O | 0 | () | () | , |
| with additional AO | ||||
| Nb | 0 | 0 | () | |
| K | () | () | 0 | , |
| O | () | 0 | () | , |
| O | 0 | () | () | , |
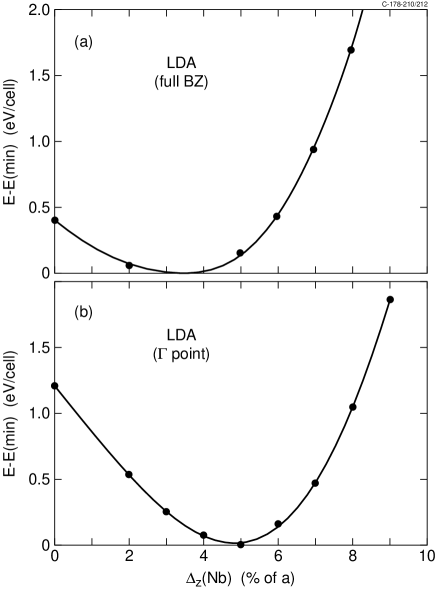
The relaxation of atoms surrounding the center was first calculated within the LDA without any attempt to correct for the effect of the overlap between the defect state band and the conduction band. First, the nearest-neighbor Nb atoms were relaxed, and the result is illustrated in Fig. 3(a) which shows the total energy as a function of the outward displacement, , of the Nb atom from its equilibrium position in the bulk crystal. The relaxed atomic positions correspond to =3.5% of the lattice constant of =4.016 Å. This is about half the relaxation found in the INDO calculation (see below). Further, the relaxation energy found here, 0.5 eV, is much smaller than the value of 3.7 eV obtained in the INDO calculation.
We do not wish to rely on total energy calculations where we applied 2.5 eV upshift to the Nb bands. However, self-consistent calculations using supercells large enough for obtaining a small width of the defect band nonoverlapping with the LDA conduction band are impractical. An approximate calculation was instead made of using the same supercell size as before but sampling only the point of the BZ in the k-space integration. This is the point where the defect band has its minimum energy and lies inside the gap, even in the LDA calculation. Further, this sampling is the same as used in the INDO calculation described below [the so-called large unit cell (LUC) model]. As expected, this changes the charge distribution and the atomic relaxations. The value of = 4.8% [Fig. 3)(b)] is closer to that obtained in the INDO calculation. The relaxation energy 1.2 eV is also somewhat closer to the INDO result.
| Atom | ||||||||
|---|---|---|---|---|---|---|---|---|
| Perfect crystal | ||||||||
| K | 0 | 0 | ||||||
| Nb | 0 | |||||||
| O | 0 | 0 | ||||||
| O | ||||||||
| O | ||||||||
| centers of symmetry: no additional AO | ||||||||
| Nb(I) | 0 | |||||||
| Nb(II) | 0 | |||||||
| centers of symmetry: with additional AO | ||||||||
| Nb(I) | 0 | |||||||
| Nb(II) | 0 | |||||||
| centers of symmetry: no additional AO | ||||||||
| Nb(I) | ||||||||
| Nb(II) | ||||||||
| centers of symmetry: with additional AO | ||||||||
| Nb(I) | ||||||||
| Nb(II) | ||||||||
B INDO
1 Cubic phase
The positions of 14 atoms surrounding the center in a cubic phase after lattice relaxation to the miminum of the total energy are given in Table I for the two cases of with an additional atomic orbital (AO) on vacancy site, and without the AO. The conclusion is that the largest relaxation is exhibited by the two nearest Nb atoms which are strongly (by 6.5% of a0) displaced the O vacancy along the axis. This is accompanied by a much smaller, 0.9% outward displacement of K atoms and by a 1.9% inward displacement of O atoms. The two Nb atoms give the largest ( 80%) contribution to the lattice relaxation energy (3.7 eV) whereas O atoms give the most of the rest energy gain of 1 eV.
The analysis of the effective charges of atoms surrounding the center shows that of the two electrons associated with the removed O atom only is localized inside and a similar amount of the electron density is localized on the two nearest Nb atoms. The center produces a local energy level, which lies 0.6 eV above the top of the valence band. Its molecular orbital contains primarily contribution from the atomic orbitals of the two nearest Nb atoms.
2 Orthorhombic phase
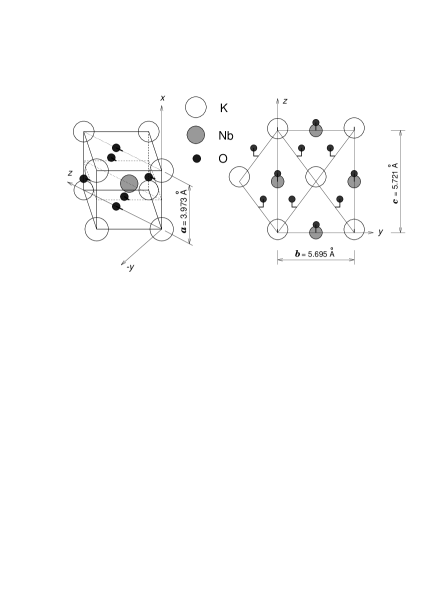
The orthorhombic phase of KNbO3 is important since it is stable in a broad temperature range around room temperature and thus is subject to most studies and practical applications. The atomic positions for the orthorhombic cell shown in Fig. 4 were calculated earlier [15] and included in Table II. Their agreement with the experimental data [24] is very good.[15]
The displacements of Nb atoms nearest to are given in the same Table II for the both kinds of centers existing in this phase and, again, with and without atomic orbitals centered at the O vacancy. In fact, Nb displacements are very similar in magnitude (6.6%) and also close to those found for the cubic phase. The relevant relaxation energies are considerable (3.6 eV) and nearly the same as that for Nb relaxation found in the cubic phase.
IV Optical properties
Because of the local symmetry of the centers in the KNbO3 cubic phase, its excited state splits into two levels, one of which remains twofold degenerate. Our SCF calculations predict the two relevant absorption bands: at 2.73 eV and 2.97 eV (Table III). Neglect of the additional orbitals centered on the slightly affect this result, the relevant absorption energies turn out to be 2.67 eV and 3.02 eV, respectively.
| Symmetry, phase | ||||
|---|---|---|---|---|
| , cubic | 2.73 | 2.97 | – | 3.7 |
| , orthorhombic | 2.56 | 3.03 | 3.10 | 3.6 |
| , orthorhombic | 2.72 | 3.04 | 3.11 | 3.6 |
Around room temperature in the orthorhombic phase there exist two kinds of centers associated with two non-equivalent O atoms revealing the and symmetry; cf. Table II. The corresponding three absorption bands for each of them are shown in Table III. Their difference is the largest for the lowest-energy bands (0.16 eV) and very small for other two bands.
V Summary
Our results are in a sharp contrast with what is known for centers in ionic crystals (in particular, in MgO and alkali halides [13, 20]) where the two electrons are well localized by the in the center ground state. Evidently, this discrepancy arises from a considerable degree of covalency of the chemical bonding in KNbO3 which is neglected in all previous models of defects in this material (as well as similar ABO3 perovskites, e.g. Refs. [35, 36]); the only exception known to us is an cluster calculation of centers in LiNbO3. [37]
Electron defects similar to what we have observed here are known, in particular, in partly covalent SiO2 crystals (e.g., in the so-called center an electron is also not localized inside but its wave function mainly overlaps with the orbital centered on the neighboring Si atom [38]).
We found that the ground state of the center is associated with a strong relaxation of the two nearest Nb atoms outwards relative to the O vacancy. These Nb atoms remain to be identical; i.e., we did not see formation of dipole moments of the Nb1--Nb2 type, as suggested in Ref. [25]. Note that the relevant relaxation energy is several eV which is typical for many point defects in ionic and partly ionic solids. Its magnitude is by several orders of magnitude larger than the tiny energy gain due to the phase transitions (meV per cell).
We presented a strong argument that the 2.7 eV absorption band observed in electron irradiated crystals [21] could be due to the centers, and predicted existence of two additional absorption bands (at 3.04 eV and 3.11 eV) for the same defect in the orthorhombic phase of KNbO3 (see also discussion in Ref. [22]). At higher temperatures where the cubic phase is stable, the latter two energies which hardly could be separated experimentally because of the large half-width of absorption bands, degenerate into a single, double-degenerate level at 2.97 eV.
Our results also suggest that the blue-light-induced-IR absorption effect [19] mentioned in the Introduction could be triggered by the center absorption which may lead to its subsequent ionization where an electron is transferred to the conduction band. The retrapping of this electron by another defect is then responsible for the infrared absorption when the retrapped electron is excited to the conduction band. We recall that the UV excitation (blue-light) energy used in these experiments is very close to our calculated absorption energy of the centers.
The reason for the discrepancy in LDA and INDO relaxation energies for the center needs further study; probably it arises due to strong electron correlation effects which are crudely approximated in the two methods in quite different ways.
Acknowledgements.
R.E. has been supported by the Niedersächsisches Ministerium für Wissenschaft und Kultur. A.P. has been supported by the Deutsche Forschungsgemeinschaft (SFB 225). E.K. greatly appreciates the financial support from Danish Natural Science Research Council (Contract No. 9600998) and Latvian National Program on “New Materials for Microelectronics”. The authors are grateful to A.I. Popov and E. Stefanovich for fruitful discussions.REFERENCES
- [1] A. V. Postnikov, T. Neumann, G. Borstel, and M. Methfessel, Phys. Rev. B 48, 5910 (1993); A. V. Postnikov and G. Borstel, ibid. 50, 16 403 (1994).
- [2] A. V. Postnikov, T. Neumann, and G. Borstel, Phys. Rev. B 50, 758 (1994).
- [3] O. K. Andersen, Phys. Rev. B 12, 3060 (1975).
- [4] R. D. King-Smith and D. Vanderbilt, Phys. Rev. B 49, 5828 (1994).
- [5] W. Zhong, R. D. King-Smith, and D. Vanderbilt, Phys. Rev. Lett. 72, 3618 (1994).
- [6] D. J. Singh and L. L. Boyer, Ferroelectrics 136, 95 (1992); D.J. Singh, Phys. Rev. B 53, 176 (1996).
- [7] R. Yu and H. Krakauer, Phys. Rev. Lett. 74, 4067 (1995).
- [8] D. J. Singh, Ferroelectrics 164, 143 (1995).
- [9] H. Donnerberg and M. Exner, Phys. Rev. B 49, 3746 (1994).
- [10] E. Stefanovich, E. Shidlovskaya, A. Shluger, and M. Zakharov, Phys. Status Solidi B 160, 529 (1990).
- [11] A. Shluger and E. Stefanovich, Phys. Rev. B 42, 9664 (1990).
- [12] E. A. Kotomin, M. M. Kuklja, R. I. Eglitis, and A. I. Popov, Mater. Sci. Eng. B 37, 212 (1996).
- [13] E. A. Kotomin, A. Stashans, L. N. Kantorovich, A. I. Lifshitz, A. I. Popov, I. A. Tale, and J.-L. Calais, Phys. Rev. B 51, 8770 (1995).
- [14] A. Stashans, S. Lunell, R. Bergström, A. Hagfeldt, and S.-E. Lindqvist, Phys. Rev. B 53, 159 (1996).
- [15] R. I. Eglitis, A. V. Postnikov, and G. Borstel, Phys. Rev. B 54, 2421 (1996).
- [16] R. I. Eglitis, A. V. Postnikov, and G. Borstel, Phys. Rev. B 55, 12 976 (1977).
- [17] Photorefractive Materials and Their Application, edited by P. Günter and J.-P. Huignard, Topics in Applied Physics, Vols. 61 and 62 (Springer, Berlin, 1988).
- [18] M. Zgonik, C. Medrano, M. Ewart, H. Wüest, and P. Günter, Opt. Eng. 34, 1930 (1995).
- [19] L. Shiv, J. L. Sørensen, E. S. Polzik, and G. Mizell, Opt. Lett. 20, 2271 (1995).
- [20] J. H. Crawford, Jr., Nucl. Instum. Methods Phys. Res. B 1, 159 (1984); J.-M. Spaeth, J. R. Niklas, and R. H. Bartram, Structural Analysis of Point Defects in Solids, Springer series in Solid State Sciences, Vol. 43 (Springer, Berlin, 1993).
- [21] E. R. Hodgson, C. Zaldo, and F. Agullo-López, Solid State Commun. 75, 351 (1990).
- [22] E. A. Kotomin, R. I. Eglitis, and A. I. Popov, J. Phys.: Cond. Matter 9, L315 (1997).
- [23] A. Stashans, E. A. Kotomin, and J.-L. Calais, Phys. Rev. B 49, 14 854 (1994).
- [24] A. W. Hewat, J. Phys. C 6, 2559 (1973).
- [25] S. A. Prosandeyev, A. V. Fisenko, A. I. Riabchinski, A. I. Osipenko, I. P. Raevski, and N. Safontseva, J. Phys.: Condens. Matter 8, 6705 (1996); S. A. Prosandeyev and I. A. Osipenko, Phys. Status Solidi B 192, 37 (1995); S. A. Prosandeyev, M. N. Teslenko, and A. V. Fisenko, J. Phys.: Condens. Matter 5, 9327 (1993).
- [26] K. Doll, M. Dalg, and P. Fulde, Phys. Rev. B 52, 4842 (1995).
- [27] J. P. Perdew and A. Zunger, Phys. Rev. B 23, 5048 (1981).
- [28] D. M. Ceperley and B. J. Alder, Phys. Rev. Lett. 45, 566 (1980).
- [29] M. Methfessel, Phys. Rev. B 38, 1537 (1988).
- [30] A. Svane, E. A. Kotomin, and N. E. Christensen, Phys. Rev. B 53, 24 (1996).
- [31] T. Brudevoll, E. A. Kotomin, and N. E. Christensen, Phys. Rev. B 53, 7731 (1996).
- [32] R. A. Evarestov and L. A. Lovchikov, Phys. Status Solidi B 93, 469 (1977).
- [33] M. E. Lines, Phys. Rev. B 2, 698 (1970).
- [34] R. I. Eglitis, M. M. Kuklja, E. A. Kotomin, A. Stashans, and A. I. Popov, Comput. Mater. Sci. 5, 298 (1996).
- [35] K. L. Sweeney, L. E. Halliburton, D. A. Bryan, R. R. Rice, R. Gerson, and H. E. Tomaschke, J. Appl. Phys. 57, 1036 (1985).
- [36] T. Varnhorst, O. F. Schirmer, H. Kröse, R. Scharfschwerdt, and Th. W. Kool, Phys. Rev. B 53, 116 (1996).
- [37] G. G. DeLeo, J. L. Dobson, M. F. Masters, and L. H. Bonjack, Phys. Rev. B 37, 8394 (1988).
- [38] K. L. Yip and W. B. Fowler, Phys. Rev. B 11, 2327 (1975).