[
High-field Electron Spin Resonance of Cu1-xZnxGeO3
Abstract
High-Field Electron Spin Resonance measurements were made on powder samples of Cu1-xZnxGeO3 (x=0.00, 0.01, 0.02, 0.03 and 0.05) at different frequencies (95, 110, 190, 220, 330 and 440 GHz) at low temperatures. The spectra of the doped samples show resonances whose positions are dependent on Zn concentration, frequency and temperature. The analysis of intensity variation of these lines with temperature allows us to identify them as originating in transitions within states situated inside the Spin Peierls gap. A qualitative explanation of the details of the spectra is possible if we assume that these states in the gap are associated with “loose” spins created near the Zn impurities, as recently theoreticaly predicted. A new phenomenon of quenching of the ESR signal across the Dimerized to Incommensurate phase-boundary is observed.
pacs:
PACS numbers: 76.30-v,75.10.Jm,75.50.Ee]
Since the discovery that CuGeO3 undergoes a Spin-Peierls (SP) transition at K [1] this compound has been extensively investigated. The Cu2+ ions () form chains along the axis and, due to the coupling of these spins with the lattice vibrations, there is a dimerization of the chains below causing the opening of a gap ( K) in the spin-spectrum above a singlet ground-state. Part of the interest in this material is associated with the possibility of doping it, which was not feasible with the previously known organic SP materials[2]. The doping may be achieved in two ways: (i) by the substitution of Cu2+ by ions (Zn2+) or ions (Ni2+, Mn2+)[3] (ii) by the substitution of Si for Ge[3]. Some unexpected effects appeared upon doping: (i) the gap closes for very small doping concentration (with less than 1% of Si doping the magnetic susceptibility shows almost no trace of the gap[4]); (ii) the antiferromagnetic (AF) fluctuations increase upon doping and the system undergoes a transition to a Néel phase at a temperature much higher than expected; (iii) a coexistence of antiferromagnetism and dimerization has been reported[5].
The motivation for the high-field Electron Spin Resonance (ESR) measurements presented in this letter came from the recent theoretical prediction that the doping with non-magnetic impurities (Zn2+ in the present work) should introduce states inside the gap[6].In the vicinity of each Zn ion a spin state is predicted to be located. These states are weakly interacting and their collective behavior likely belong to the universality class of the Randon Antiferromagnetic Heisenberg chain[6][7]. The weight inside the gap should grow like (for small ) and so one expects that the behavior of these states should depend on doping concentration. Inelastic Neutron Scatering (INS) measurements did not report low energy states[5], but this is likely caused by the presence of strong elastic scattering. As these states were supposed to be magnetic ()[6] ESR seems to be the appropriate technique to observe them. Up to now (to our knowledge) the majority of the literature on doped CuGeO3 has been focussed on the AF or on the incommensurate (IC) phases. Due to the the challenging experimental results described above and due to the possible relevance of the in-gap states to this issue, the work for this letter has concentrated on the narrow temperature window .
Two sets of polycrystalline Cu1-xZnxGeO3 samples with and were grown by the usual solid state reaction. The two sets were prepared with different grinding and heating times . ESR and magnetic susceptibility measurements yielded the same results on both sets, and the susceptibility data are in good agreement with those of Weiden et al.[8]. The same amount of marker -MnO diluted in MgO - was later mixed in with one set of samples, to serve as a field marker and intensity reference[9]. The ESR measurements on this compound were performed with the National High Magnetic Field Laboratory high-field ESR spectrometer. Different frequencies were investigated ( and GHz) using Gunn diode sources with oversized waveguides and a single pass transmission probe. A 17 Tesla superconducting magnet was used to sweep the field. A detailed description of the setup will be given elsewhere[10].
The ESR spectrum of polycrystalline CuGeO3 shows the typical pattern of a powder distribution with rhombic anisotropy. The values obtained at are , and , which agree with values reported in the literature[11][12]. As the temperature is decreased below TSP , the ESR lines broaden and decrease in amplitude along the three directions , and . This behavior has already been observed at X-band[11].
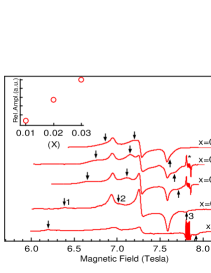
The ESR spectra of Cu1-xZnxGeO3 at and GHz are shown in Fig.1 for different values of Zn doping. Two different sets of resonances are observed. The main features (MF) appear at transition fields coincident with those of pure CuGeO3 at higher temperatures. The extra features (EF) marked in the figure by arrows and labeled as 1, 2, and 3 are specific to the doped samples and represent the main focus of the present work. The resonance fields, linewidths and amplitudes of these features depend on the Zn concentration, frequency and temperature. This behavior excludes the possibility that their origin could be a spurious paramagnetic phase in the samples. Moreover, the two sets of samples studied here gave the same results. It is clear in Fig.1 that the spectra of the sample shows also EF at low and high fields. We associate this to the fact that the sample has a residual susceptibility below , indicating that some intrinsic chain breaking mechanism is affecting its magnetic properties [8]. This means that in reality the “” sample should be considered as having an value between 0.00 and 0.01. The observed position of the EF in the nominally pure sample fits in the general trend of shift described below for a very low doping level.
It is also worth noting that the temperature behavior of the main features depends on the Zn content. The intensity of these lines decreases more rapidly with temperature for lower doping levels. In the case of the pure CuGeO3 sample, the expression obtained by Bulaevskii[13] for an alternating chain of spins in the Hartree-Fock approximation, , was used to analyse the temperature dependence of the ESR line intensity below , where is related to the SP gap and to the exchange interaction . Taking the value of [1], the observed value of the SP gap is , in agreement with the literature [14][12]. However, as expected, the extension of this analysis to the doped samples is not adequate[8]. Therefore taking into account the zero-field energy gap , as well as the Zeeman term , the experimental data presented in Fig.2(a) fit quite well with theoretical predictions for the difference in population between two energy levels based on Boltzmann statistics. For the doped samples, the gap is estimated to be , and for , and respectively. These values compare well with the results of neutron scattering[5], showing that the original gap is partially supressed with Zn doping, in agreement with previous calculations[6].
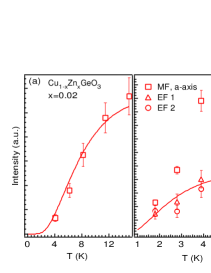
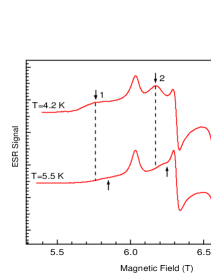
Fig.2(b) shows the temperature dependence of the intensities of the main feature along the axis and the EF 1 and 2 for the sample. In all Zn doped samples studied the Zn-induced features start to appear only at temperatures between and . The temperature behavior of the intensity of the EF for , as depicted in Fig.2(b), can be tentatively associated with transitions within a band of S=1/2 states positioned at an energy above the ground state. Following the same procedure as for the main features in the doped samples, is estimated at . Even though we had a limited temperature range to follow the EF, their intensity versus temperature behavior, if compared with that of the main features (see Fig.2(b)), can only be explained if associated with a resonance coming from states positioned inside the SP gap. The fact that the intensity of the EF sharply drops above (see Fig.2(b)) could indicate the presence of some relaxation mechanism.
Comparing the spectra obtained at the same frequency (220 GHz) and temperature ( K) for the different Zn concentrations (see Fig.1), the resonance field positions of the in-gap states exhibit a dependence on the Zn content. As x is increased from to , the EF 1 and 2 shift upwards in field toward the main features along the and axes respectively, while EF 3 moves down in field toward the main feature along the axis. The inset in Fig.1 also shows that as the doping level increases, the EF become more intense.
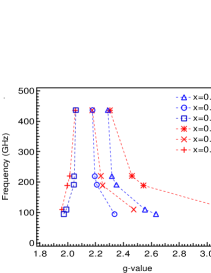
The frequency dependence of the EF has been studied keeping the temperature and doping level fixed. The results are shown in Fig.3 for two different doping levels. It is observed that the g-values of EF 1 and 2 decrease with increasing frequency (starting with 95 GHz) while the g-value of EF 3 increases, and then they become frequency independent at higher frequencies. Moreover, these EF broaden and decrease in amplitude as the frequency is lowered, that may explain why they were not detected at lower frequencies[15], and again an indication that some relaxation mechanism is active.
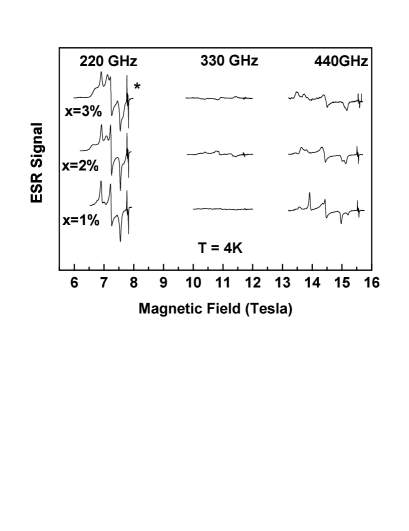
Fig.4 shows the ESR spectra of Cu1-xZnxGeO3 for and measured at and at different frequencies (220, 330 and 440 GHz). Assuming the values obtained for the SP gap in the doped system, it can be seen that the frequency 440 GHz corresponds to resonance fields in the IC phase of the system, while 220 GHz , and therefore all lower frequencies, correspond to fields in the dimerized (D) phase. However, at 330 GHz (10 to 12 Tesla in field), the ESR signals from both Cu1-xZnxGeO3 and the marker are almost completely quenched. As the temperature is increased, the signals start to reappear and their intensity increases with temperature. This quenching could be related to the phase transition from the dimerized to the incommensurate phase which might cause damping of the microwaves. This effect at 330 GHz is restricted to the doped samples only and has not been observed in the pure compound around its D to IC phase transition. It is possible that this transition is much broader in the doped material than in the pure, as observed by Kiryukhin et al.[16]. This effect, which is beyond the scope of this work, is not well understood at the moment and more experiments are being carried out to clarify it.
The temperature dependence of the intensity of the central feature of the powder spectrum (see Fig 2a), shows that the main effect of doping is to reduce the original gap, as already observed with neutron scattering[5]. The appearence of low temperature extra features in the ESR spectrum upon doping, and their coexistence with the main features, show that there are two distinct ESR active entities in the system. The main features are readily attributed to the undisturbed CuGeO3 chains, the EF to in-gap states which can be visualized as quasi-isolated spin doublets created in the antiferromagnetic chains upon doping by non-magnetic impurities as predicted in ref. [6].
We first analyse the temperature dependence, since its explanation is related to the dependencies on Zn2+ concentration and on frequency. The temperature dependence of the in-gap states resonance fields (Fig.5) is a common behavior in one dimensional spin systems [17]. It may be ascribed to the increase of short range order (SRO) at lower temperatures. Although there is no long range order in 1-D spin systems, the build up of some SRO is enough to create a local field (of dipolar origin) in the chains. As the correlation length increases at lower temperatures, the local field is stronger, causing a shift in the resonance field (see Fig.5). The presence of this correlation length dependent local field explains the fact that the in-gap states give resonance signals that, at low doping and low frequency, are substantialy shifted from the main features (see Fig.1). Martins et al. [6] assert that these states in the gap derive from the presence of “loose” Cu2+ ions that are created by the introduction of the Zn2+ impurities. There is also evidence [6][18] that doping causes the “loose” spins to feel a considerable increase in the AF correlations with the neighbors, i. e., there is an increase of SRO in the region where the “loose” spin is located. As a consequence the “loose” spin will feel a larger local field than the spins farther from the impurity, causing its resonance to be shifted in relation to the resonance field of the other spins, giving rise to an extra feature in the ESR spectrum. It is also possible to show that the positions of the three EF in the powder spectra are consistent with the expected orientation of this local field for an AF 1-D spin system. Actually, an up-field shift is predicted for an external field paralell to the chain for an AF 1-D system, while down-field shifts are predicted in the perpendicular directions[19]. This prediction coherently explains the observed field positions of the EF compared to the main features, assuming that EF 3 corresponds to the chain direction, and EF 1 and 2 correspond to the perpendicular ones. This enhanced local field near the Zn2+ readily explains the frequency behavior displayed in Fig.3, because a constant local field should give a smaller g-shift at higher frequencies, i. e., at higher resonance fields.
To explain why the shift is smaller at higher doping (see Fig.1), a behavior that at first sight seems counterintuitive, we first note that a higher doping concentration does not enhance the increase in SRO near the Zn2+ sites, it just makes it more frequent along the chain, without causing any increase in the local field felt by the “loose” spins. But, as the doping level increases, the “loose” spins should start to interact with each other through an effective AF interaction [6] [20], whose strength increases with doping level; this additional interaction will add some quantun fluctuations to the spin system, diminishing the local field felt by the “loose” spins and consequently the shift in the resonance field. Currently a theoretical effort is being made to develop quantitatively these models, using numerical techniques[21].
In summary, the specific contribution of the multifrequency high-field ESR technique in this study resides in the fact that i) it allows the observation of the in-gap states for the first time and ii) it offers the possibility to have an insight into the physics of these states via the observation of the principal values of the g tensor connected with these excitations and their behavior with the doping level, temperature and frequency.
The authors acknowledge valuable discussions with E. Dagotto, W. Moulton and T. Brill, and thank S. McCall for susceptibility measurements and J. Crow for his support. This work was funded by an internal grant from the National High Magnetic Field Laboratory. L. A. P. thanks the Human Frontier Science Program for support (RG-349/94).
REFERENCES
- [1] M. Hase, I. Terasaki, and K. Uchinokura, Phys. Rev. Lett. 70, 3651 (1993).
- [2] D. Bloch, J. Voiron, and L. J. de Jongh, in Proceedings of the International Symposium on High Field Magnetism, M. Date ed., pg. 19 (North-Holland, Amsterdam, 1983).
- [3] S. B. Oseroff, S-W. Cheong, B. Atkas, M. F. Hundley, Z. Fisk, and L. W. Rupp, Jr., Phys. Rev. Lett. 74, 1450 (1995).
- [4] M. Poirier, R. Beadry, M. Castonguay, M. L. Plumer, G. Quirion, F. S. Ravazi, A. Revcolevschi, and G. Dhalenne, Phys. Rev. B 52, R6971 (1995)
- [5] M. C. Martin, M. Hase, K. Hirota, G. Shirane, Y. Sasago, N. Koide, and K. Uchinokura, preprint cond-mat/9704030.
- [6] G. B. Martins, J. Riera, and E. Dagotto, Phys. Rev. B 54, 16032 (1996).
- [7] C. Dasgupta and S-K. Ma, Phys. Rev. B 22, 1305 (1980).
- [8] M. Weiden, W. Richter, C. Geibel, F. Steglich, P. Lemmens, B. Eisener, M. Brinkmann, and G. Güntherodt, Physica B 225, 177 (1996).
- [9] O. Burghaus, M. Rohrer, T. Gotzinger, M. Plato, and K. Mobius, Meas. Sci. Technol. 3, 765 (1992)
- [10] L-C. Brunel et al., to be published.
- [11] M. Honda, T. Shibata, K. Kindo, S. Sugai, T. Takeuchi, and H. Hori, J. Phys. Soc. Jpn. 65, 691 (1996).
- [12] S. Oseroff, S-W. Cheong, A. Fondado, B. Aktas, and Z. Fisk, J. Appl. Phys. 75, 6819 (1994).
- [13] L. N. Bulaevskii, Sov. Phys. Solid State 11, 921 (1969).
- [14] M. Nishi, O. Fujita, and J. Akimitsu, Phys. Rev. B 50, 6508 (1994).
- [15] M. Hase, M. Hagiwara, and K. Katsumata, Phys. Rev. B 54 R3722 (1996).
- [16] V. Kiryukhin, B. Keimer, J. P. Hill, S. M. Coad, and D. McK. Paul, Phys. Rev. B 54, 7269 (1996).
- [17] A. Bencini and D. Gatteschi, Electron Paramagnetic Resonance of Exchange Coupled Systems, Springer Verlag, Berlin, 1990.
- [18] G. B. Martins, M. Laukamp, J. Riera, and E. Dagotto, Phys. Rev. Lett. 78, 3563 (1997); M. Takigawa, N. Motoyama, H. Eisaki, S. Uchida, preprint.
- [19] H. Okamoto and T. Karasudani, J. Phys. Soc. Jpn. 42, 717 (1977).
- [20] M. Hase, Y. Sasago, I. Terasaki, K. Uchinokura, G. Kido, and T. Hamamoto, J. Phys. Soc. Jpn. 65, 273 (1996).
- [21] G. B. Martins, J. Riera, E. Dagotto, in preparation.