[
String-like Clusters and Cooperative Motion in a Model Glass-Forming Liquid
Abstract
A large-scale molecular dynamics simulation is performed on a glass-forming Lennard-Jones mixture to determine the nature of dynamical heterogeneities which arise in this model fragile liquid. We observe that the most mobile particles exhibit a cooperative motion in the form of string-like paths (“strings”) whose mean length and radius of gyration increase as the liquid is cooled. The length distribution of the strings is found to be similar to that expected for the equilibrium polymerization of linear polymer chains.
pacs:
PACS numbers: 02.70.Ns, 61.20.Lc, 61.43.Fs]
Many glass-forming liquids at temperatures above their glass transition exhibit unusual dynamical properties associated with incipient glass formation[1]. In particular, relaxation measurements (NMR, light scattering, dielectric, mechanical) on glass-forming liquids typically give relaxation functions which are non-exponential and these observations have been interpreted in terms of “dynamic heterogeneity” in the liquid structure [3, 4]. Measurements of the translational and rotational diffusion of tracer molecules in “glassy liquids” [2] have shown the breakdown of continuum hydrodynamics and these deviations have also been interpreted in terms of liquid heterogeneity [5]. However, the typical optical clarity of glassy liquids, as well as neutron scattering measurements over a wide wavelength range, do not provide evidence for local density fluctuations which could be readily associated with the heterogeneities inferred from dynamic measurements [6]. It therefore remains an open question whether glassy liquids contain heterogeneities, and if so, what form they take.
The determination of the structure of glass-forming liquids requires high resolution measurements in space and time. Molecular dynamics (MD) simulations of glassy liquids provide a powerful adjunct to experimental studies, since the molecular structure and motions can be examined in great detail. However, this computational approach has its own limitations since large, well equilibrated samples must be followed for long enough times to explore the dynamics of glassy liquids [7]. It is also not obvious how this microscopic information should be best analyzed to reveal the nature of heterogeneities in these liquids.
Previous MD simulations on glassy liquids have provided evidence for their heterogeneity. For example, dynamic heterogeneity has been illustrated by averaging the properties of glass-forming liquids over subregions to find that differences in these averages persisted for significant times [8]. Simulation has also shown that the tracer diffusion of particles in glassy liquids deviates from the Stokes-Einstein relation at low temperature [9], which has been interpreted in previous measurements as implying heterogeneity [5]. Other MD studies have sought to examine heterogeneity by tracking the motion of individual particles and have revealed ample evidence for dynamic heterogeneity in the sense that large dispersions in the particle mobilities in space and time were apparent[10]. However, no quantitative description of the structural nature of heterogeneity in glass-forming liquids has emerged from these studies. Here we return to this problem.
Extensive MD simulations of a glass-forming liquid in which the molecules interact through a Lennard-Jones (LJ) potential were performed to determine the existence and nature of heterogeneities in this model liquid [11]. The system studied in Ref. [11] was a three-dimensional binary mixture of 8000 particles having relative concentration of 80% of type and 20% of type particles, where the size of the particles was 10% larger than the particles. The well depth and the potential range of the Lennard-Jones (L-J) potential,
| (1) |
and the relative particle concentration were chosen to suppress crystallization and phase separation [12]. Previous studies of this system [13] have shown that it exhibits the properties of a “fragile” [14] glass-forming liquid, and that the relaxation of density fluctuations found for this model liquid compares well with the predictions of mode-coupling theory. Ref. [11] reported evidence for dynamical heterogeneities in this model glassy liquid, but their microscopic structure and dynamics were not investigated in detail. In this Report, we investigate the simulated liquid described in Ref. [11] in order to determine the morphology of the heterogeneities that arise in this glassy liquid [15].
We report all quantities in dimensionless units involving the L-J parameters of the particles [16]. The system was equilibrated at 10 different temperatures in the range [0.451, 0.550]. For reference, the mode-coupling temperature was estimated as [13]. The density varied from particles per unit volume at the highest to at the lowest simulated. Configuration histories for up to MD steps following equilibration were stored for each run. Adopting argon values for the Lennard-Jones parameters of the larger spheres [17] gives an observational time of 26 ns.

Ref. [11] proposed a criterion for identifying particles of enhanced mobility, and showed that the most mobile particles in the liquid were spatially correlated. In this approach, particle mobility is assigned by comparing the self part of the van Hove correlation function with the Gaussian function
| (2) |
describing the probability distribution of a Brownian particle with displacement from the origin. At long times, Brownian motion is eventually established in a liquid, and hence is well approximated by in the limit of large . also describes a Brownian particle strongly localized by a harmonic potential, where is independent of . At short times the particles of a dense liquid are localized in the cage created by surrounding particles, and hence is also well approximated by in the limit of small . For intermediate , simulations of glassy liquids generally show substantial deviations of from (Fig. 1).
Deviation from the limiting Gaussian is conventionally measured by the “non-Gaussian parameter” [17]
| (3) |
which vanishes for . Fig. 1 shows for the coldest simulation () at the time [18] where has a maximum (see inset). Previous work has shown that dynamical heterogeneity is strongly exhibited at this characteristic time[10]. The long tail of relative to shows that there exist particles with enhanced mobility relative to ordinary Brownian motion [11]. This point was also emphasized by Thirumalai and Mountain[9]. Following Ref. [11], we classify a particle as “mobile” if its displacement at exceeds the distance where equals (see Fig. 1).

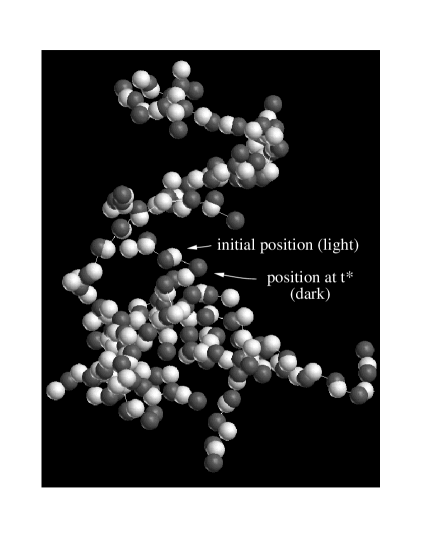
To analyze the geometrical configuration and dynamical motions of these mobile particles, we define nearest-neighbor (nn) mobile particles as those separated by a distance less than that of the first minimum in the radial distribution function. We can thereby identify connected clusters of nn mobile particles. A snapshot of a large cluster of nn mobile particles in the coldest run is shown in Fig. 2. The size distribution for these clusters is broad, typically ranging from 1 to about 200 particles at the lowest . Note that many of the mobile particles are within large clusters at low , since the number of particles in the largest cluster is of the same order of magnitude as the total number of mobile particles. It should also be appreciated that this is a projection of a three-dimensional structure, and consequently its diffuse, string-like nature is somewhat obscured. The average number of mobile nearest neighbors of a mobile particle increases from at the highest to at the lowest , consistent with the string-like appearance of the clusters (cf. Fig. 2. In comparison, the average coordination number of an atom in this system is approximately 13. The spatial extent of the cluster in Fig. 2 is about 15 molecular units, which corresponds to nm for orthoterphenyl, for which the hydrodynamic radius is nm [4].
An examination of the particle motions indicates a correlated motion of particles along quasi-one-dimensional paths. To quantify the nature of this correlated motion, we calculate the distinct van Hove correlation function for the mobile particles, which describes the time-dependent density of particles in the vicinity of an arbitrarily chosen test particle at . The term “distinct” indicates that the test particle is excluded from the calculation of the density, and at short times is proportional to the equilibrium radial distribution function . is then a time-dependent counterpart to , which provides information about the degree of correlation in particle motions. For Brownian particles, the peaks of , which are well developed at short times, decay toward unity as particle positions decorrelate through Brownian motion [17]. The depletion of particle density at small in for gradually increases at later as other particles move into the position previously occupied by the test particle. If the position of the original test particle is occupied with high probability by another mobile particle at later times, should develop a strong maximum about . This is shown in Fig. 3, which presents at different for the lowest . At the height of the nn peak decreases, and a peak at develops and grows with time, reaching its maximum value near . Note that no significant peak exists for the between mobile and other particles.

The inset of Fig. 3 shows the fraction of mobile particles that are within a distance at from a position occupied by another mobile particle at [19]. The -dependence of , as well as that of the height of the peak at , indicates that the tendency for a mobile particle to move toward a position previously occupied by another mobile particle increases with decreasing . Collective motion was recognized in previous simulations of glass formation, but the effect was not studied quantitatively. See e.g., [20].
The particular string-like character of the collective particle motion is demonstrated by examining the angular correlation between the motion of two neighboring mobile particles. Fig. 4 shows a contour plot of the probability distribution of the displacement vector , projected onto the plane defined by and , where denotes a mobile particle within the nn shell of a mobile particle . The vector points in the direction of the positive axis. The contours divide the range of values of the probability into 20 intervals so that the probability inside the innermost contour centered on is at least 20 times higher than the probability outside the outermost contour. The distribution has been calculated using all mobile particles that have at least one other mobile particle in their nn shell. If more than one mobile nn particle exists in the proximity of a reference mobile particle, then the averaging for the data in Fig. 4 includes all distinct pairs of nn mobile particles. In the absence of any correlation between and , the contour plot should have a rotational symmetry about the origin. Indeed, a contour plot calculated in a similar way between other (not mobile) particles is rotationally symmetric. Instead, the pronounced asymmetry of the contour plot in Fig. 4 shows that it is much more probable for a mobile particle to move in the direction of another mobile particle than in any other direction. It is this dynamical correlation that appears to cause the string-like clustering of mobile particles.
An animation of the cluster of nn mobile particles shown in Fig. 2 reveals that not all of the mobile particles are involved in string-like collective motion. These observations suggest that we separately examine nn mobile particles which move collectively in string-like paths. It is anticipated that these cooperatively rearranging string-like clusters could have a large influence on momentum [21, 22] and mass transport [5] in glassy liquids, so we examine these structures in detail. The potential significance of cooperative motion in glass-forming liquids has long been appreciated [23].
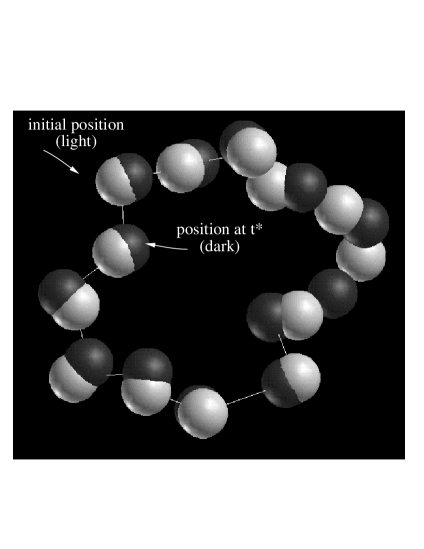
We define “strings” by connecting two mobile particles and if min. This condition implies that one of the mobile particles has moved, and a second mobile particle has occupied its position. Fig. 5[24] shows a representative string which has a notable loop-like form. Most of the strings have free ends, but loops occur with modest frequency. The strings have a smaller average size than the nn mobile particle clusters. For example, the cluster in Fig. 2 consists of about 10 substituent strings. The average length and size of the strings increase as the liquid approaches the glass transition and their mass distribution is shown in Fig. 6 for three different . The semi-log plot reveals that is approximately exponential, i.e. , where the average “string length” increases with decreasing (see inset). For small , the average radius of gyration of the strings appears to grow linearly with , while for large , an exponent near is observed, similar to discrete random walk chains. Observations similar to Fig. 6 have been found in studies of the equilibrium polymerization of linear chain polymers [25].

By analogy with equilibrium polymerization [25], the fraction of mobile particles involved in strings defines an “order parameter” for describing the changing population of mobile particles. Since a particle exchange event involves at least two particles, we count the fraction of mobile particles involved in strings of length . This fraction increases from for the highest studied to for the lowest , although the total fraction of all particles that are mobile () changes little over the range investigated. That is, an increasing fraction of mobile particles participates in strings as the system is cooled.
It should be noted that the occurrence of such dynamical heterogeneities does not conflict with recent neutron scattering observations [6] which excluded the occurrence of compact clustering in propylene glycol, a model organic glass former. It is well known from previous neutron scattering studies on equilibrium polymerization in, e.g., liquid sulphur [26] that detecting such string-like structures by neutron scattering is virtually impossible due to the small contrast between the chains and the unpolymerized species. This difficulty should exist for other polymerizing liquids as well, e.g. Te and Se [27].
We can make some comparisons with other well-studied physical problems where string-like structures have been predicted and observed. The tendency to form such structures, which involves a breaking of the local rotational symmetry, is known to occur in, e.g., liquid crystals [28] and in many high energy physics contexts [29, 30]. This type of spontaneous symmetry breaking has been suggested previously for glassy liquids and glasses [31], but previous investigations have not emphasized the emergence of clusters which arise from correlated particle motion as in the present study [32].
The observation of string-like heterogeneities in this cold, dense, equilibrium Lennard-Jones liquid naturally leads to many other questions about glassy liquids. For example, do strings exist in other model glass-formers? Can they be observed in real liquids? What is the nature of string-string interactions and how do these interactions relate to the occurrence of the glass transition? Can the characteristic properties of glasses at low (specific heat linear in , slowly varying thermal conductivity, etc.) be explained by the present observation of string excitations? Are the excitations similar in “strong” and “fragile” liquids [22]? Does the occurrence of physical aging in glasses reflect a structural evolution of the string excitations? What effect does confinement have on the dynamics of the strings and how does this relate to material properties? The study of the geometrical form of dynamical heterogeneities in glassy liquids promises to lead to an improved understanding of many aspects of glass formation.
We acknowledge useful conversations with Ray Mountain of NIST. PHP acknowledges the support of NSERC. WK is partially supported by Deutsche Forschungsgemeinschaft under SFB 262.
REFERENCES
- [1] See, e.g. the recent special issue of Science [297, 1945 (1995)] devoted to problems and properties of glasses.
- [2] In the present work we use the term “glassy liquid” to refer to a liquid above the glass transition temperature , but below the temperature where transient localization of the particle motion (“caging”) first occurs. We avoid the term “supercooled” since it is not clear that this liquid can crystallize. Certainly, some liquids cannot crystallize (cf. E. A. DiMarzio, in Comp. Mat. Sci. 4, 317 (1995).)
- [3] K. Schmidt-Rohr and H.W. Spiess, Phys. Rev. Lett. 66, 3020 (1991); J. Leisen, K. Schmidt-Rohr and H. W. Spiess, J. Non-Crystalline Solids 172-174 737 (1994); A. Heuer, M. Wilhelm, H. Zimmermann and H.W. Spiess, Phys. Rev. Lett. 95, 2851 (1995); C. T. Moynihan and J. Schroeder, J. Non-Crystalline Solids 160, 160 (1993).
- [4] F. Fujara, B. Geil, H. Sillescu and G. Fleischer, Z. Physik B 88, 195 (1992).
- [5] M.T. Cicerone, F.R. Blackburn and M.D. Ediger, J. Chem. Phys. 102, 471 (1995); M.T. Cicerone and M.D. Ediger, J. Chem. Phys. 103, 5684 (1995); F. R. Blackburn, M. T. Cicerone, G. Hietpas, P. A. Wagner, M. D. Ediger, J. Non-Crystalline Solids 172-174, 256 (1994); L. Andreozzi, A. Di Schino, M. Giordano and D. Leporini, Europhysics Letters 29 (1997). See also [4].
- [6] R.L. Leheny, N. Menon, S. R. Nagel, D. L. Price, K. Suzuya and P. Thiyagarajan, J.Chem Phys. 105, 7783 (1996).
- [7] W. Kob, p. 1 in Vol. III of “Annual Reviews of Computational Physics”, Ed. D. Stauffer (World Scientific, Singapore, 1995); S.J. Plimpton, Comp. Mat. Sci. 4, 361, (1995).
- [8] D. Thirumalai, R. D. Mountain and T. R. Kirkpatrick Phys. Rev. A 39, 3563 (1989).
- [9] D. Thirumalai and R. D. Mountain, Phys. Rev. E 47, 479 (1993).
- [10] M. Hurley and P. Harrowell, Phys. Rev. E 52, 1694 (1995); A. I. Mel’cuk, R. A. Ramos, H. Gould, W. Klein and R. Mountain, Phys. Rev. Lett. 75, 2522 (1995); T. Muranaka, Y. Hiwatari, Phys. Rev. E 51, R2735 (1995); R. D. Mountain, in “Supercooled Liquids: Advances and Applications”, Proceedings of American Chemical Society, in press.
- [11] W. Kob, C. Donati, S.J. Plimpton, P.H. Poole and S.C. Glotzer, cond-mat/9706075.
- [12] The L-J parameters and for are given by: , , , , , and . Note the presence of the substantial A-B interparticle interaction which counterbalances the tendency for the size ratio to cause phase separation.
- [13] W.Kob and H.C. Andersen, Phys. Rev. E 51, 4626 (1995); W. Kob and S.J. Plimpton, unpublished.
- [14] C.A. Angell, J. Non-Cryst. Solids 131-133, 13 (1991).
- [15] The simulations discussed here were run on the massively parallel nCUBE 2 and Intel Paragon supercomputers at Sandia National Laboratories. In aggregate the equilibration and statistics-gathering runs required approximately 300 hours of CPU time on 256 Paragon nodes (i860 processors) and generated about 10 Gbytes of data.
- [16] The length is defined in units of , temperature in units of , where is the Boltzmann’s constant, and time in units of . The mass of both types of particles are taken to be equal.
- [17] A. Rahman, Phys. Rev. A 136, 405 (1964); K. Sköld, J. M. Rowe, G. Ostrowski and P. D. Randolph, Phys. Rev. A 6, 1107 (1972).
- [18] The time corresponds to the end of the transient plateau in where the particle motion crosses over from a localized to asymptotic diffusive behavior. This time was shown to be related to the cluster lifetime in Ref. [11].
- [19] The qualitative results are insensitive to the choice of , provided that is chosen smaller than .
- [20] J.L. Barrat, J.N. Roux, J.P. Hansen, Chem. Phys. 149, 197 (1990); H. Miyagawa, Y. Hiwatari, B. Bernu, J.P.Hansen, J. Chem. Phys. 86, 3879 (1988).; G. Wahnström, Phys. Rev. A 44, 3752 (1991); H. Teichler, preprint.
- [21] S. P. Chen, T. Egami and V. Vitek, Phys. Rev. 37, 2440 (1988).
- [22] Douglas and Hubbard introduced a model of stress relaxation in fragile glass-forming liquids based on the assumption of string excitations having an exponential length distribution, and found that many aspects of glass stress relaxation could be rationalized by their model. They also predicted that the structures dominating the viscoelasticity of “strong” glassformers should be sheet-like. J.F. Douglas and J.B. Hubbard, Macromolecules 24, 3163 (1991); J.F. Douglas, Comp. Mat. Sci. 4, 292 (1995).
- [23] G. Adam and J.H. Gibbs, J. Chem. Phys. 43, 139 (1965); J. Jäckle, A. Krönig, J.Phys.: Cond. Matter 6, 7633 (1994).
- [24] For an animation of the stringlike, correlated motion of the loop in Fig. 5 see http://www.ctcms.nist.gov/ ~donati/movie.html.
- [25] Y. Rouault and A. Milchev, Phys. Rev. E 51, 5905 (1995); S.C. Greer, Adv. Chem. Phys. 94, 261 (1996).
- [26] R. Bellissent, L. Descotes, P. Pfeuty, J. Phys.: Cond. Matter 6, A211 (1994).
- [27] J. Hafner, J. Phys. : Cond. Matter 2, 1271 (1990); G. Fairre and J.L. Gardissat, Macromolecules 19, 1988 (1986).
- [28] I. Chuang, R. Durrer, N. Turok, and B. Yurke, Science 251, 1336 (1991).
- [29] M. Stone, P.R. Thomas, Phys. Rev. Lett. 41, 351 (1978); T. Banks, R. Myerson and J. Kogut, Nucl. Phys. B 129, 493 (1977); A.M. Polyakov, Nucl. Phys. B 120, 429 (1997).
- [30] M.B. Hindmarsh and T.W. Kibble, Rep. Progr. Phys. 58, 477 (1995).
- [31] N. Rivier and D.M. Duffy, J. Phys. (France) 43, 293 (1982); Phil. Mag. A 40, 859 (1979); G. Venkataraman, Contemp. Phys. 26, 579 (1985); ibid. 27, 3 (1986).
- [32] String-like excitations involving correlated atomic motions in liquid were suggested long ago by Feynman (R.P. Feynman, Phys. Rev. 90, 1116 (1953); ibid. 1291 (1953); ibid. 94, 262 (1954)) in his model of superfluids. A path-integral Monte Carlo implementation of Feynman’s model can be found in D.M. Ceperley and E.L. Pollock, Phys. Rev. B 39, 2084 (1989).