[
Doping Dependence of the Pseudogap State in the -plane IR Response of La2-xSrxCuO4
Abstract
The ab-plane optical spectra of two single crystals of La2-xSrxCuO4, one underdoped and one overdoped were investigated. We observe a gap-like depression of the effective scattering rate below 700 cm-1 in both systems. This feature persists up to 300 K in the underdoped sample with the concentration of Sr x=0.14 but loses prominance at temperatures above 300 K in the overdoped regime (x=0.22). Below 700 cm-1 is temperature dependent and superlinear in frequency for both samples. Above this frequency the effective scattering rate becomes linear in frequency and is temperature independent in the case of the underdoped La1.86Sr0.14CuO4 up to 300 K. On the other hand, the overdoped La1.78Sr0.22CuO4 shows a temperature dependence above 700 cm-1 at all temperatures. This behaviour of the frequency and temperature dependent scattering rates is a signature of a pseudogap state in other materials and suggests that both the under and overdoped single-layer HTSC systems La2-xSrxCuO4 have a pseudogap at temperatures exceeding 300 K.
pacs:
PACS numbers: 74.25.Gz, 74.7.2.Dn, 74.72.Jt, 74.72.-h, 78.20.Ci]
Right from the discovery of high-temperature superconductivity (HTSC) in the complex copper oxides, it has been recognized that the CuO2 planes play an important role in the nature of this phenomenon. While all of the cuprates share this structural element, La2-xSrxCuO4 (LSCO) possesses only one CuO2 plane per unit cell which makes it an excellent prototype system for examining the role played by the CuO2 planes. It is also a good model for the study of doping dependence since it can doped by the addition of strontium over a wide range: from the underdoped, where increases with Sr content, to the optimally doped where reaches its maximum value of K, and to the overdoped region where at .[1]
It is well known that the in-plane transport properties of HTSC materials are anomalous. For example, the in-plane dc resistivity, , for the samples doped close to the optimal doping level, is linear in temperature from the superconducting transition temperature to well above 900 K. At the same time, underdoped samples show a crossover from the linear dependence to a superlinear, , below a characteristic temperature . It was shown by B. Batlogg et al. [1] that decreases from 800 K to approximately 300 K as the doping level is increased from the strongly underdoped to just over the optimal doping level. Similar behavior at has been observed in the Hall effect coefficient and the magnetic susceptibility.[2, 3]
A completely satisfactory microscopic understanding of the peculiar transport properties of HTSC is missing at this time. However, the temperature and doping dependences of the crossover behaviour at noted in the dc transport properties are in accord with the idea that a pseudogap forms in the spectrum of the low-energy electronic excitations responsible for the scattering of the charge carriers. A similar gap-like feature has been observed experimentally in the nuclear magnetic resonance (NMR)[4], the angular resolved photoemission (ARPES)[5], specific heat[6] and the infrared optical[7, 8, 9] (IR) measurements. All of these observations can be consistently interpreted in terms of a pseudogap. In this picture the dc transport properties and the gap formation are intimately related: a gap in the density of states near the Fermi level will result in a reduced 1/ in the temperature and spectral region where this gap occurs. Since the ARPES results suggest that the gap has a d momentum dependence, momentum-averaging measurement techniques, like NMR or IR optical, would observe a pseudogap rather than a full gap even at lowest temperatures where this gap is fully formed.
A pseudogap feature was observed in the c-axis IR conductivity in YBa2Cu3O7-x (Y123) and YBa2Cu4O8 (Y124) materials.[7, 10] The -plane results show increased coherence (a narrower Drude peak) upon entering the pseudogap state while the -axis optical response shows a depressed conductivity. The pseudogap state is seen in both the -axis conductivity and the -plane scattering rate in the same doping and temperature region, suggesting that the two phenomena are closely related.[7] Recent -axis optical results on single crystals of of slightly underdoped La1.86Sr0.14CuO4[11] show that the pseudogap state in the -axis direction of this material is not as well defined as it is in the two plane materials. However, as the doping is reduced further the -axis pseudogap state features become clearer below 0.1 eV.[12]
The weak pseudogap as seen by NMR and neutron scattering[13] in LSCO has led to the suggestion that the existence of the pseudogap in the spin excitation spectrum is only possible in bilayer compounds such as Y123 and Y124. In particular, Millis and Monien attribute the pseudogap (or the spin gap) to strong antiferromagnetic correlations between the planes in the bilayer, which are responsible for a quantum order-disorder transition.[4] However, the characteristic deviations below the linear extrapolation and seen in dc conductivity in the bilayer[14] materials are also seen in LSCO.[14] Thus, it is important to see if the characteristic depression of the frequency dependent scattering rate in the pseudogap state, seen in the bilayer materials[7, 8, 9], can also be observed in the single plane materials such as LSCO.
Previous work on the inplane far infrared optical properties of the single layer lanthanum strontium cuprate includes work on the oxygen doped La2CuO4-δ[15], thin films of LSCO[16] as well as single crystal work at room temperature[14]. To our knowledge, a study of the temperature and doping dependence has not been done. We fill this gap here by performing optical measurements on high-quality LSCO single crystals at temperatures ranging from 10 K to 300 K at two different doping levels.
To better display the effect of increased coherence resulting from the formation of the pseudogap state, a memory function, or extended Drude analysis is used. In this treatment the complex optical conductivity is modeled by a Drude peak with a frequency-dependent scattering rate and an effective electron mass.[17, 18] While the optical conductivity tends to emphasize free particle behaviour, a study of the frequency dependence of the effective scattering rate puts more weight on displaying the interactions of the free particles with the elementary excitations of the system.[19] The temperature evolution of the frequency dependent scattering rate and effective mass spectra are of particular interest and are defined as follows:
| (1) |
| (2) |
Here, is the complex optical conductivity and is the plasma frequency of charge carriers.
The single crystals of La2-xSrxCuO4 with approximate dimensions 5x3x3 mm3 were grown by the travelling-solvent floating zone technique at Oak Ridge [20] in the case of and in Tokyo [21] in the case of . The critical temperature was determined by both SQUID magnetization and resistivity measurements and was found to be 36 K for the nominal concentration of Sr and 32 K for . Since the highest in the LSCO system has been found at to be 40 K , we conclude that the crystal is underdoped and the is overdoped. The crystal with was aligned using Laue diffraction and polished parallel to the CuO2 planes. The crystal with was polished in Tokyo in the direction of the ab-plane. It is important to have the sample surface accurately parallel to the ab-plane to avoid any c-axis contribution to the optical conductivity.[22] The miscut of the sample off the ab-plane was checked by a high precision triple axis x-ray diffractometer and was determined to be less than 0.8%.
All reflectivity measurements were performed with a Michelson interferometer using three different detectors which cover frequencies ranging from 10 to 10000 cm-1. The experimental uncertainty in the reflectance data does not exceed 1. The dc resistivity measurements were carried out using a standard 4-probe technique.
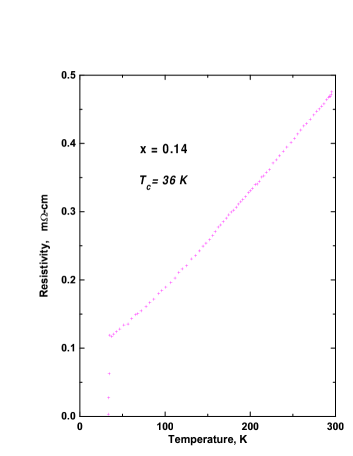
The result of the resistivity measurement on the La1.86Sr0.14CuO4 single crystal, used in the optical measurements, is shown in Fig. 1. It is commonly accepted that the dc resistivity is linear at high temperatures for LSCO and that the pseudogap begins to form near the temperature where the resistivity drops below this linear trend.[1] At lower temperatures there is a region of superliner temperature dependent resistivity. The value for our samples with and , extracted from the phase diagram of Batlogg et al.,[1] are 450 K and 200 K, respectively. In agreement with this, the resistivity shows a superlinear temperature dependence below room temperature as expected in the pseudogap region.
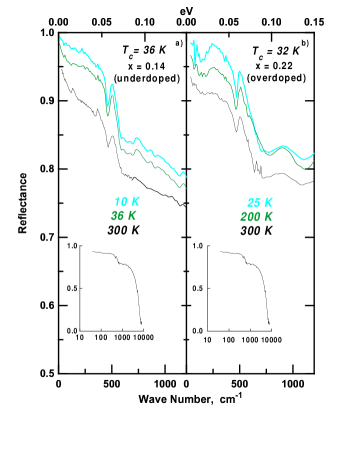
In Fig. 2 we present the reflectivity data at temperatures above and below . For clarity, only three temperatures are shown: K, a temperature just above the superconducting transition and a low temperature K or 25 K for and , respectively, in the superconducting state. In the frequency region shown the reflectance is strongly temperature dependent for both materials, dropping by approximately as temperature is increased from the lowest temperature to K. The plasma edge is observed at 7800 cm-1 (see insert of Fig. 2). The distinct peaks at approximately 150, 300 and 500 cm-1 in the LSCO reflectivity spectra correspond to the excitation of ab- plane phonons.[23]
The complex optical conductivity was obtained by Kramers-Kronig analysis of the reflectivity data. Since, in principle, this analysis requires knowledge of the reflectance at all frequencies, reflectivity extensions must be used at high and low frequencies. The Hagen-Rubens formula was used for the low frequency reflectivity extrapolation, with parameters taken from the dc resistivity measurements on the same sample shown in Fig. 1 and the results of H. Takagi et al.[24] for the overdoped sample. For the high-frequency extension with cm-1 we used reflectivity results of Uchida et al.[14] At frequencies higher than 40 eV the reflectivity was assumed to fall as .
We calculate the plasma frequency of the superconducting charge carriers and the London penetration depth using the following formula:[26]
| (3) |
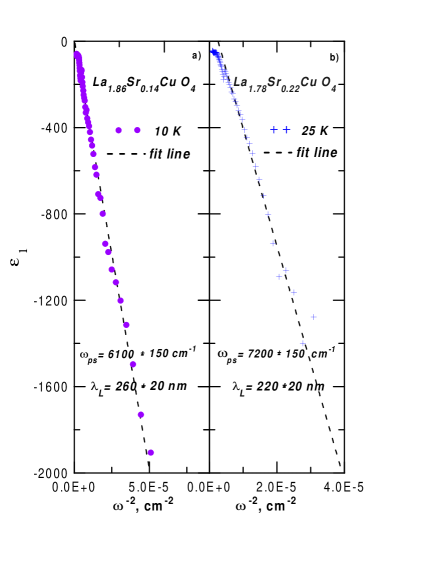
The slope of the low-frequency dielectric function, , plotted as a function of in Fig. 3a,b gives plasma frequencies of 6100 cm-1 and 7200 cm-1 in the superconducting state. The corresponding London penetration depths are nm and 220 nm for La1.86Sr0.14CuO4 and La1.78Sr0.22CuO4, respectively. These values are in good agreement with those obtained previously by Gao et al. in films[16] () and by muon-spin-relaxation[25] ().
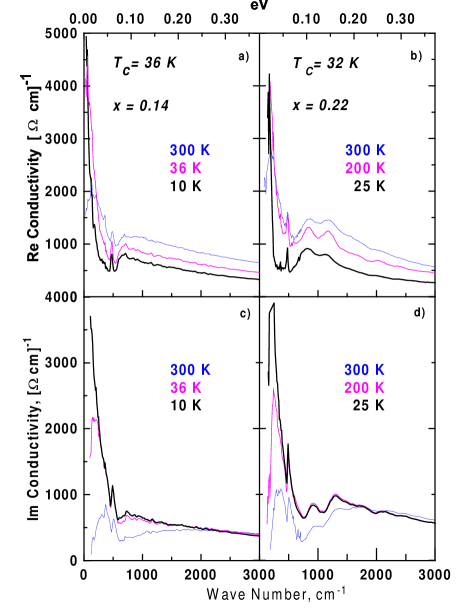
The real part of the conductivity for the two materials is shown in Fig. 4a,b. For completeness we also show the imaginary part of the conductivity in Fig. 4c,d. The real part of the conductivity has a Drude peak which narrows as the temperature decreases in agreement with the metallic temperature dependence of the dc resistivity. The conductivity of LSCO is temperature-dependent in the MIR frequency region as well. This temperature dependence becomes stronger as is reduced by overdoping. There are strong deviations from the Drude shape in the form of an onset or a step in the conductivity at 700 cm-1. Unlike the Y123, Y124, and Bi2Sr2CaCu2O8+δ (Bi2212) materials which show similar features only at low temperature, the optical conductivity of La1.86Sr0.14CuO4 shows a threshold at about 700 cm-1 already at room temperature.
Another deviation from the Drude form is a shift of the Drude peak from zero frequency to 150 cm-1. This peak grows in magnitude and narrows as the doping level of Sr increases. A similar peculiarity was observed in the conductivity of a single crystal of La2CuO4+δ [15]; however, it was absent in the optical data of La2-xSrxCuO4 thin films.[16] The nature of the peak is unclear. It is seen in many HTSC systems and has been attributed to localization.[27] An artifact of the polished surface is another possible explanation.
We define an overall plasma frequency in terms of the sum rule with = 8000 cm-1. At room temperature, = 15100 cm-1 and 13800 cm-1 for LSCO with and , respectively. These numbers are similar to those measured previously[16, 28, 15] and were used to calculate the frequency-dependent scattering rate using Eq. 1. In a recent survey on a number of compounds, Puchkov et al.[9] found that while the plasma frequency grows with doping in the underdoped region, this growth stops at optimal doping. In agreement, we observe here a slight drop in the spectral weight as one moves from the slightly underdoped to the overdoped region.
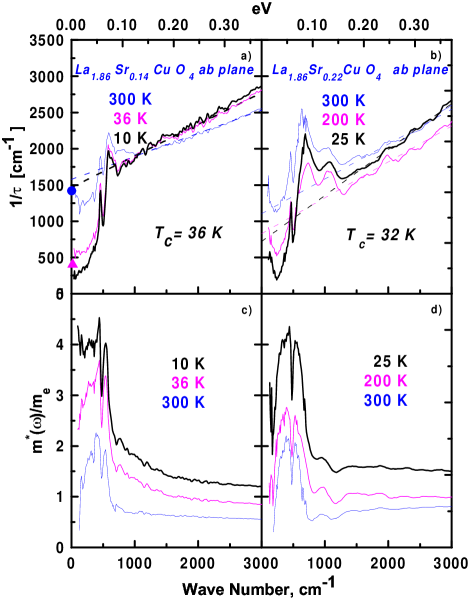
The frequency dependent scattering rate and the effective mass are shown in Fig. 5. The spectra can conveniently be divided into two regions. In the high frequency region, starting at about 700 cm-1, the scattering rate varies linearly with frequency while in the low frequency region there is a clear suppression of 1/(,T) below this linear trend. We will call this frequency region of suppressed scattering the pseudogap state region. As the temperature is lowered this suppression becomes deeper. The dashed lines in Fig 5 are extrapolations of the high frequency linear behaviour to zero frequency. A pseudogap state can be defined in terms of this suppression of scattering: the material is in the pseudogap state when the scattering rate falls below the high frequency straight-line extrapolation. In the low frequency limit the scattering rate is proportional to the dc resistivity. Due to this, the 1/(,T) suppression should be compared to the suppression of (T) [1] at temperatures below the linear T dependence region. The IR measurement gives us the possibility to see both the frequency and the temperature dependence of this feature.
The temperature dependence above 700 cm-1 is strongly influenced by the level of Sr doping. In the underdoped sample the high frequency scattering rate is nearly temperature independent. In contrast, the overdoped samples scattering rate above 700 cm-1 increases uniformly with temperature. The curves are seen to be displaced parallel to each other as the temperature is increased. This behaviour is also seen in other overdoped HTSC.[29]
To emphasize the difference between the underdoped and overdoped regimes we fitted the high frequency scattering rate curves with a linear function . The values of the and parameters can be found in Table 1. The zero-frequency intercept, , changes only by 7% in the case of underdoped sample but nearly doubles in the overdoped sample between the superconducting transition and 300 K. While increases with doping, is substantially smaller in the overdoped sample. The behavior of the intercept is consistent with the other HTSC materials [29] but not the slope. Puchkov et al. found that decreased with doping in most materials. The magnitudes of and of LSCO seem to be substantially lower than those of Y123, Y124, Bi2212 and Tl2202. [29]
We found that for La1.78Sr0.22CuO4 (the overdoped sample) ( 300 K) is an order of magnitude higher than the superconducting transition temperature (32 K). This is significantly different than previous results on overdoped cuprates. Theoretical considerations have led to the suggestion that coincides with the temperature of the superconducting transition at the optimal doping level.[30, 31] This seems to apply to Y123 and Y124 where the and curves cross near the optimal doping level, but this is clearly not the case here. A detailed examination of the scattering rate curves in Fig. 5b suggests that in overdoped sample the suppression of the scattering disappears near room temperature implying that for is close to 300 K. This result is consistent with the phase diagram based on the data from transport properties.[1]
In addition to the pseudogap depth and temperature dependence, several other features of Figs. 5 a,b should be mentioned. The position of the pseudogap remains at 700 cm-1 for all temperatures. There are also several peaks positioned at 1000 cm-1 in scattering rate which complicate the analysis, particularly in the case of the overdoped samples. These peaks have been attributed to polaronic effects.[32, 33]
For completeness we plot the effective mass of underdoped sample (Fig. 5c) and the overdoped sample (Fig. 5d). As expected, rises to a maximum value between 2 and 5 in the region of the scattering rate suppression. The enhancement of the effective mass in the pseudogap state as well as the upper limit of are similar to what has been previously reported for values Y123, Y124 and Bi2212.[29]
| Sr content | T | |||
|---|---|---|---|---|
| 300 K | 0.32 | 1578 | ||
| x=0.14 | 36 K | 36 K | 0.44 | 1467 |
| 10 K | 0.44 | 1467 | ||
| 300 K | 0.39 | 1260 | ||
| x=0.22 | 32 K | 200 K | 0.5 | 828 |
| 25 K | 0.61 | 721 |
Before closing we compare our results with data of Gao et al.[16] on La2-xSrxCuO4+δ films and Quijada et al.[15] on oxygen doped La2CuO4+δ. Our results in the underdoped case are comparable with those of the oxygen doped material, although Quijada et al. did not carry out a frequency dependent scattering rate analysis for their underdoped sample. The film results of Gao et al. are quite different from our findings. The films used in that study had a strontium level that would correspond to optimal doping in crystals. However, the curves deviate markedly from what we observe for slightly under and overdoped samples. The authors performed an extended Drude analysis and found a strongly temperature dependent scattering rate. This is in sharp contrast to our results which would suggest a very weak temperature dependence. Based on our work, their samples should be in the pseudogap state since they have an value near optimal doping. Comparing these results with other systems, in particular with Tl2202, two factors suggest the possibility that the films may be overdoped. First, their was near 30 K, lower than that expected for optimal doping. Secondly, it is known that the oxygen level in films can vary substatially and in LSCO oxygen can have a major influence on the doping level[34]. On the other hand, we cannot completely rule out the possibility that all of the crystal results are affected by the polishing process, and that the films better represent the bulk material. It is clearly important to measure films where the oxygen content is controlled by selective annealing.
In conclusion, the optical data in the far-infrared region, taken on two single-layered high- superconductors, shows clear evidence of a pseudogap state in the scattering rate. This pseudogap state extends to higher temperatures than that observed in the multi-layered underdoped cuprates such as YBCO and BSCO. Previously, the pseudogap state feature with was only observed in the underdoped system. In the case of LSCO this feature can be observed in the overdoped regime at a temperature substantially above the superconducting transition temperature. This suggests that the crossover from the underdoped to the overdoped regime does not suppress below . The scattering rate is similar for both systems in the pseudogap state. At low frequencies, 700 cm-1, the scattering rates are temperature dependent and change with frequency in a non-linear fashion. Above 700 cm-1 this behaviour becomes linear. Within experimental uncertainty the observed high frequency scattering rate of the underdoped sample is not affected by temperature.
We would like to thank J.D. Garrett for help in aligning the sample and also P.C. Mason, M. Lumsden and B.D. Gaulin for determining the miscut angle of the underdoped LSCO crystal. We also take this opportunity to thank K.C. Irwin and J.G. Naeini for the useful collaboration. This work was supported by the Natural Sciences and Engineering Research Council of Canada and The Canadian Institute for Advanced Research.
REFERENCES
- [1] B. Batlogg, H.Y. Hwang, H. Takagi, R.J. Cava, H.L. Kao, and J. Kuo, Physica C,235-240, 130 (1994).
- [2] H.Y. Hwang, B. Batlogg, H. Tagaki, H.L. Kao, J. Kwo, R.J. Cava, and J.J. Krajewski, Phys. Rev. Lett.,72, 2636 (1994).
- [3] S.K. Tolpygo, J.-Y. Lin, M. Girvich, S.Y. Hou, and Julia M. Phillips, Phys. Rev. B, 53, 12454 (1996).
- [4] A.J. Millis and H. Monien, Phys. Rev. Lett., 70, 2810 (1993).
- [5] D.S. Marshall, A.G. Loeser, Z.-X. Chen, and D.S. Dessau, Physica C,263, 208 (1999).
- [6] J.W. Loram, K.A. Mirza, J.R. Cooper, and W.Y. Liang, Phys. Rev. Lett., 71, 1740 (1993).
- [7] D.N. Basov, R. Liang, B. Dabrowski, D.A. Bonn, W.N. Hardy, and T. Timusk, Phys. Rev. Lett., 77, 4090 (1996).
- [8] A.V. Puchkov, P. Fournier, D.N. Basov, T. Timusk, A. Kapitulnik, and N.N. Kolesnikov, Phys. Rev. Lett., 77, 3212 (1996).
- [9] A.V. Puchkov, P. Fournier, T. Timusk, and N.N. Kolesnikov, Phys. Rev. Lett., 77, 1853 (1996).
- [10] C.C. Homes, T. Timusk, R. Liang, D.A. Bonn, and W.N. Hardy, Phys. Rev. Lett., 71, 1645 (1993).
- [11] D.N. Basov, R. Liang, B. Dabrowski, D.A. Bonn and W.N. Hardy, T. Timusk, Phys. Rev.B, 52, R13141 (1995).
- [12] S. Uchida, K. Tamasaky, and S. Tajima, Phys. Rev.B, 53, 14558 (1996).
- [13] T.E. Mason, G. Aeppli, and H.A. Mook, Phys. Rev. Lett., 68, 1414 (1992).
- [14] S. Uchida, I. Ido, H. Takagi, T. Arima, Y. Tokura, and S. Tajima, Phys. Rev. B,43, 7942 (1991).
- [15] M.A. Quijada, D.B. Tanner, F.C. Chou, D.C. Johnston and S.-W. Cheong, Phys. Rev. B, 52, 15485 (1995).
- [16] F. Gao, D.B. Romero, B.D. Tanner, J. Talvacchio, and M.G. Forrester, Phys. Rev.B, 47, 1036 (1993).
- [17] W. Gtze and P. Wolfle, Phys. Rev.B, 6, 1226 (1972).
- [18] P.B. Allen, Phys. Rev.B, 3,305 (1971).
- [19] A. Gold, S.J. Allen, B.A. Wilson and D.C. Tsui, Phys. Rev.B, 25, 3519 (1982).
- [20] S.-W. Cheng, G. Aeppli, T.E. Mason, H. Mook, S.M. Hayden, P.C. Canfield, Z. Fisk, K.N. Clausen, and J.L. Martinez, Phys. Rev. Lett., 67, 1791 (1991).
- [21] T. Kimura, K. Kishio, T. Kobayashi, Y. Nakayama, N. Motohira, K. Kitazawa, and K. Yamafuji, Physica C(Amsterdam), 192, 247 (1992).
- [22] J. Orenstein and D.H. Rapkine, Phys. Rev. Lett., 60, 968 (1988).
- [23] S. Tajima, S. Uchida, S. Ishibashi, T. Ido and H. Takagi, T. Arima and Y. Tokura, Physica C, 168, 117 (1990).
- [24] H. Takagi, B. Batlogg, H.L. Kao, J. Kwo, R.J. Cava, J.J. Krajewski, and W.F. Peck, Jr., Phys. Rev. Lett., 69, 2975 (1992).
- [25] G. Aeppli, R.J. Cava, E.J. Ansaldo, J.H. Brewer, S.R. Kreitzman, G.M. Luke, D.R. Noakes, and R.F. Kiefl, Phys. Rev. B, 35, 7129 (1987).
- [26] D.B. Tanner and T. Timusk, in Physical Properties of High Temperature Superconductors I, edited by D.M. Ginsberg (word Scientific, Singapure, 1992), p.363.
- [27] T. Timusk, D.N. Basov, C.C Homes, A.V. Puchkov, and M. Reedyk, Journ. of Superconductivity, 8, 437 (1995).
- [28] K. Tamasaku, T. Itoh, H. Takagi, and S. Uchida, Phys. Rev. Lett., 72, 3088 (1994)
- [29] A.V. Puchkov, D.N. Basov, and T. Timusk, J. Phys.: Condens. Matter,8, 10049 (1996).
- [30] P.A. Lee and N. Nagaosa, Phys. Rev. B, 46, 5621 (1992).
- [31] V.J. Emery and S.A. Kivelson, Phys. Rev. Lett., 74, 3253 (1995).
- [32] Y. Yagil and E.K.H Salje, Physica C, 235-140, 1143 (1994).
- [33] G.A. Thomas, D.H. Rapkine, S.L. Cooper, S.-W. Cheong, A.S. Cooper, L.S. Schneemeyer, and J.V. Waszczak, Phys. Rev. B, 45, 2474 (1992).
- [34] H. Zhang, H. Sato, and G.L. Liedl, Physica C 234, 185, (1994).