[
Charge and spin excitations of insulating lamellar copper oxides
Abstract
A consistent description of low-energy charge and spin responses of the insulating Sr2CuO2Cl2 lamellar system is found in the framework of a one-band Hubbard model which besides includes hoppings up to 3rd nearest-neighbors. By combining mean-field calculations, exact diagonalization (ED) results, and Quantum Monte Carlo simulations (QMC), we analyze charge and spin degrees of freedom responses as observed by optical conductivity, ARPES, Raman and inelastic neutron scattering experiments. Within this effective model, long-range hopping processes flatten the quasiparticle band around . We calculate also the non-resonant A1g and B1g Raman profiles and show that the latter is composed by two main features, which are attributed to 2- and 4-magnon scattering.
pacs:
PACS numbers: 79.60.Bm, 74.72.-h, 78.50.Ec]
I INTRODUCTION
Recent angular-resolved-photoemission spectroscopy (ARPES) measurements on the hard to dope insulating Sr2CuO2Cl2 system have provided ,for the first time, data for the single-hole dispersion in an antiferromagnetic background [1]. These data, as well as optical absorption measurements [2], give information about charge excitations of the insulating cuprates. On the other hand, the spin excitations of the CuO2 planes have been tested by inelastic neutron and Raman scattering experiments[3, 4]. They show that the low energy spin excitations of insulating cuprates are well described by the two-dimensional spin- antiferromagnetic Heisenberg (AFH) model[5]. Much theoretical work has considered both excitations separately, and therefore a simultaneous description of charge and spin degrees of freedom using the same model is lacking.
Experimental results on the undoped Sr2CuO2Cl2 lamellar cuprate[1, 2, 3, 4], provide an unique opportunity to test, at the same time, the description of charge and spin responses as is obtained from current theoretical models for these strongly correlated systems [6]. In this work, we analize the electronic structure of insulating Sr2CuO2Cl2, in the framework of an extended one-band Hubbard model. By combining analytical and numerical techniques, we found a consistent description of charge and spin degrees of freedom responses as observed by optical conductivity, ARPES, magnetic Raman and inelastic neutron scattering experiments. We find that the almost dispersionless band measured by ARPES around ( relative to ) on the one-hole dispersive mode may be ascribed to long-range hopping processes. We calculate also the non-resonant B1g and A1g Raman profiles. The B1g line is mainly composed of two nearby structures. One of them originates on 2-magnon excitations and peaks at , while the other, centered around , is due to 4-magnon scattering. For Sr2CuO2Cl2, we obtain and . The 4-magnon Raman signal, induced by multispin interaction terms, is a characteristic of the Hubbard model and has a negligible intensity for the minimal two-dimensional AFH Hamiltonian. The A1g mode, by contrast to the AFH model, shows a Raman signal at frequencies around . To the best of our knowledge, this is the first time that an accurate calculation of all those properties is obtained using the same model with the same parameter set. In section II, we describe the one-band Hubbard model used in this work along with the procedure that we follow to obtain the effective interaction parameters. Section III and IV are devoted to the quasiparticle dispersion and to the spin excitations respectively, while in section V we summarize the results.
II The Effective model:
The effective one-band Hubbard model considered here includes the on-site Coulomb repulsion and hoppings up to third-nearest neighbors. Microscopically, these hopping processes originate on the overlap between Wannier orbitals of a more complicated multiband model[7]. Although, the strength of these interactions decreases with distance, recent work[8] suggests that hoppings further than first-nearest neighbors have to be included to obtain a quantitative description of experimental data for the cuprates. Of course, these hopping processes are material dependent. Here, we will focus our study on Sr2CuO2Cl2 lamellar cuprate, and then provide estimates for this material only. It is expected that although they introduce frustration and tend to decrease the strength of spin-spin correlations, their small values will not destroy the antiferromagnetic insulating ground state. However, they could play an important role on the charge dynamics.
In standard notation, the dispersion for the kinetic energy part of the single band Hubbard effective Hamiltonian is written as . Here, is a constant and , with , are the tight-binding dispersions for , and -nearest neighbors with hoppings , and respectively. For realistic values of multiband parameters, the effective hoppings and have the same order of magnitude of the corrections due to the states dropped by the reduction to a single band model[6]. Therefore, is the most appropriate energy scale. The value of was fixed at [9], while the other parameters were obtained by comparison with ARPES data. Our strategy is to solve first this difficult many-body problem in a mean-field approximation and then, by using ARPES data, determine the value of , and the on-site Coulomb interaction . Since Sr2CuO2Cl2 is an antiferromagnetic insulator, we use a spin-density wave (SDW) ansatz in the mean-field calculation. Notwithstanding its apparent simplicity, this treatment of the insulating half-filled Hubbard model provides a successful description of the electronic degrees of freedom up to intermediate values of [10, 11]. This analytical treatment of the Hubbard model has provided also important inside in our current understanding of the resonant Raman scattering in antiferromagnetic insulators[12].
The hole quasiparticle dispersion in the SDW approximation is given by,
| (1) |
where fixes the value of the Hubbard gap. Using ARPES data, we find , , and . The reduction of the three-band model onto the single band Hubbard model for realistic values of the parameters, indicates that the effective hopping is bounded between 0.3eV and 0.5eV while . Furthermore, the derivation of the one band Hubbard Hamiltonian given by Simón and Aligia ( see Ref.[6] ) for the parameters obtained from LDA calculations for La2CuO4, gives . Remarkably, the value of obtained from the reduction agrees well with the one found from ARPES data. Note that differences in magnitude and/or sign between our estimates and the calculated and are expected because they depend strongly on the surroundings of the CuO2 plane.
Optical absorption measurements[2] on insulating Sr2CuO2Cl2 provide an additional check on . These experiments show a charge-transfer absorption edge beginning at eV and a strong band at eV. The latter was identified as an excitonic excitation. Recently, it was shown [13] that the observed absorption peak lying at (0.1-0.2)eV below the absorption edge can be explained within an effective generalized one-band Hubbard model obtained from the simplest three-band model supplemented with the nearest-neighbor Coulomb interaction . Aside from the on-site Coulomb interaction, this generalized Hubbard model includes the nearest-neighbor charge-charge interaction . For simplicity, we have not taken into account either nor , and therefore the effective model consider in this work can not describe excitonic-like excitations.
At the mean-field level, the optical conductivity does not depend on and , and it is given, at , by
| (2) |
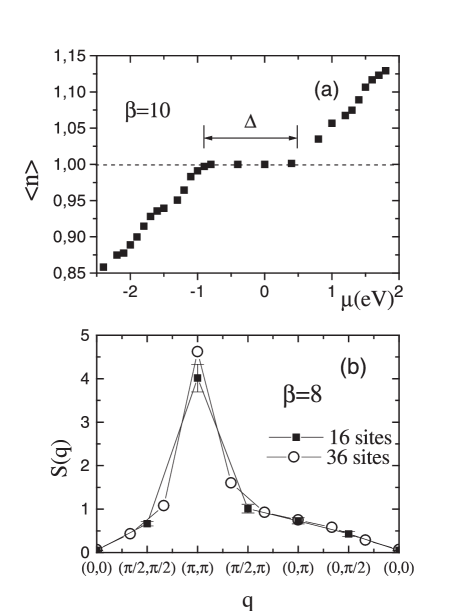
where . The onset of the optical conductivity found in the SDW approximation is at , in agreement with the experimental value for the charge-transfer absorption edge, . In the mean-field approximation, is related to the renormalized Coulomb parameter through the mean-field gap equation[11], For the Hubbard model, one obtains for . These values correspond to the bare Coulomb parameter and respectively. In all cases, [14]. In order to obtain the bare Coulomb interaction parameter , we calculated the gap by performing QMC simulations for different values of , and particle density . By changing the doping from holes to electrons, the chemical potential crosses the gap at where a plateau shows in the vs curve, see Fig.1a. On this plateau, the electronic compressibility vanishes, indicating an insulating state at that density. The width of the region with measures the value of the charge gap and in turn allows us to provide an estimate of the bare Coulomb repulsion . We found that the insulating Sr2CuO2Cl2 material can be described as an intermediate coupling one-band Hubbard system with and the other parameters as described above. Although, 2nd and 3rd nearest-neighbors hoppings introduce some degree of frustration on the magnetic background, the insulating ground state is still antiferromagnetic, as is found by performing QMC simulations on square clusters of (4x4) and (6x6) sites. In Fig.1b, we plot the magnetic structure factor . The antiferromagnetic peak at is clearly evident and its strength increases as the system size is increased, a signal of dominant antiferromagnetic spin correlations.
From QMC simulations, we also obtain the local moment of the effective sites. Since an effective site represents a CuO2 cell, an estimation of the local moment per Cu can be obtained by taking into account the Cu occupation on the cell. At stoichiometry, for a Cu occupation of , we obtain Cu which is consistent with the experimental value[15]. By contrast, note that the measured local moment for insulating La2CuO4 is roughly the value of Sr2CuO2Cl2.
III Quasiparticle dispersion:
Soon after ARPES’ results for the insulating cuprate Sr2CuO2Cl2, several theoretical works [16, 17, 18] have been devoted to the description of the data by like hamiltonians. Unfortunately, ARPES data show that the 2D model accurately describes along the direction from the zone center to . Important differences were found moving along the non-interacting Fermi surface and near the point.
Figure 2 shows a comparison of the single-hole dispersion obtained from: ARPES data, model, and the Hubbard model with hoppings up to third nearest-neighbors. The theoretical can be obtained from an approximate treatment of the single hole problem. For the model, it can be determined by using the self-consistent Born approximation[19]. The quality of this approximation was contrasted successfully against ED calculations[17, 22]. For the model, the simplest procedure is to use the mean-field SDW analysis. Since, long-range hoppings are small in magnitude, we expect as for the model, the effect of quantum fluctuations can be absorbed into renormalized hopping values while the form of the dispersion relation remains the same as at the mean-field level.
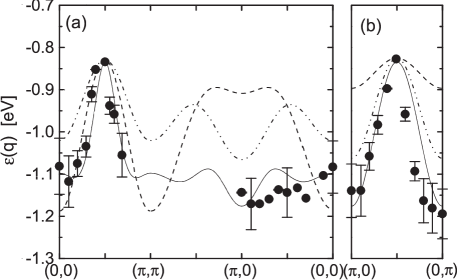
The ARPES dispersion is described rather well by these theoretical models around the point, possibly because they describe properly the magnetic structure of the quasiparticle cloud for this particular value of . Outside the antiferromagnetic Brillouin zone, results for the model differ significantly from the experimental data, even for the case of finite and positive . This hopping process pushes down and at the same time decreases the bandwidth [20]. Although second and further nearest-neighbor hoppings have a small strength, and at a first sight they seem to be irrelevant, they have important effects on the quasiparticle dispersion, in particular around the q-point and on the bandwidth’s value. While a finite reduces the bandwidth, the main effect of is to increase and, at the same time, reduce the dispersion around . Meanwhile, without these interactions, it was found from QMC calculations [23] that the Hubbard model at gives a bandwidth smaller than the experimental value () by a factor of 2. Including n.n.n. hoppings, we obtain an overall good description of the experimental based on the functional form provided by the SDW mean-field solution. Although, we have not performed the highly demanding QMC computation of the single-hole dispersion for the model proposed in this work, our confidence on the SDW approximation comes from its success in describing the dispersion relation and the comparison performed in Sec.IV against other experiments using the very same parameter set. Further support is found from the recent calculation of the single hole dispersion done in Ref.[21] for the strong coupling limit of a generalized Hubbard model. Note nevertheless, that in this calculation a bigger ( ) than the experimental exchange constant is required to obtain the experimental band width. Of course, within the SDW scheme we can not study other interesting properties of the quasiparticle such as its residue[22].
Along the non-interacting Fermi surface, results obtained from Hubbard like models are in better agreement with ARPES measurements than the one hole dispersion. Let us emphasize that only a few experimental points, taken from panel (a), were used to determine the hopping parameters. As a by-product, the theoretical dispersion agrees also rather well with ARPES results of panel (b). The small asymmetry observed along the line could be ascribed to sample anisotropies.
IV Spin excitations:
On the experimental side, the spin degrees of freedom are tested by Raman and neutron scattering experiments. They reveal, in fact, that the insulating ground state of Sr2CuO2Cl2 is antiferromagnetic. The experimental value of the spin wave velocity is [3]. At low temperatures , spin waves excitations contribute to the internal energy per site . Following Tang and Hirsch [25], we first calculate using the QMC method and then by fitting the spin-wave contribution to the internal energy, we estimate . While for the Hubbard model, the spin wave velocity for is bigger than the experimental value, for the parameter set proposed for Sr2CuO2Cl2 we find in fairly good agreement with the available data.
The scattering of light from insulating antiferromagnets at a low energy scale compared with the charge-transfer gap , provides additional information about the spin dynamics. The shape of the B1g Raman profile has interesting features, namely, a characteristic peak ascribed to 2-magnon excitations, a broad linewidth and a very asymmetric profile with a ”shoulder-like” feature at higher frequencies, but close to the 2-magnon peak. At a first sight, the two latter features seem to be mainly due to different physical phenomena, namely spin-phonon interaction [28] and quantum spin fluctuations respectively[26]. Evidence for other contributing mechanisms to the width of the 2-magnon line, aside from the quantum spin fluctuations, comes from the fact that the half-width of the B1g Raman response has almost the same value for members of the M2CuO4 series although the exchange constant changes by , i.e. the width of the line does not scale with . Furthermore, it was argued recently that the spin-phonon interaction can be responsible for the broad linewidth observed on this geometry [28]. In fact, ED and QMC calculations of the Raman cross section on the 2D-AFH model supplemented with spin-phonon interactions describe the broad linewidth observed in the insulating compounds of high-Tc superconductors. Despite the theoretical success in describing the position and linewidth of the 2-magnon line, current results suggest that the description of the ”shoulder-like” feature, whose position was assigned experimentally to , require to go beyond the minimal AFH model. In fact, a detailed study of the effect of four-magnon scattering in the 2D-AFH model shows that the intensity of the Raman signal results too small to fully account for the experimental data[29].
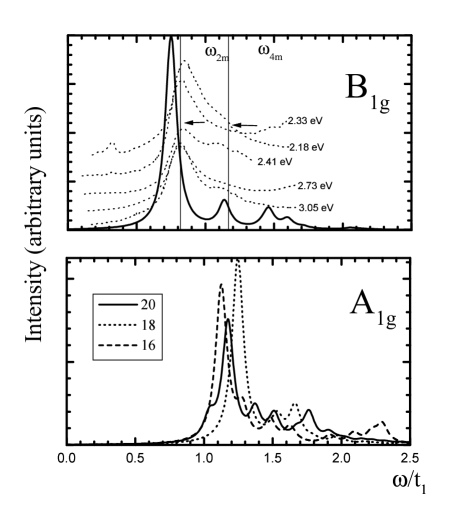
Additional terms ( multispin interactions) appear quite naturally from the one-band Hubbard model scheme. In fact, by performing a canonical transformation up to 4th order on the Hubbard model[30] one obtains an effective spin Hamiltonian which besides the antiferromagnetic exchange interactions up to third-nearest neighbors, includes a 4-spin cyclic exchange term with strength . At , the exact and effective ground state energies differ by less than ( see S.Bacci et al. in Ref.[26]). In Fig.(3), we plot the non-resonant B1g Raman spectrum obtained from ED calculations on a x cluster. In this calculation, we use the traditional Hamiltonian for describing the interaction of light with spin degrees of freedom,i.e. the Loudon-Fleury Hamiltonian, which in standard notation is written as
| (3) |
and the now standard continued fraction approach[27] to obtain the Raman line. Although, we did not perform finite-size scaling, finite-size effects are small because of the local nature of the Raman operator. The calculation of the resonant scattering contribution to the Raman signal is out to the scope of this work. As for the resonant case[12], the non-resonant B1g profile is composed of two structures, namely a 2-magnon peak at and a side band centered around , in reasonable agreement with the experimental values[4]. The Raman signal around is mainly due to 4-spin cyclic exchange interaction terms.
The first moment of this line is . Within the context of the AFH model, we obtain from ([5]), the exchange constant which is roughly consistent with as inferred from neutron scattering[3]. For the Hubbard model, the 2-magnon excitation energy depends not only on the bare exchange constant but also on the degree of frustation introduced by and neighbors exchange processes. These terms produce a shift of the peak towards zero frequency[31] and as a consequence a strong renormalization of the microscopic could take place. Our results, based on the Hubbard model, suggest that is almost the effective . For the A1g symmetry, the Raman operator given by
| (4) |
does not commute with the effective spin Hamiltonian and produces a signal in this otherwise forbidden channel. The A1g line shape is very asymmetric with almost all the spectral weight around . At higher frequencies, multimagnon scattering gains intensity, making this line broader than for the B1g symmetry.
V Summary
In summary, our observations and conclusions support previous analytical work base on a systematic low-energy reduction of complicated multiband onto a single-band Hubbard model. We find that a single-band Hubbard model supplemented with hoppings up to nearest neighbors describes several experimental features observed on insulating Sr2CuO2Cl2. Let us emphasize that, while the parameters of this single-band model were determined from a experimental ARPES data points ( not a fit ), charge degrees of freedom, we were also able to describe as well spin excitations. Our results for the quasiparticle dispersion resemble the ARPES dispersion and suggest that the almost dispersionless part ( relative to ) around could be ascribed to long-range hopping processes. Although, and introduce frustration on the magnetic background, the system is still an antiferromagnet. Our results for the description of spin excitations have implications for the interpretation of the mid-infrared optical absorption in undoped lamellar copper oxides[2]. Multispin terms, introduce multimagnon processes that, could contribute significantly to the weight of the sidebands[32].
VI Acknowledgements
We thank A.Aligia for his help and encouragement. We acknowledge useful conversations with M.D.Nuñez Regueiro and with O.Wells about ARPES data. F.L, J.E., C.D.B., and E.R.G. are supported by CONICET, Argentina. Partial support from Fundación Antorchas under grant 13016/1 is gratefully acknowledged.
REFERENCES
- [1] B. O. Wells et al., Phys. Rev. Lett. 74, 964 (1995).
- [2] J. D. Perkins et al., Phys. Rev. Lett.71, 1621 (1993).
- [3] M. Greven et al., Phys. Rev. Lett.72, 1096(1994).
- [4] G. Blumberg et al., STCS-1153, Dept. of Physics, University of Illinois at Urbana-Champaign
- [5] E. Manousakis, Rev. Mod. Phys. 63,1(1991).
- [6] H. B. Schüttler and A. J. Fedro, Phys. Rev. B45, 7588 (1992); M. E. Simón and A. A. Aligia, Phys. Rev. B 53,15327(1996) and references therein; E. Dagotto, Rev. Mod. Phys. 66, 763 (1994), and references therein.
- [7] D.C.Mattis and J.M.Wheatley, Mod. Phys. Lett. 9,1107(1995).
- [8] D. Duffy and A. Moreo, Phys. Rev. B52,15607(1995).
- [9] See for example: J. Annett et al., Phys. Rev. B40,2620(1989); M. S. Hybertsen et al., 41,11068 (1990); V.I.Belinicher et al., 50,13768(1994); J.J.Jefferson et al., 45,7959(1992).
- [10] J. R. Schrieffer, X. G. Wen, and S. C. Zhang, Phys. Rev. B39,11663(1989).
- [11] N. Bulut, D. J. Scalapino and S. R. White, Phys. Rev. Lett. 73,748(1994).
- [12] A. V. Chubukov and D. M. Frenkel, Phys. Rev. Lett.74,3057(1995).
- [13] M.E.Simón et al, Phys. Rev. B54,R3780(1996).
- [14] Out of half-filling, the relation between and can be found in L.Chen et al, Phys. Rev. Lett. 66,369(1991).
- [15] D. Vaknin et al., Phys. Rev. B41,1926(1994); L. P. Le et al., Phys. Rev. B42,2182(1994).
- [16] A. Nazarenko et al., Phys. Rev. B 51, 8676 (1995).
- [17] P. W. Leung and R. J. Gooding, Phys. Rev. B52,15711(1996).
- [18] O. A. Starykh, O. F. de Alcantara Bonfim and G. F. Reiter, Phys. Rev. B52, 12534(1995).
- [19] G. Martínez and P. Horsch, Phys. Rev. B44,317(1991); F. Lema et al., (unpublished)
- [20] E. R. Gagliano, S. Bacci and E. Dagotto, Phys. Rev. B42,6220(1990).
- [21] T.Xiang and J.M.Wheatley, Phys. Rev. B54, R12653(1996).
- [22] F.Lema and A.A.Aligia, , Cond-mat 9702100. Using the self-consistent BA on the strong coupling limit of a generalized Hubbard model and the wave function of the polaron, they found the quasiparticle residue over the BZ. The results are in good agreement with photoemission data in Sr2CuO2Cl2.
- [23] R.Preuss, W.Hanke, and W.von der Linden,Phys. Rev. Lett. 75, 1344(1995).
- [24] E. Dagotto, A. Nazarenko, and M. Boninsegni, Phys. Rev. Lett. 73,728 (1994); E. Dagotto, A. Nazarenko, and A. Moreo, , 74, 310(1995).
- [25] J. E. Hirsch and S. Tang, Phys. Rev. Lett.62, 591(1989).
- [26] E. R. Gagliano et al., Europhysics Lett. 12259,(1990); S. Bacci et al., in High-temperature superconductivity, edited by J. Ashkenazi et al. (Plenum, N.Y.1991); S. Sugai, Solid State Comm. 75,795(1990); M. Roger and J. M. Delrieu, Synth. Met. 29,F673(1989)
- [27] E.R.Gagliano and C.Balseiro, Phys. Rev. Lett. 59, 2999(1987).
- [28] F. Nori et al., Phys. Rev. Lett. 75,553 (1995); M. J. Reilly and A. G. Rojo, Phys. Rev. B53 ,6429(1995).
- [29] C. M. Canali and S. M. Girvin, Phys. Rev. B45,7127(1992).
- [30] A. H. MacDonald et al., Phys. Rev. B41,2565(1990).
- [31] F. Nori et al., Phys. Rev. Lett. 68, 240 (1992).
- [32] J. Lorenzana and G. A. Sawatzky, Phys. Rev. Lett.74,1867(1995).