[
Amorphous indium phosphide from first principles
Abstract
We report detailed and extensive first-principles molecular-dynamics (MD) simulations of the structure and electronic properties of amorphous InP produced by rapid quenching from the liquid. The structure of the material is found to be strongly ordered chemically, even though there is a significant number of coordination defects and despite the presence of odd-membered rings. We find, as a consequence, that there exists “wrong bonds” in the system, in an amount of about 8%; these result from the presence of coordination defects, not of local composition fluctuations, as has been conjectured. The system, in fact, is found to be over-coordinated, which might be the reason for the observed higher density of a-InP compared to c-InP. We have also investigated the possibility of pressure-amorphizing InP. Our calculations indicate that the cost of a transformation of the compressed zinc-blende crystal into an amorphous phase is so large that it is very unlikely that it would take place.
pacs:
PACS numbers: 61.43.Bn, 61.43.Dq, 64.70.Pf, 71.23.CqSubmitted to Physical Review B
]
I Introduction
Despite considerable work over the last few decades, precise understanding of the static and dynamic structure of glasses and amorphous materials remains a challenge to theorists and experimentalists. [2, 3, 4, 5, 6] Only average properties of these materials are accessible to experiment; even in such a simple material as a-Si, a covalent semiconductor, detailed experimental knowledge of the atomic arrangements on the local lengthscale is missing. The average coordination number of a-Si, for instance, is not known exactly, though it appears that it is almost the same as for c-Si, i.e., 4.[7] The only way of obtaining detailed microscopic information on the local atomic structure is thus via theoretical modelling. In particular, ab-initio molecular-dynamics (MD) simulations, which describe accurately the interatomic potentials, have been able to generate structural models of a-Si and a-GaAs which yield measurable quantities in good agreement with experiment.[8, 9] Ab-initio calculations are, however, computationally very demanding. Empirical potentials such as Stillinger-Weber[10] or Tersoff[11] work reasonably well for Si, Ge and their alloys, but there exist no such models for III-V compounds. Indeed, these materials are inherently much more difficult to model than the corresponding elemental systems because of the added complexity of (partly) ionic bonding, which results in a strong degree of chemical order in the crystal. Despite these difficulties, a set of transferable tight-binding (TB) potentials has been developed for some of the III-V’s, in particular GaAs and GaP.[12] In recent MD studies of a-GaAs[13, 14, 15] and l-GaAs,[16] these models were found to produce results in good agreement with those from ab-initio studies and from experiment.
InP is an important material for the industry of microelectronic and optoelectronic devices, in particular in the field of high-speed computing and communications.[17] In spite of its potential, it has been much less studied than GaAs (the two materials have similar bandgaps), mostly because of the difficulty in fabricating high-quality InP crystals in large enough quantities. Resorting to the amorphous phase of the material might be a way out of this problem; indeed, a-InP is expected to find its way in the fabrication of integrated circuits.
Attempts at fitting a reasonable tight-binding model for InP have so far been unsuccessful and, as mentioned above, there exists no empirical or other potential for this material. A first-principles approach therefore seems to be the only possible avenue for constructing models of the amorphous material. Here we propose a model for stoichiometric a-InP obtained by a melt-and-quench cycle. To our knowledge, this constitutes the very first attempt at constructing a realistic model of a-InP. Experimentally, the structure of the material remains to a large extent unresolved, despite the fact that some structural measurements have been reported in the literature (see below). Several questions pertaining to the local atomic order remain open. In particular, though it is clear that a-InP is disordered from both chemical and structural viewpoints, experiment has not yet given a precise value for the proportion of wrong bonds in the material — and its relation to coordination fluctuations. Thus, for instance, it is not clear if wrong bonds result from the presence of topological defects, such as odd-membered rings, or from local compositional fluctuations (i.e., antisites or clustering) arising from conditions of preparation.[18] In the case of InP, which is rather strongly ionic, heteropolar bonding should be favored over homopolar bonding, and the proportion of wrong bonds consequently reduced.
a-InP is normally produced by flash evaporation of c-InP and deposition onto an appropriate substrate, [18, 19, 20, 21, 22] but it can also be obtained by ion implantation — which in principle yields better-quality material with reproducible properties — though usually not in quantity sufficient for such atomic structural measurements as x-rays to be carried out.[23] There are only very few reports of ion-implantation-amorphization of InP.[24] Other covalent semiconductors, such as Si and GaAs, can also be produced through proper pressure treatment.[25, 26, 27, 28] To our knowledge, a-InP has never been produced in this way. It has however been conjectured that pressure-induced amorphization should not occur in strongly-ionic compound semiconductors.[27] This conjecture has not been verified; it is clearly of interest to examine the question in the case of InP, which is significantly more ionic than GaAs (0.421 vs 0.310 — cf. Ref. [29]).
We have therefore also examined, in the course of this study, the possibility of fabricating a-InP through the application of pressure. Our computer simulations indicate that InP does not amorphize under pressure, even for values largely in excess of those required for the system to transform into the high-pressure NaCl phase. The energy of the compressed zinc-blende crystal, we find, remains lower than that of the amorphous phase produced from the melt, even at higher density. Thus, there is no chance for amorphization to take place: the cost of breaking the strong ionic bonds is just too large. In fact, the system is found to undergo a transition to a complex — but ordered — phase that maintains the chemical order of the system, i.e., that introduces no wrong bonds. Thus, it appears that, indeed, strongly-ionic materials are not good candidates to pressure-induced amorphization: more “violent” processes are required, and this suggests that the amorphous phase cannot exist in absence of wrong bonds.
There is definite experimental evidence that MeV-ion-bombarded c-InP contracts with respect to equilibrium material.[30] The density of a-InP, in fact, is slightly (a fraction of a %) larger than that of c-InP, which is a bit surprising in view of the fact that both a-Si and a-GaAs are less dense than their crystalline counterparts.[31, 32] Our calculations are consistent with this observation in that the system is found to be, on average, overcoordinated, while the average bond length is larger than in the crystal. In contrast, using ab-initio MD and TB-MD, we have found a-GaAs — which is less dense than c-GaAs — to be undercoordinated, albeit only slightly.[9, 14, 15]
Our paper is organized as follows. In Sec. II, in order to put our contribution in proper perspective, we present a summary of the information known from both experiment and theory on a-InP. In Sec. III, we provide details of our computational framework, including a description of the ground state (zinc-blende) and high-pressure (NaCl) phases. Discussion of our results for the model prepared by melt-and-quench is given in Sec. IV. There, we first present the results for the liquid phase, in particular static structure and diffusion. The structure and properties of the amorphous, low-temperature, phase is discussed next in terms of radial distribution functions, static structure factors, distribution of bond and dihedral angles, coordination numbers and bonding characteristics, vibrational properties, and density of electron states. In Sec. V, finally, we present our findings on the possibility of amorphizing InP through the application of pressure.
II Background
A Experiment
To our knowledge, only very few X-ray or EXAFS, [19, 20, 21] and only one electron diffraction,[18] experiments of a-InP (prepared by flash evaporation and deposition, and usually non-stoichiometric) have been reported; the accuracy of these meaurements, as we discuss now, does not allow a precise determination of the local atomic order. The measured nearest-neighbour distances and coordination numbers for the various types of correlations are listed in Table I. The error bar on the nearest-neighbour distances is reported to be 0.02–0.05 Å, while on the coordination numbers, these are of the order of 0.4–0.5, but this also depends on the model used to fit the EXAFS data, as can be seen in Table I for In33P67.
The proportion of wrong bonds in the above measurements is reported to be anything between 10 and 40 % (after taking care of the off-stoichiometry of the samples). The origin of the wrong bonds is not at all clear; part of the problem arises because of variations of composition (which, at this level, can be very significant): while Flank et al.[20] believe that the system partly phase separates (i.e., clustering of the excess P takes place), Udron et al.[21] indicate that the P is more-or-less uniformly distributed in the samples. It is also suggested that wrong bonds are due to local composition fluctuations rather than the presence of topological defects,[18, 19] and in particular odd-membered rings.
The total coordination number of each species is found in general to be quite close to 4, as can be seen in Table I (summing the partial coordinations), and this is also consistent with core-level-shift measurements.[19] It is therefore tempting to conclude that odd-membered rings are absent in a-InP (though, of course, a perfect average total coordination of 4 does not preclude the existence of odd-membered rings) and, likewise, that wrong bonds are absent. However, using the same set of EXAFS data but different fitting schemes, Flank et al.[20] found the coordination of In to be either 4 or 4.8, as indicated in Table I. The error bar on these numbers is very significant and evidently prevents firm conclusions from being drawn. In fact, based on the “measured” coordination numbers, Flank et al. find a proportion of wrong-bonded In atoms of almost 40%, but only 10% for P; taking the stoichiometry of the sample into account, they indicate that their fitting model must be incorrect. One must conclude, therefore, that the error bar on the experimental values of the partial coordination numbers is so large that, for all practical purposes, they are at present unknown.
Electron diffraction experiments have also been performed[18] on a-InP samples also prepared by flash evaporation and deposition. Though such quantities as partial coordination numbers are not provided, a detailed analysis of the total pair correlation function of the material suggests that a-InP is “more disordered” than a-Ge and other III-V’s: the first nearest-neighbour distance is larger that its crystalline counterpart, with a rather wide spread in the distances; the second peak is shifted towards smaller values, indicating that the average bond angle is smaller; finally, the third peak is more-or-less buried in the background, suggesting that order is totally lost beyond second nearest-neighbours.
These electron diffraction measurements were interpreted in terms of “standard” ball-and-stick, continuous-random-network models, namely those of Polk[33] and Connell and Temkin.[34] The Polk model contains odd-membered rings, while the Connell-Temkin model does not. The measured structure of a-InP seems to be more adequately described by the unrelaxed Connell-Temkin model, i.e., without odd-membered rings, in line with the above remarks. (This also agrees with a recent study of the structure of a-GaAs, as discussed in the next section). It is expected, however, that relaxation of the Connell-Temkin model would bring about odd-membered rings.
B Theory/Models
To our knowledge, no structural model specific to a-InP has been ever been proposed. Only generic ball-and-stick models (Polk, Connell-Temkin) have been used to interpret strutural data; no computer model, based on any kind of potential, has been reported.
Based on such a generic model, the density of electron states has been calculated by O’Reilly and Robertson.[35] It has been found that wrong bonds, presumably the most important type of defects in this material, lead to a significant number of states in the gap, and are therefore extremely important in determining the electronic properties of the material. We will bring additional evidence for this in the present paper.
It is appropriate to mention at this point that an optimized model for another III-V compound, a-GaAs, was very recently developed by one of the authors (LJL) and a collaborator.[15] Using the new “activation-relaxation technique” (ART)[36] for relaxing complex structures at 0 K, a model was built that possesses almost perfect coordination and is essentially free of wrong bonds. In this study, it was demonstrated that a Connell-Temkin-like model, which contains no odd-membered rings, provides a better description of a-GaAs than a Polk-type model, which is more appropriate to elemental semiconductors. Thus, odd-membered rings must be present in a-Si and relatively rare in a-GaAs. How these conclusions apply to InP, however, is not clear: In addition to ionicity, InP differs from GaAs in that the atoms are significantly different in size — Ga and As belong to the same row of the Periodic Table, while In and P are two rows apart. Thus, the competition between elastic deformation energy and Coulomb repulsion will be rather different in the two materials. It is not possible, at present, to carry out ART simulations in order to address this issue since there exists no model potentials for InP.
III Computational framework
As mentioned earlier, our calculations were carried out using now standard first-principles molecular-dynamics [37] plane-wave/pseudopotential methodology in the local-density approximation (LDA),[38] with the exchange-correlation term expressed in the Ceperley-Alder form.[39] The version of the code we use, however, is an implementation of it optimized to run on a block of 32 nodes on a massively-parallel Cray T3D computer located at ÉPFL. As discussed below, this has allowed us to carry out extremely long runs in comparison to what would have been possible on a scalar machine.
All calculations were performed on a constant-volume 64-atom supercell for stoichiometric InP, i.e., 32 In and 32 P atoms. The supercell volume was however changed “by hand” when appropriate (see below). The plane waves were cutoff in energy at 12 Ry, which proves to be essentially converged as far as structural properties are concerned, according to our tests (see also Ref. [40]). The interaction between electrons and ion cores is described in terms of norm-conserving, fully-separable ab initio pseudopotentials of the Kleinman-Bylander form.[41] Only the point was used for integrating the Brillouin zone. The program uses preconditioning,[42] so a rather large timestep of 10.0 a.u. (about 0.25 fs), with a cutoff “mass” of 3.0 a.u., could be used. The fictitious mass of the electrons was set to 300 a.u. A Nosé thermostat, with a “mass” of a.u. was used to control the temperature; we have verified that the structural and dynamical properties of our systems are not significantly influenced by this choice.
We have calculated the total energy as a function of lattice parameter using the above model for both the zinc-blende (ZB, F43m) and the sodium-chloride (NaCl, Fm3m) structures. The latter structure corresponds to the high-pressure phase of InP and other III-V compounds. [43, 44] The results are shown in Fig. 1(a). The total-energy data were fitted to the “universal binding-energy function” (see, e.g., Ref. [45])
| (1) |
where is the fitted equilibrium lattice parameter and and are other fitting parameters. Fig. 1(b) shows the pressure ( at 0 K) for the two phases.
From the data of Fig. 1(a), we find the lattice parameter to be 5.68 and 5.24 Å for the ZB and NaCl structures, respectively. For the ZB structure, the calculated lattice parameter is about 3% smaller than the experimental value (5.859 Å). This discrepancy is largely due to our use of the LDA (which systematically underestimates lattice parameters), and to some extent also to limited Brillouin-zone sampling: the “true” LDA value, obtained by detailed integration, is 5.74 Å,[46] 2% smaller than experiment. For the NaCl structure, the computed value for the lattice constant using the same computational parameters as above is about 9% smaller than experiment — 5.24 vs 5.71 Å. Accurate bulk calculations on this phase show that the error originates in part (about 4%) from insufficient Brillouin zone sampling (-point only) and no Fermi-energy smearing scheme (the NaCl phase is found to be metallic at the theoretical equilibrium volume). A further 4% of the error is recovered by using the non-linear core correction for the exchange-correlation potential,[47] leaving a residual error of about 1% due to the LDA and pseudopotential approximations. In the light of these results, we cannot expect our model to provide an accurate description of this phase with the run-time calculation parameters reported above, which were required for the very long production simulations needed (see below). However, since we are primarily interested in the ZB phase, this will be of relatively little consequence, and we will still be able to draw qualitative conclusions on the possibility of pressure-amorphizing InP (Sec. V). The energy difference between the two phases in our calculation is found to be about 0.11 eV/atom (in favor of ZB), compared to the fully-converged value of 0.15 eV/atom and to about 0.38 eV/atom from experiment. While the error bar on the experimental value is not known, it is likely that part of this difference is due to the LDA approximation.
IV Melt-and-quench amorphization
A Thermal cycle
The thermal cycle used to prepare the amorphous sample by melt-and-quench is summarized in Fig. 2: Starting with a perfect crystal, the system was first equilibrated at room temperature (300 K), then heated up in steps until it melted, and finally cooled as slowly as possible into a glass. It should be stressed that the cooling rate used here, about K/s, is probably the smallest ever achieved in a first-principles simulation of the liquid-glass transition: the total time covered is a formidable 90 ps, compared to, typically, 10 ps in corresponding simulations of other materials. In spite of this, effects of the finite (and still large) cooling rate are expected to be present.
For the lattice parameter of the crystalline phase, we used, at all temperatures, the value obtained above from the 0 K global optimization; it should be noted that the thermal expansion of c-InP is very small,[48, 49] and therefore neglecting this effect is of little consequence. For the liquid, now, the density is larger than that of the crystal. This quantity is very difficult to calculate in the present simulation scheme, but is known (approximately) from experiment. Thus we used, for the liquid, the density of the crystal scaled up by a factor equal to the experimental ratio of liquid-to-crystalline densities,[50] namely 5.1/4.77=1.069. The amorphous phase, finally, is known from experiment (on ion-implanted a-InP) to have a density almost exactly equal (to within 0.5%) to that of c-InP.[30] Again, here, this quantity is very difficult to calculate in the absence of a constant-pressure option; thus, we simply assumed the amorphous-phase density to be the same as that of the crystal, an approximation which should be insignificant compared to other limitations of the study.
Upon heating, the density of the system was changed from that of the crystal to that of the liquid at 1800 K, i.e., somewhat above the experimental melting temperature of InP,[48] K. We found the system to remain crystalline at this temperature, i.e., to be in a super-heated state, a consequence of the finite (short) run time. It was then heated up to 2100 K, and found to melt, and then to 2400 and 3000 K, the highest temperature considered in this study. After cooling (in steps) to 2100 K, the density was changed back to that of the crystal, and the system “annealed” at 2400 K so as to remove the effects of the change in density. Quenching into the glass was then carried out in steps, proceeding more and more slowly into structural arrest (see Fig. 2.)
The system was found to remain liquid (non-zero diffusion on the timescale of the simulations) at temperatures as low as 900 K, indicating a rather strong hysterisis of the melt-freeze cycle. While this is likely a manifestation of finite run times, it can also be attributed, in part, to our use of the LDA, which tends to underestimate the temperature of such transitions: For instance, in a free-energy calculation of the melting of Si, Sugino and Car[51] found a transition temperature somewhat below (300 K) that observed experimentally. It is however expected that finite-size effects on the transition temperature are relatively small. The liquid-glass transition can be seen very clearly in Fig. 3, which shows the total energy versus temperature upon going through the transition at constant density.
The ground-state energy of the amorphous phase lies approximately 0.24 eV/atom above that of the crystal. This quantity (the latent heat of crystallization) has to our knowledge never been measured in InP; for Si, it varies between 0.14 and 0.20 eV/at, depending on the state of relaxation of the material.[52] Because of the presence of wrong bonds, the heat of crystallization is expected to be larger in III-V materials than in elemental semiconductors, consistent with our result.
B Liquid phase
The liquid was studied in detail at four different temperatures: 3000, 2700, 2400, and 2100 K. The calculated diffusion constants are presented in Table II. The error bar on these numbers is estimated to be of the order of 10%, arising mainly from the limitations inherent to the method (size and time). We find no significant differences in the diffusional behaviour of the two components. From these data, we find an activation energy of about 0.35 eV. To our knowledge, the diffusion constants are not known from experiment for InP; to give an experimental reference for a comparable system,[50] in the case of liquid GaAs, cm2/s at 1550 K, i.e., a bit larger than the values we find here (extrapolating to lower temperatures).
The structure of the liquid at the various temperatures considered was analyzed in terms of radial distribution functions, static structure factors, and coordination numbers. The velocity auto-correlation functions and distribution of vibrational states were also calculated.
The partial radial distribution functions (RDF’s) (where is the correlation function for – pairs, is the relative concentration of species , and is the average number density) provide detailed information about the short-range arrangements of atoms in the system; they are shown in Fig. 4 for the lowest examined at the liquid density, viz. 2100 K. We find the liquid, independently of temperature, to have relatively little structure, essentially restricted to the first or perhaps second nearest-neighbour peak. Thus, there are essentially no correlations beyond a distance of about 3.5 Å, and the “minimum after the first peak” is almost non-existent, except for P-P correlations, which seem to exhibit a well-defined minimum as well as a second-neighbour peak at this temperature. As discussed below, this absence of a marked structure will make it rather difficult to define coordination numbers.
Likewise, we show in in Fig. 9 the partial, , and total, , static structure factors (SSF’s) of the liquid at the lowest temperature. The SSF’s are related to the RDF’s by a Fourier transform and are in principle available directly from scattering experiments (neutrons, x-rays, etc). The SSF’s were evaluated directly in reciprocal space in order to avoid the spurious oscillations that arise in the Fourier transform of a function that does not terminate smoothly (as is the case for finite-size models). Just like the radial distribution functions, the static structure factors show relatively little structure. We know of no experimental l-InP data to compare these results with.
The results of Fig. 4 show the most strongly-marked correlation at short range to consist of In-P hetero-bonding. This is roughly twice as important as In-In and P-P bonding, which are nevertheless present in very significant number. Thus, “wrong bonds” are very present in this phase (and of course totally absent in the perfect crystal), very likely a consequence of the metallic-bonding properties of the liquid, and in qualitative agreement with the first-principles calculations of l-GaAs by Zhang et al.[53]
As noted above, defining coordination numbers in such a system is not simple. We plot in Fig. 6 the “running coordination numbers”, i.e., integrated radial distribution functions, . If coordination numbers were well defined, one would see “plateaux” in these functions, corresponding to the successive neighbour shells, i.e., minima in the corresponding radial distribution functions. Clearly there are no such plateaux here. Nevertheless, we list in Table III the coordination numbers obtained by choosing some “reasonable” first-neighbour distances (as indicated in the Table).
We find, despite the large error bars, the coordination numbers to decrease markedly with decreasing temperature, i.e., the covalent character of the material is increasing upon approaching the transition temperature. This is true of all three types of partial correlations, and of course also of the average (total) coordination number. The latter, , decreases from 8.7 at 3000 K to about 7.0 at 2100 K. We can extrapolate that, at the melting temperature of InP (1335 K), would be about 6.0, as is approximately found in Si just above melting.
Fig. 7, finally, gives the density of vibrational states for each atomic species, as well as overall. These were obtained by Fourier transforming the velocity auto-correlation functions. Though the density of states for In atoms show essentially no structure — it decreases rapidly with frequency — that for P atoms possesses a shoulder in the 20–40 meV range. This is likely related to the transverse and longitudinal optical phonon peaks in c-InP, respectively at 41 and 45 meV (in the present model; see below), and is manifest of the fast motion of the light P against the heavy In atoms. The frequency of this peak should therefore increase upon decreasing the temperature; indeed, this is is what we find upon examining at various temperatures (not shown).
C Amorphous phase
1 Radial distribution functions and static structure factors
The partial RDF’s for the fully-relaxed amorphous model at 300 K are presented in Fig. 8; also shown is the total (equi-weighted) RDF, . We observe that the partial In-P RDF is quite similar (in shape) to the total RDF, reflecting the fact that, as expected, unlike-atom correlations largely dominate in the amorphous sample at short distances. In the ideal ZB structure, of course, only hetero bonds are allowed and the first peak of the total RDF coincides with that of the In-P partial RDF. In the amorphous material, homo bonds are possible to some extent, even though hetero bonds prevail, as we discuss below.
The presence of homo bonds is especially evident in the P-P partial correlation; they manifest themselves as a small peak in the RDF at a distance of 2.19 Å, close to the P-P covalent bond distance (2.20 Å, twice the covalent radius). This distance is somewhat shorter than the In-P bond distance (2.51 Å). In the case of In-In, we observe a shoulder, or prepeak, at a distance of 2.81 Å, now larger than the In-P bond distance, but again close to the covalent bond distance (2.88 Å). These effects can clearly be attributed to the size and ionicity differences between the two species (In is substantially larger than P.) In contrast, in a-GaAs, like-atom peaks are found at about the same distance as the unlike-atom peak. The nearest-neighbour distances we find agree quite closely with those from experiment reported in Table I (though at different chemical compositions). For P-P, we find 2.19 Å, vs 2.20-2.24 from experiment; for In-P, we obtain 2.51 Å, compared to 2.57–2.59 experimentally; and for In-In, which is most difficult to define, as is also the case experimentally, we have 2.81 Å vs 2.76–2.98. We note that part of the observed difference arises from our model underestimating (by about 3%) the lattice parameter of the real material as discussed earlier; in view of this, we conclude that our model is in close agreement with experiment as far as nearest-neighbour distances are concerned and modulo the error bars inherent to both methods.
In the crystal, the equilibrium LDA In-P bond distance is 2.46 Å, while second nearest-neighbours lie at 4.02 Å. In our amorphous sample, we find, from the total RDF (Fig. 8), the nearest-neighbour peak at 2.51 Å, a bit larger than the corresponding value in the crystal. In contrast, the second-neighbour peak is at about 3.9 Å, thus shifted towards smaller values compared to the crystal, and is much broader. In fact, it is clear from Fig. 8 that the second peak is made up of at least two subpeaks, with a shoulder at about 4.4 Å arising from In-P correlations. In any case, these observations agree with the electron diffraction data of Ref. [18], discussed in Sec. II A.
It is clear from Fig. 8 that the concept of nearest-neighbour distances in the amorphous phase is somewhat ill-defined, especially in the case of In-In correlations, where the first peak is almost merged into the second peak. In fact, the “second-neighbour” peak, for all correlations, is rather wide, consisting of several sub-peaks, reflecting the large spectrum of possible configurations in the disordered phase. All correlations seem to differ little from unity beyond the second peak, indicating that order, in the amorphous phase, is indeed very short-range, restricted to the first- and second-, perhaps third-, neighbour shells. We note, also, that second-neighbour peaks differ very significantly in shape from the corresponding peaks in crystalline material.
For completeness, we present in Fig. 9 the partial and total SSF’s for our model sample. The total SSF was obtained by combining the partial with equal weights. [In principle, is a weighted sum of the partials, where the weights are related to the scattering lengths of the atoms for the probe used.] The total interference function (essentially the SSF) of a-InP at almost stoichiometric concentration, measured by electron diffraction, has been reported by Gheorghiu et al.[18] They observe a small peak at 2.1 Å-1, and three large peaks at 3.5, 5.7, and 8.0 Å-1, respectively. This correlates extremely well with the total SSF displayed in Fig. 9.
2 Bond and dihedral angles
We give in Fig. 10(a) the distribution of bond angles in the amorphous structure, all combinations taken into account. As can be inferred from the above discussion, the definition of “bond” is somewhat arbitrary. The cutoff distances we used, extracted from the corresponding RDF’s (Fig. 8) are 2.91, 3.13, and 2.55 Å for In-In, In-P and P-P, respectively; the value for In-In, which hardly exhibits a nearest-neighbour peak, is subject to a significant error. These cutoff distances will also be used for determining the coordination numbers, below.
The bond-angle distribution is wide but exhibits a strong peak at about 107∘, a little bit smaller than the tetrahedral angle (109.5∘). A shift of the bond-angle peak to smaller values has also been observed by electron diffraction.[18] A similar shift has been obtained theoretically by Stich et al. for a-Si.[8] The bond-angle distribution here differs from the case of a-Si in that it shows a rather marked shoulder at about 90∘ — likely arising from four-membered rings and from those atoms that are five- or six-fold coordinated — as well as a weak shoulder at about 150∘, which perhaps originates from three-fold coordinated atoms. It is quite remarkable that there exists almost no correlations with an angle of 60∘. This is in sharp contrast with other tetrahedral semiconductors (elemental or compound), modeled either empirically or using TB or first-principles MD, where a significant peak or shoulder is observed at such small angles, arising from small, e.g., three-membered, rings. This indicates that the chemistry of this system is robust enough that such defects are rare (three-membered rings are extremely costly in both elastic-deformation and electronic-repulsion energies while four-membered rings cost only elastic energy), as can indeed be verified in Table IV, and/or the relaxation of the present model has been particularly effective. (Ring statistics are extremely sensitive to details of the local structure, and in particular coordination; this explains the sizable differences between a-InP and a-GaAs in Table IV.)
In Fig. 10(b), we give the distribution of dihedral angles (angles between second-neighbour bonds). In the ZB structure at low temperatures, the corresponding distribution has two sharp peaks, at 60 and 180∘. In the case of a-InP, we observe a rather flat distribution, except for two small dips at 0 and 120∘ (which are equivalent, on average, for tetrahedral systems), perhaps a memory of the crystalline phase, but in any case much less pronounced than the corresponding ones in a-GaAs,[15] which chemically orders a bit more strongly than a-InP (see below).
3 Coordination numbers
The average coordination numbers can be obtained by integrating the appropriate RDF’s up to the nearest-neighbour distances defined above; this and other relevant numbers are listed in Table V, while the “running” coordination numbers — now exhibiting plateaux — are presented in Fig. 11. We obtain in this way a total coordination number of 4.27, in reasonable agreement with the experimental value mentioned above, , i.e., within the uncertainties inherent to both methods.
A detailed picture of the short-range structure is provided by the partial coordination numbers and , In or P, also listed in Table V. We find the partial coordination numbers of In and P to be almost identical — 4.25 and 4.29, respectively. Modulo the limitations mentioned above, this is again in agreement with the available experimental values ( and ). Thus, despite the large difference in size, and because of the strongly ionic character of the material, each atom is surrounded by the same average number of atoms. In this sense, it can be said that all atoms occupy the same volume.
If we detail further the average coordination numbers, we find, from Table V, that coordination essentially consists of hetero bonding, i.e., the system is chemically ordered. Thus, in the case of In, out of the 4.25 neighbours, 3.91 are P and only 0.34 are In. Likewise, for P, which has 4.29 neighbours, we have 3.91 In and 0.38 P. We also see, upon comparing with the TB-MD results for a-GaAs, that the chemical short-range order appears to be a bit stronger in the latter. However, it must be said that the data reported in Table V (and following) were obtained using the ART procedure, which allows more extensive relaxation of the network than is possible with MD.
Modulo the error bars, the average coordination number is larger in the amorphous phase than in the ZB crystal at equal density, i.e., there are a number of overcoordinated atoms. This can be seen in Table VI, where we present the distributions of coordination numbers in our amorphous sample. Even though the distribution is rather sharply peaked, there are nevertheless a significant number of coordination defects. In fact, we find, overall, very few (1.9%) atoms that are undercoordinated (), while quite many (26.8%) are overcoordinated. This, again, contrasts quite sharply with a-GaAs, which is slightly undercoordinated; this might be the cause, in part, for the observation of a lower density in a-GaAs than in c-GaAs.[31] (Disorder itself is expected to cause a decrease in density). In contrast, the predominance of overcoordinated defects in a-InP is likely responsible for its larger density compared to c-InP,[30] given, as we have seen above, that the average bond length in the amorphous phase is larger than in the crystal.
4 Chemical disorder and wrong bonds
A quantitative measure of chemical correlations in the binary compound is provided by the “concentration-concentration” coordination number, (see, e.g., Ref. [4]) where is the concentration of -type atoms in the system. exactly in c-InP; for our amorphous sample, we find (Table V), indicating, as was already evident from the above discussion, a rather strong chemical order. Chemical order can also be quantified in terms of the generalized Warren chemical short-range order parameter,[4] , where . indicates complete randomness whereas positive and negative values indicate preference for homo and hetero nearest-neighbour coordination respectively. Evidently, in c-InP, ; for a-InP, we obtain (cf. Table V), revealing, again, a strong preference for chemical ordering, a bit weaker, perhaps, than in a-GaAs, for which the TB-MD model gives and . This, again, reveals the importance of Coulombic ordering in InP and GaAs.
The overall similarity between the RDF’s of group-IV materials and the III-V semiconductors suggests that the materials have comparable short-range structure.[54] However, as discussed above, there exists a significant number of coordination defects, such that the overall coordination exceeds, in the present case, the canonical value of 4. Likewise, the structure exhibits a significant number of “anomalous” rings — as can be seen from Table IV — and in particular odd-membered, just as they can be found in a-Si or a-Ge. An immediate consequence of this is that there must exist “wrong” bonds in the structure. We find in our model that 8.4% of the bonds are wrong (cf. Table V). Such a proportion of wrong bonds is remarkably small in view of the fact that the system is slightly overcoordinated and thus is manifest of the excellent quality of the model.
Experimentally, the proportion of wrong bonds has been reported to lie in the range 10–40%.[20] The large spread in the values reported is explained by the fact that some samples are believed to phase separate. It has been conjectured, also, that the wrong bonds in a-InP might originate from local composition fluctuations rather than coordination defects. Our calculations indicate that coordination defects are responsible for the wrong bonds. It is perhaps appropriate to remark that it is quite difficult to imagine an amorphous network without coordination defects and/or odd-membered rings, but of course the density of such defects is not known precisely and probably depends quite strongly on the “method of preparation”, be it experimental or computational. In fact, the “effort” required to reduce the proportion of wrong bonds to a value smaller than the present 8.4% would appear to be formidable if it is a consequence of model limitations, and in particular the quench rate used in the MD simulations. In any event, the proportion of wrong bonds we obtain here must be taken as an upper limit to the actual value: it is certainly the case that the number would decrease if corresponding simulations were carried out on a larger system, so as to minimize the elastic constraints, on longer timescales, in order to allow more complete relaxation. An ART optimization could resolve the issue;[15, 36] however, this is presently not feasible ab initio, or otherwise, since there exists no model potentials for InP.
5 Vibrational properties
The partial and total densities of vibrational states (DOS) as deduced from our model are presented in Fig. 12(a); for reference, we give, in Fig. 12(b), the corresponding DOS for c-InP calculated within the same computational framework. To our knowledge, there exists no experimental measurements of this quantity for a-InP, while the vibrational spectrum of the crystalline material is well characterized.[49, 48] Thus, in c-InP, rather wide TA and LA bands are found in the range 6–9 and 20–23 meV, respectively, while more sharply defined, TO and LO peaks are seen at about 37 and 42 meV, respectively. In the present calculation, we find a large TA peak at about 7-8 meV, and a fairly broad LA band in the range 16-22 meV. The sharp optic peaks are found at 41 and 45 meV, respectively. Thus it appears that our model overestimates a little bit the energy of the optic peaks, while it underestimates a little the energy of the LA band. It must be said, however, that the low-frequency acoustic modes are the most difficult to probe with molecular dynamics (explaining, in part, the oscillatory structure at low energies).
The density of states of our model a-InP agrees, “broadly” speaking, with that of c-InP, except for a significant softening of the higher-energy peaks. The total DOS exhibits a well-defined peak at about 7–10 meV, corresponding to the crystal’s TA peak, a broad band centered at about 18 meV, close to the crystal’s LA peak, and two well-defined peaks at 32 and 38 meV, corresponding to the crystal’s TO and LO bands.
Fig. 12 reveals yet another feature in the DOS which is absent in the crystal, as well as in elemental semiconductors, namely a (rather broad) peak at high frequency — about 55 meV. It is clear from Fig. 12 that the optic peaks are primarily associated with the fast and energetic motion of the lightest atom, P, against the heavier one, In. (Cf. also the discussion concerning Fig. 7 in Sec. IV B.) In view of this, and of the fact that wrong bonds do not exist in elemental semiconductors (while other defects, e.g., coordination, do), we conjecture that the band at 55 meV arises from the motion of phosphorus atoms against one another, i.e., P-P wrong bonds. (Because of the heavier mass of indium, In-In wrong bonds will show up at much smaller energies, and therefore be buried in the continuum of states. For similar reasons, a high-energy wrong-bond peak has not been observed in the DOS of a-GaAs.)[15] It would be of utmost interest that experimental confirmation of this point be carried out, since this would give a direct indication of the presence of wrong bonds and a measure of their relative importance.
6 Electronic properties
We have calculated the density of electron states for our model a-InP at 0 K; the results are shown in Fig. 13. (In order to improve presentation — in view of the limited statistics of the model — the density of states has been smoothed lightly using a Gaussian filter of width 0.15 eV.) The forbidden energy gap, about 1.08 eV, is clearly visible about the Fermi energy. For crystalline InP in the ZB phase, our computed value for the LDA direct gap at the point is 1.50 eV (at = 5.68 Å) and compares well with the value 1.50 eV of Ref. [55] and with experiment, 1.42 eV. The gap of a-InP, therefore, is a bit smaller than that of the crystalline material.
One important difference, however, is that there are defect states in the gap of a-InP not present in (ideal) c-InP. Thus, we have identified one particular electron level giving rise to contributions near mid-gap in , clearly visible in Fig. 13. We have examined the local density of states for this particular level, and found that it corresponds to an empty, distorted, octahedral, mostly-indium (five out of six corners), “cage”, i.e., basically, a cluster of wrong In-In bonds. That wrong bonds give rise to states in the gap has also been inferred from a comparison of a Polk-type (with wrong bonds) with a Connell-Temkin-type (without wrong bonds) model for a-GaAs, as discussed above (Sec. II B).
V Can amorphization be pressure-induced?
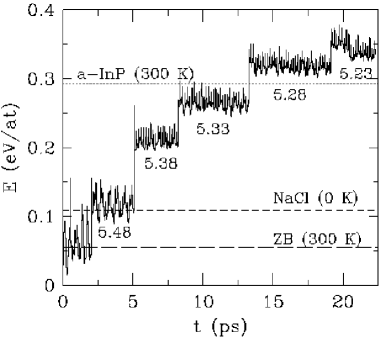
In an attempt to verify the possibility that InP could amorphize under compression, we subjected the equilibrium ZB structure to pressure by increasing “slowly”, in steps, the density. Referring to Fig. 1(b), we find the correspondence between pressure and density (in fact the lattice parameter). Starting with InP in its perfect ZB arrangement, properly equilibrated at 300 K, the lattice parameter was thus decreased (always at 300 K) from 5.68 Å (equilibrium) to 5.23 Å, i.e., down to a value smaller than (cf. Sec. III) the equilibrium lattice constant for the NaCl phase. From Fig.1(a), we would expect the ZB crystal to undergo a transition to the high-pressure NaCl phase in the MD run when is set to values below about 5.4 Å. (This value corresponds to a pressure of about 140 kbar; at the highest density investigated here, for Å, the pressure in the ZB structure is 270 kbars [cf. Fig. 1(b)].)
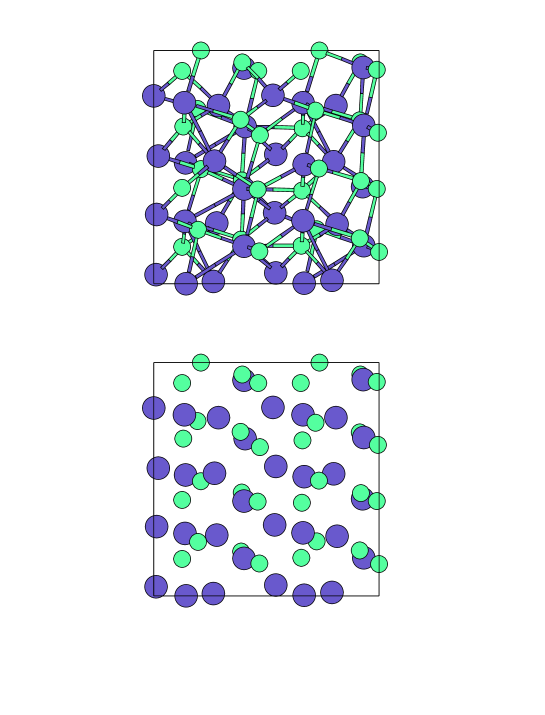
Fig. 14 shows the evolution of the total energy of the system at 300 K relative to the ZB crystal at 0 K, as a function of time-density. For reference, we also show on this plot the total energy of the equilibrium ZB phase at 300 K, the total energy of the amorphous phase (also at 300 K) at the equilibrium density, and the total energy of the NaCl phase at 0 K, obtained as discussed earlier. We find that the energy increases rather smoothly with density. At a value of Å, visual inspection of the system indicates that it undergoes some sort of distortion into a state which is definitely not ZB, but which bears strong resemblence to it. This distortion is also visible in Fig. 14 as a slight decrease of the total energy as a function of time. At density values corresponding to lattice parameters smaller than about 5.28 Å, the energy of the compressed ZB crystal exceeds that of the amorphous phase. Yet, no transition to an amorphous phase takes place. Upon increasing the density further, we observe another transformation for Å, clearly visible in Fig. 14 — the energy drops significantly, to a state which is evidently distinct from the NaCl structure (its computed energy is much higher). We have not analyzed this phase in detail but it is evidently ordered, as can be seen in Fig. 15, and might possibly be an intermediate state on the way to the NaCl phase. One thing is clear, however: the new phase maintains the chemical order of the system, i.e., introduces no wrong bonds. It would seem, therefore, that pressure is not a proper route for amorphization; rather, the system prefers to reorganize into a new crystalline form, which is more favorable in view of the high cost in energy of wrong bonds.
The argument might be presented in another way: In Fig. 14, we see that the energy of the new phase, 0.33 eV/at, lies only slightly above that of the amorphous phase obtained by the melt-and-quench cycle, 0.29 eV/at. The latter value, however, is at the equilibrium density. Under compression, the energy of the amorphous phase would also go up, presumably by an energy smaller than but comparable to 0.33 eV/at, and thus would largely exceed that of the compressed crystal. In view of this, it is very difficult to imagine that amorphization could take place under compression. Rather, a transition to the NaCl phase would take place.
The emerging picture suggested by our simulations is that InP does not amorphize under pressure, even at values largely exceeding those required for the system to transform into the high-pressure NaCl phase. The energy of the amorphous phase lies well above that of the compressed crystal and the cost of breaking the strong ionic bonds is just too large. The system, rather, finds its way into a complex, but ordered, phase that maintains the chemical order of the system, i.e., that does not introduce wrong bonds. It appears, therefore, that, indeed, strongly-ionic materials are not good candidates to pressure-induced amorphization:[27] more “violent” processes (such as implantation) are required, and this suggests that the amorphous phase cannot exist in absence of wrong bonds. Though we have not examined this, it is not impossible that InP would amorphize from the high-pressure phase upon the release of pressure and/or through proper heat/pressure treatment. In view of the above energy-wise arguments, however, this seems to be very unlikely.
VI Concluding Remarks
We have carried a detailed and extensive first-principles molecular-dynamics study of the structure and electronic properties of amorphous InP produced by rapid quenching from the liquid. The structure of the material is found to be strongly ordered chemically, about the same, for instance, as in a-GaAs, even though there are a significant number of coordination defects (antisites) and despite the presence of odd-membered rings. We find, as a consequence, that there exists “wrong bonds” in the system, in an amount of about 8%; these are a consequence of the presence of defects in the system, not of composition fluctuations, as has been conjectured. The system, in fact, is found to be over-coordinated, which might be the reason for the observed higher density of a-InP compared to c-InP. We have also investigated the possibility of pressure-amorphizing InP. Our calculations indicate that the cost of a transformation of the compressed zinc-blende crystal into an amorphous phase is so large that it is very unlikely that it would take place.
Acknowledgements.
It is a pleasure to thank Dr. Normand Mousseau and Prof. S. Roorda, for useful comments and critical reading of this manuscript. LJL is grateful to Prof. Car for hospitality and support at IRRMA where most of the work was carried out. Support from the Natural Sciences and Engineering Research Council (NSERC) of Canada and the “Fonds pour la formation de chercheurs et l’aide à la recherche” of the Province of Québec is also gratefully acknowledged.REFERENCES
- [1] Author to whom correspondence should be addressed. Permanent address and address for correspondence: Département de Physique et GCM, Université de Montréal, Case Postale 6128, Succursale Centre-Ville, Montréal, Québec, Canada H3C 3J7; electronic mail address: lewis@physcn.umontreal.ca
- [2] W.H. Zachariasen, J. Am. Chem. Soc. 54, 3841 (1932).
- [3] J.S. Lannin, J. Non-Cryst. Solids 97&98, 39 (1987).
- [4] S.R. Elliott, Physics of Amorphous Materials (Longman, London, 1983).
- [5] S.R. Elliott, Advances in Phys. 38, 1 (1989).
- [6] F. Yonezawa, J. Non-Cryst. Solids 198-200, 503 (1996).
- [7] K. Laaziri and S. Roorda, private communication.
- [8] I. Stich, R. Car, and M. Parrinello, Phys. Rev. B 44, 11 092 (1991).
- [9] E. Fois, A. Selloni, G. Pastore, Q.-M. Zhang, and R. Car, Phys. Rev. B 45, 13 378 (1992).
- [10] F.H. Stillinger and T.A. Weber, Phys. Rev. B 31, 5262 (1985).
- [11] J. Tersoff, Phys. Rev. B 39, 5566 (1989).
- [12] C. Molteni, L. Colombo, and L. Miglio, J. Phys. Condens. Matter 6, 5243 (1994).
- [13] C. Molteni, L. Colombo, and L. Miglio, Phys. Rev. B 50, 4371 (1994).
- [14] H. Seong and L.J. Lewis, Phys. Rev. B 53, 4408 (1996).
- [15] N. Mousseau and L.J. Lewis, Phys. Rev. Lett. 78, 1484 (1997); Phys. Rev. B, submitted for publication (BB6376); some of the data referred to in the Tables are unpublished.
- [16] C. Molteni, L. Colombo, and L. Miglio, Europhys. Lett. 24, 659 (1993); J. Phys. Condens. Matter 6, 5255 (1994).
- [17] See, e.g., T.J. Coutts and S. Naseem, Appl. Phys. Lett. 46, 164 (1985).
- [18] A. Gheorghiu, M. Ouchene, T. Rappeneau, and M.-L. Thèye, J. Non-Cryst. Solids 59&60, 621 (1983).
- [19] M. Ouchene, C. Senemaud, and E. Belin, J. Non-Cryst. Solids 59&60, 625 (1983).
- [20] A.M. Flank, P. Lagarde, D. Udron, S. Fisson, A. Gheorghiu, and M.-L. Thèye, J. Non-Cryst. Solids 97&98, 435 (1987).
- [21] D. Udron, A.M. Flank, P. Lagarde, D. Raoux, and M.L. Thèye, J. Non-Cryst. Solids 150, 361 (1992).
- [22] M.-L. Thèye, A. Gheorghiu, D. Udron, C. Senemaud, E. Belin, J. von Bardeleben, S. Squelard, and J. Dupin, J. Non-Cryst. Solids 97&98, 1107 (1987).
- [23] One exception is a-Si, for which X-ray measurements have very recently been carried out — cf. Ref. [7].
- [24] E. Wendler, P. Müller, T. Bachmann, and W. Wesch, J. Non-Cryst. Solids 176 85 (1994).
- [25] Y.K. Vohra, H. Xia, and A.L. Ruoff, Appl. Phys. Lett. 57, 2666 (1990).
- [26] K. Tsuji, Y. Katayama, N. Koyama, Y. Yamamoto, J.-Q. Chen, and M. Imai, J. Non-Cryst. Solids 156-158, 540 (1993).
- [27] K. Tsuji, Y. Katayama, Y. Yamamoto, H. Kanda, and H. Nosaka, J. Phys. Chem. Solids 56, 559 (1995).
- [28] V.A. Sidorov, V.V. Brazhkin, L.G. Khvostantsev, A.G. Lyapin, A.V. Sapelkin, and O.B. Tsiok, Phys. Rev. Lett. 73, 3262 (1994).
- [29] J.C. Phillips, Bonds and Bands in Semiconductors (Academic, New York, 1973), p. 31.
- [30] L. Cliche, S. Roorda, and R.A. Masut, Appl. Phys. Lett. 65, 1754 (1994).
- [31] K. Laaziri, S. Roorda, and L. Cliche, Nucl. Instr. Meth. in Phys. Research B 90, 438 (1994).
- [32] C. Ascheron, A. Schindler, R. Flagmeyer, and G. Otto, Nucl. Instr. and Meth. B 36, 163 (1992).
- [33] D.E. Polk, J. Non-Cryst. Solids 5, 365 (1971).
- [34] G.A.N. Connell and R.J. Temkin, Phys. Rev. B 9, 5323 (1974).
- [35] E.P. O’Reilly and J. Robertson, Phys. Rev. B 34, 8684 (1986).
- [36] G.T. Barkema and N. Mousseau, Phys. Rev. Lett. 77, 4358 (1996).
- [37] R. Car and M. Parrinello, Phys. Rev. Lett. 55, 2471 (1985).
- [38] P. Hohenberg and W. Kohn, Phys. Rev. 136, B864 (1964); W. Kohn and L.J. Sham, Phys. Rev. 140, A1133 (1965).
- [39] D.M. Ceperley and B.I. Alder, Phys. Rev. Lett. 45, 566 (1980).
- [40] J.L.A. Alves, J. Hebenstreit, and M. Scheffler, Phys. Rev. B 44, 6188 (1991).
- [41] L. Kleinman and D.M. Bylander, Phys. Rev. Lett. 48, 1425 (1982).
- [42] F. Tassone, F. Mauri, and R. Car, Phys. Rev. B 50, 10 561 (1994).
- [43] S. Minomura and H.G. Drickamer, J. Phys. Chem. Sol. 23, 451 (1962).
- [44] J.C. Jamieson, Science 139, 845 (1963).
- [45] C.Z. Wang, C.T. Chan, and K.M. Ho, Phys. Rev. B 39, 8586 (1989).
- [46] A. Dal Corso, private communication.
- [47] S.G. Louie, S. Froyen, and M.L. Cohen, Phys. Rev. B 26, 1738 (1982).
- [48] Landolt-Börnstein Numerical Data vol. III/17a p. 293, K.-H. Hellwege editor (Springer-Verlag, Berlin 1982).
- [49] S. Adachi, Physical Properties of III-V Semiconductor Compounds (Wiley, New York, 1992).
- [50] Semiconductors: Physics of Group-IV Elements and III-V compounds, edited by K.-H. Hellwege and O. Madelung, Landolt-Börnstein, New Series, Group III, Vol. 17, Pt. 6.3 (Springer-Verlag, Berlin, 1984).
- [51] O. Sugino and R. Car, Phys. Rev. Lett. 74, 1823 (1995).
- [52] S. Roorda, W.C. Sinke, J.M. Poate, D.C. Jacobson, S. Dierker, B.S. Dennis, D.J. Eaglesham, F. Spaepen, and P. Fuoss, Phys. Rev. B 44, 3702 (1991).
- [53] Q.-M. Zhang, G. Chiarotti, A. Selloni, R. Car, and M. Parrinello, Phys. Rev. B 42, 5071 (1990).
- [54] N.J. Shevchik and W. Paul, J. Non-Cryst. Solids 13, 1 (1973).
- [55] A. Dal Corso, F. Mauri and A. Rubio, Phys. Rev. B 53, 15 638 (1996).
| Sample | (Å) | Ref. | |||||||
|---|---|---|---|---|---|---|---|---|---|
| In-In | In-P | P-In | P-P | In-In | In-P | P-In | P-P | ||
| a-In33P67 | 2.98 | 2.59 | 2.58 | 2.20 | 1.5 | 2.5 | 1.8 | 2.2 | [20] |
| 1.8 | 3.0 | [20] | |||||||
| a-In35P65 | 2.80 | 2.58 | 2.58 | 2.24 | 1.2 | 2.8 | 1.6 | 2.5 | [21] |
| a-In40P60 | 2.76 | 2.57 | 2.58 | 2.24 | 0.9 | 3.1 | 2.2 | 1.8 | [21] |
| (K) | |
|---|---|
| 3000 | 2.13 |
| 2700 | 2.32 |
| 2400 | 1.96 |
| 2100 | 1.43 |
| (K) | In-In | In-P | P-P | Total | |||
|---|---|---|---|---|---|---|---|
| 3000 | 4.0 | 5.6 | 3.7 | 5.1 | 2.8 | 1.6 | 8.7 |
| 2700 | 4.0 | 5.6 | 3.6 | 4.8 | 2.8 | 1.8 | 8.5 |
| 2400 | 3.7 | 4.2 | 3.6 | 4.8 | 2.7 | 1.5 | 7.7 |
| 2100 | 3.5 | 3.4 | 3.5 | 4.6 | 2.7 | 1.4 | 7.0 |
| 3 | 4 | 5 | 6 | 7 | |
|---|---|---|---|---|---|
| c-InP | 0 | 0 | 0 | 4 | 0 |
| a-InP | 0.02 | 0.44 | 0.37 | 2.35 | 4.37 |
| a-GaAs | 0.05 | 0.10 | 0.21 | 1.37 | 0.76 |
| WB | |||||||||
|---|---|---|---|---|---|---|---|---|---|
| c-InP | 0 | 4 | 0 | 4 | 4 | 4 | 4.00 | 1.0 | 0 |
| a-InP | 0.34 | 3.91 | 0.38 | 4.25 | 4.29 | 4.27 | 3.55 | 0.84 | 8.4 |
| a-GaAs | 0.22 | 3.75 | 0.21 | 3.97 | 3.96 | 3.96 | 3.54 | 0.88 | 5.2 |
| 0 | 1 | 2 | 3 | 4 | 5 | 6 | 7 | |
|---|---|---|---|---|---|---|---|---|
| c-InP | 0 | 0 | 0 | 0 | 100 | 0 | 0 | 0 |
| a-InP | 0 | 0 | 0 | 1.9 | 71.3 | 24.7 | 2.1 | 0 |
| a-GaAs | 0 | 0 | 0 | 11.1 | 82.8 | 5.2 | 0.6 | 0.2 |